
Curriculum Deep Reinforcement Learning with Different Exploration
Strategies: A Feasibility Study on Cardiac Landmark Detection
Patricio Astudillo
1 a
, Peter Mortier
1
, Matthieu De Beule
1
and Francis Wyffels
2 b
1
FEops, Technologiepark 122, Zwijnaarde 9052, Belgium
2
Department of Electronics and Information Systems, UGent - imec, Technologiepark 126, Zwijnaarde 9052, Belgium
Keywords:
Biomedical Informatics, Cardiography, Medical Information Systems, Semi-supervised Learning.
Abstract:
Transcatheter aortic valve implantation (TAVI) is associated with conduction abnormalities and the mechanical
interaction between the prosthesis and the atrioventricular (AV) conduction path cause these life-threatening
arrhythmias. Pre-operative assessment of the location of the AV conduction path can help to understand the
risk of post-TAVI conduction abnormalities. As the AV conduction path is not visible on cardiac CT, the
inferior border of the membranous septum can be used as an anatomical landmark. Detecting this border
automatically, accurately and efficiently would save operator time and thus benefit pre-operative planning.
This preliminary study was performed to identify the feasibility of 3D landmark detection in cardiac CT
images with curriculum deep Q-learning. In this study, curriculum learning was used to gradually teach an
artificial agent to detect this anatomical landmark from cardiac CT. This agent was equipped with a small
field of view and burdened with a large action-space. Moreover, we introduced two novel action-selection
strategies: α-decay and action-dropout. We compared these two strategies to the already established ε-decay
strategy and observed that α-decay yielded the most accurate results. Limited computational resources were
used to ensure reproducibility. In order to maximize the amount of patient data, the method was cross-validated
with k-folding for all three action-selection strategies. An inter-operator variability study was conducted to
assess the accuracy of the method.
1 INTRODUCTION
Transcatheter aortic valve implantation (TAVI) has
become the preferred treatment for patients with aor-
tic stenosis at high risk for surgical aortic valve re-
placement (SAVR) (Smith et al., 2011). Recently,
studies concluded that TAVI was similar to SAVR
for intermediate-risk patients concerning the primary
end-point of death or disabling stroke (Leon et al.,
2016; Reardon et al., 2017). Very recent clinical data
showed that TAVI is at least as good as SAVR in low-
risk patients (Popma et al., 2019; Mack et al., 2019).
Although TAVI is less-invasive than SAVR, it is as-
sociated with an increased incidence of higher grade
atrioventricular (AV) block that requires permanent
pacemaker implantation (Reardon et al., 2017). The
conduction abnormalities are due to the mechanical
interaction between the prosthesis and the AV con-
duction path located near the aortic valve. Pre-
a
https://orcid.org/0000-0002-5503-6217
b
https://orcid.org/0000-0002-5491-8349
operative assessment of the location of the AV con-
duction path and the expected contact pressure in
this region can help to understand the risk of post-
TAVI conduction abnormalities (Hamdan et al., 2015;
Rocatello et al., 2018). As the AV conduction path
itself is not visible on the cardiac CT images, the in-
ferior border of the membranous septum can be used
as an anatomical landmark. Detecting the inferior
border of the membranous septum can be a difficult
task that dependents on operator experience, image
quality, and the patient’s anatomy. Detecting these
points in an automatic, accurate, and efficient man-
ner would save operator time and thus benefit pre-
operative planning.
Advancements in deep learning have shown that
there are supervised methods that can detect land-
marks in medical images (Zheng et al., 2012; Zheng
et al., 2015; Payer et al., 2016; Zhang et al., 2017;
Litjens et al., 2017; O’Neil et al., 2018; Al et al.,
2018). These methods analyse a delimited region of
interest and thus share the same limitation because
they require a region of interest annotation. In this
Astudillo, P., Mortier, P., De Beule, M. and Wyffels, F.
Curriculum Deep Reinforcement Learning with Different Exploration Strategies: A Feasibility Study on Cardiac Landmark Detection.
DOI: 10.5220/0008948900370045
In Proceedings of the 13th International Joint Conference on Biomedical Engineering Systems and Technologies (BIOSTEC 2020) - Volume 2: BIOIMAGING, pages 37-45
ISBN: 978-989-758-398-8; ISSN: 2184-4305
Copyright
c
2022 by SCITEPRESS – Science and Technology Publications, Lda. All rights reserved
37
study, we wished to overcome this limitation and ana-
lyse medical images that range from region-specific
to full-body scans.
Recent studies have shown that deep reinforce-
ment learning can be used to detect landmarks in
medical images regardless of their dimensions (Ghesu
et al., 2016; Ghesu et al., 2017a; Ghesu et al., 2017b;
Alansary et al., 2019; Sahiner et al., 2019). In these
studies, accurate results were obtained using a cluster
of computational resources. However, the follow-
ing difficulties may arise when exploring their meth-
ods. Deep reinforcement learning introduces novel
hyper-parameters on top of the already existing hyper-
parameters specific to deep learning and machine
learning. When a cluster of computational resources
is unavailable, the hyper-parameter search may re-
quire a considerable amount of time. Moreover, since
deep reinforcement learning is still developing, it is
essential to look into mechanisms that require addi-
tional research, e.g. the authors in two relevant stud-
ies (Ghesu et al., 2017b; Alansary et al., 2019) had a
different opinion on the definition of the halting sig-
nal for the artificial agent. Therefore, novel strategies
should be studied and evaluated in a reproducible
manner.
In this preliminary study, we aimed to identify the
feasibility of 3D landmark detection in cardiac CT
images with curriculum deep Q-learning. This novel
method of learning allowed us to use limited com-
putational resources and tune the hyper-parameters
accordingly. It also enabled us to evaluate three
strategies that drive the exploring character of the ar-
tificial agent: the already established ε-decay strategy
and two novel strategies α-decay and action-dropout.
Additionally, the agent was equipped with a larger
action-space and smaller state-space when compared
to the state-of-the-art. Each strategy was validated
with k-folding; a cross-validation method that allows
the usage of the entire dataset for validation while
maintaining a strict separation between the training
and validation dataset. An inter-operator variability
study was conducted to assess the accuracy of the
method.
2 MATERIALS AND METHODS
2.1 Patient and Imaging Data
This retrospective study used the anonymised data of
278 patients from multiple centers. The mean age of
this cohort was 80.7 ± 6.6 years, and 56% of the pa-
tients were female. The patient data consisted of volu-
metric cardiac CT images, which were acquired dur-
ing the pre-operative planning of a TAVI procedure.
Therefore, all CT images were contrast-enhanced and
contained a certain degree of aortic stenosis. The di-
mensions of the images ranged from regional scans,
centered around the aortic valve, to scans of the entire
body.
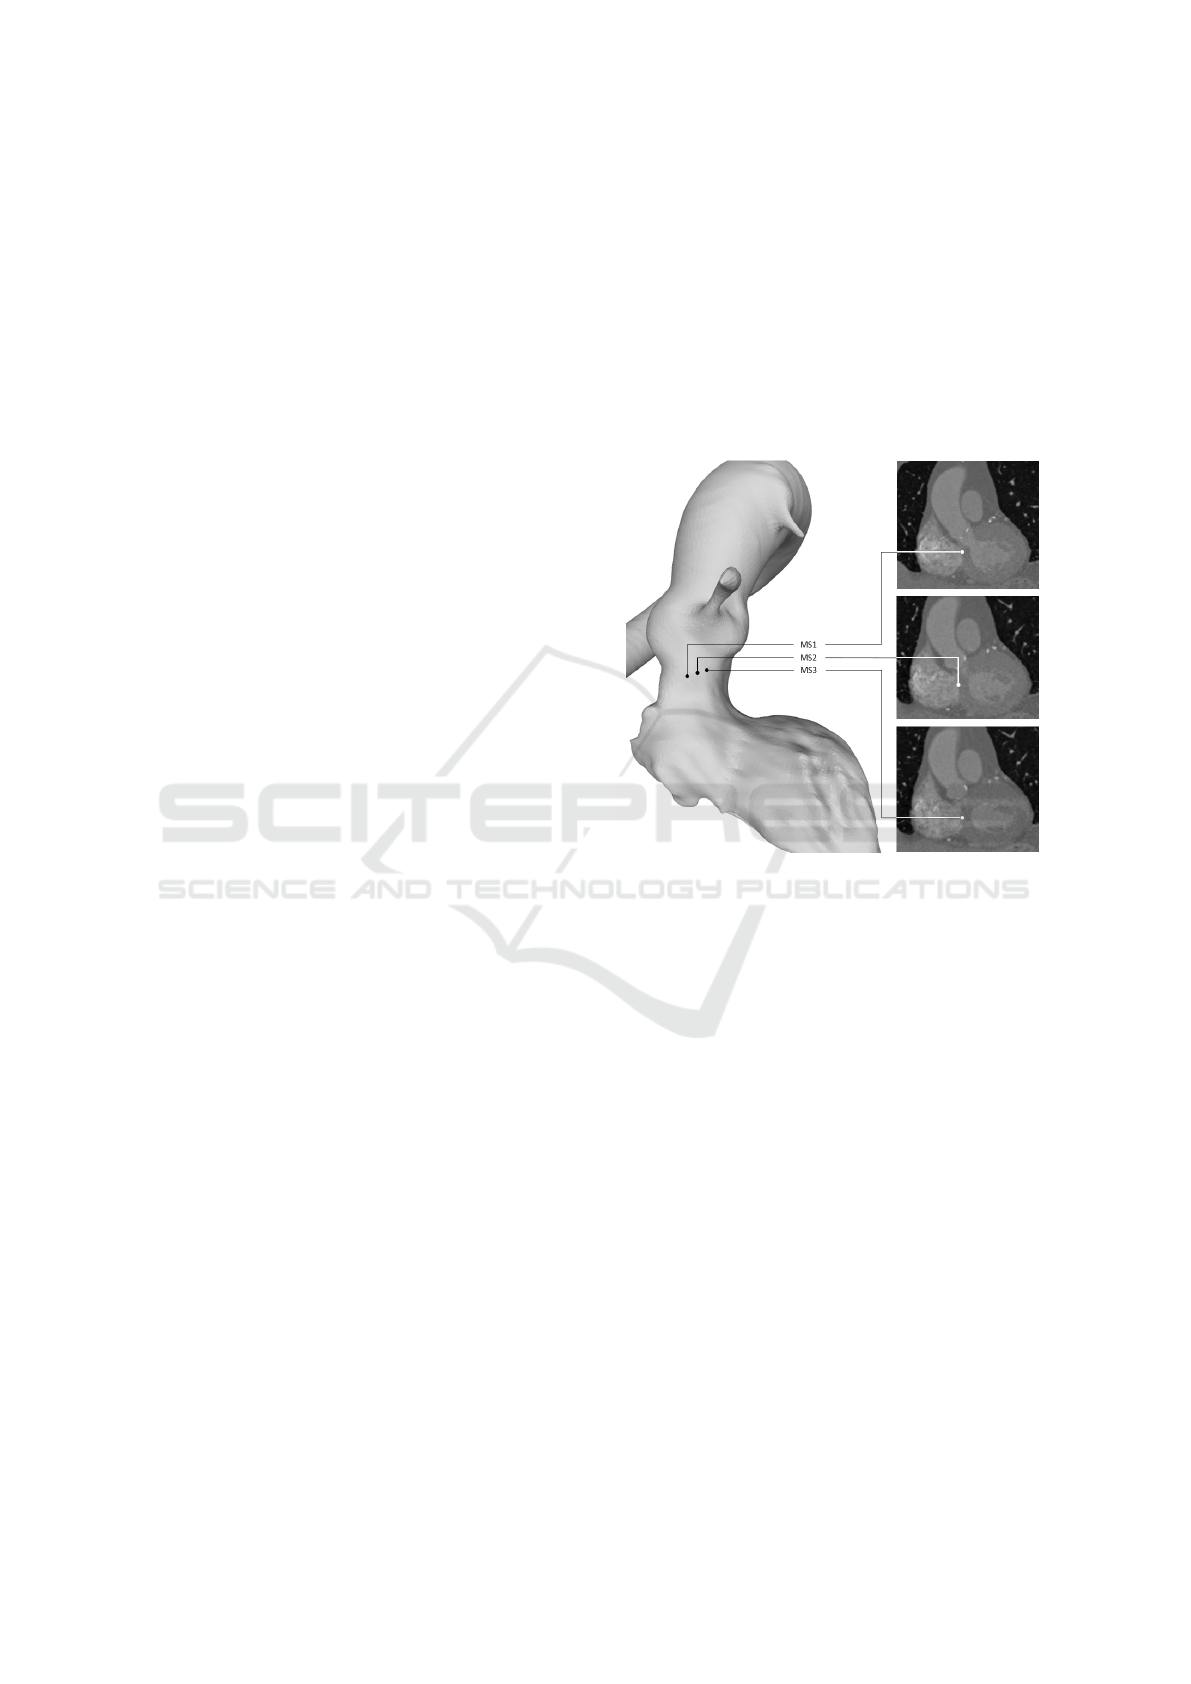
An expert analysed all images and identified the
inferior border of the membranous septum. Three
3D points defined this inferior border: MS1, MS2
and MS3 and were considered the ground truth in our
study (Figure 1).
Figure 1: The 3D view (left) and the coronal view (right)
of the aortic valve with the annotated ground truth points:
MS1, MS2 and MS3.
The volumetric CT images were preprocessed in
the following manner: first, they were resampled to
obtain a homogenous dataset after which they were
interpolated to isotropic resolutions of 1.0, 2.0, 3.0
and 5.0 mm using cubic spline interpolation. Finally,
all images were normalised.
2.2 Landmark Detection with
Reinforcement Learning
The task of detecting landmarks in medical images
with reinforcement learning can be described as fol-
lows. An artificial agent is positioned in an environ-
ment (an image) where it can walk around in search
of the target landmark. From its current position,
the agent has a limited field of view, causing it to
see only a small image patch (the state). Based on
its current state s, the agent needs to choose an ac-
tion a, which will move him closer towards the tar-
get landmark. After performing that action, the agent
will be at a new position in the image and thus have
BIOIMAGING 2020 - 7th International Conference on Bioimaging
38
a new state s’. The reward r for choosing an action
is the delta between the Euclidean distance from the
previous- and current position to the target landmark.
The agent’s experience is defined as s, a, s’ and r and
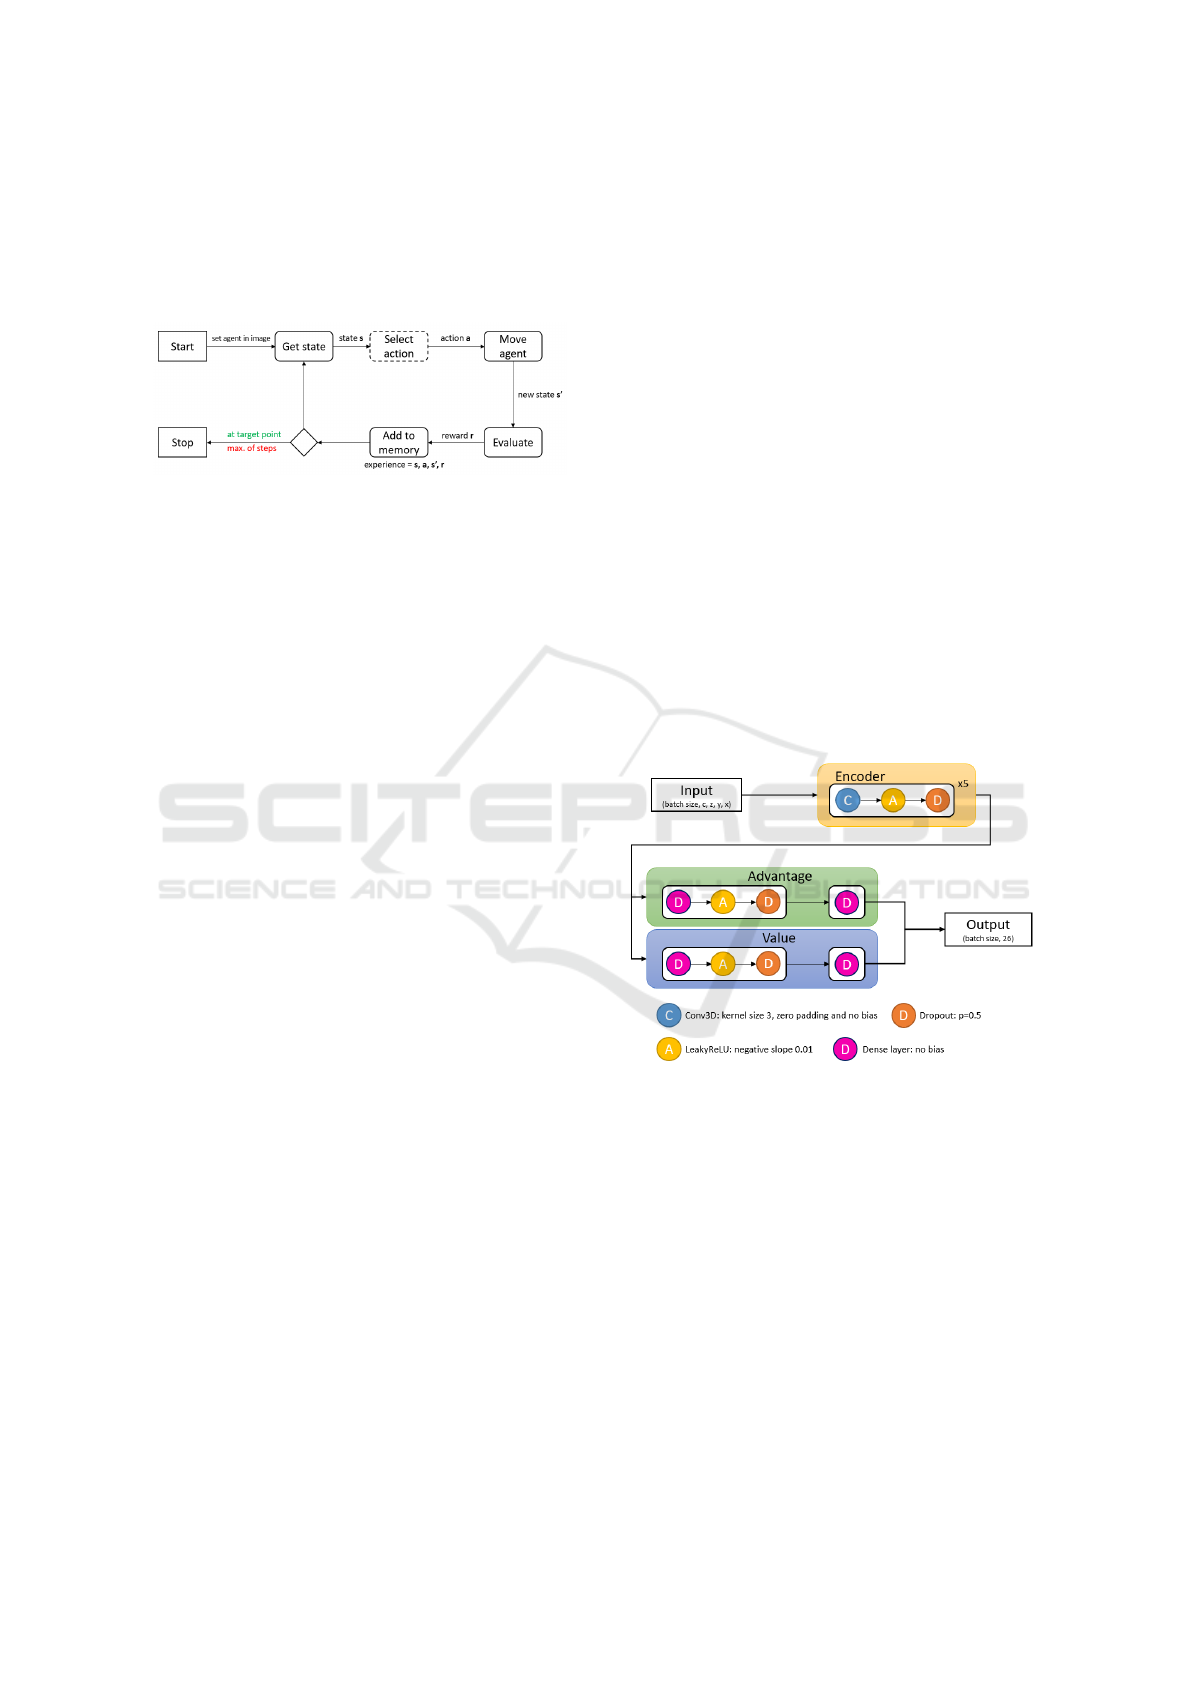
needs to be stored (Figure 2).
Figure 2: Overview of landmark detection in a medical im-
age using reinforcement learning. The agent will stop after
a maximum number of steps or when it has found the target
landmark. The ‘select action’ box in the figure is annotated
with a dashed line because this is where the action-selection
strategies will occur.
In this study, the environment was a cardiac CT
image with multiple resolutions (1.0, 2.0, 3.0 and
5.0 mm). The agent walked around in the CT im-
age with resolution 1.0 mm because the reward was
computed in this resolution. The states in the other
resolutions were obtained by translating the current
position to those resolutions. By using multiple res-
olutions, the agent had additional information about
its current position while preserving the dimensions
of the agent’s state (an 8
3
voxel cube). Addition-
ally, the agent could choose from 26 actions. This
action-space covered all the possible single-step dir-
ections in a 3D grid (except standing still). Other
studies, described an action-space of six actions and
state sizes of 25
3
voxels and 45
3
voxels (Ghesu et al.,
2017b; Alansary et al., 2019). After each move, the
experience of the agent was stored in prioritized ex-
perience replay memory (Schaul et al., 2015). This
type of memory enabled the optimization process to
train with experiences which had a higher priority (or
learning value) and resulted in faster convergence.
When the agent selects an action, it needs to know
which action will maximize the cumulative reward
over time or, to put it in other terms; the agent needs
to know policy π. This policy defines the agent’s be-
haviour and maps state to actions. The optimal policy
knows for every state which action to choose in order
to maximize the cumulative reward.
2.3 Landmark Detection with Deep
Q-Learning
Since it is not possible to map all possible states from
cardiac CT to actions, a function approximator is re-
quired. In our study, we used a convolutional neural
network (CNN) to approach the optimal policy by
learning the action-value function Q(s, a) (Mnih et al.,
2015). This has already been performed in studies
where a deep CNN or deep Q-network (DQN) was
trained with the experiences of the agent in order to
learn this action-value function (Ghesu et al., 2017b;
Alansary et al., 2019).
In our work, a double duelling DQN method was
used to learn this Q function. Two identical mod-
els were used to reduce the overestimation of the Q-
values. Before each training session, the weights of
the first model were randomly initialized (Saxe et al.,
2013) and copied to the second model. During each
training session, the first DQN model was used to re-
trieve the actions of the current observations and a
second (frozen) DQN model yielded Q-values during
the optimization process (Van Hasselt et al., 2016).
The weights of the first DQN were transferred to the
frozen DQN after a variable number of iterations (τ).
An advantage- and a value module were intro-
duced in the architecture (Figure 3). It was shown
that these modules enable the model to learn which
states contained a higher learning value regardless of
the effect of the action (Wang et al., 2015).
Figure 3: The architecture of the DQN model. The input
has the dimensions of the state. The output of the encoder
continues to an advantage- and value module. The output
of the model is the combination of the advantage- and value
output signals. The channel dimension c of the model stores
the multiple resolutions of the state at position x, y and z.
Teaching a DQN to learn this Q function with the
experiences of the agent requires iterative trial-and-
error. Based on its current state, the agent chooses
an action, which yields a new state, and the action is
evaluated by measuring the reward. Next, the DQN
is updated by using the Bellman equation (Bellman
et al., 1954). This equation returns the Q-value or
the maximum future reward, which is the immediate
reward for a given state and action and the maximum
future reward for the next state.
Curriculum Deep Reinforcement Learning with Different Exploration Strategies: A Feasibility Study on Cardiac Landmark Detection
39
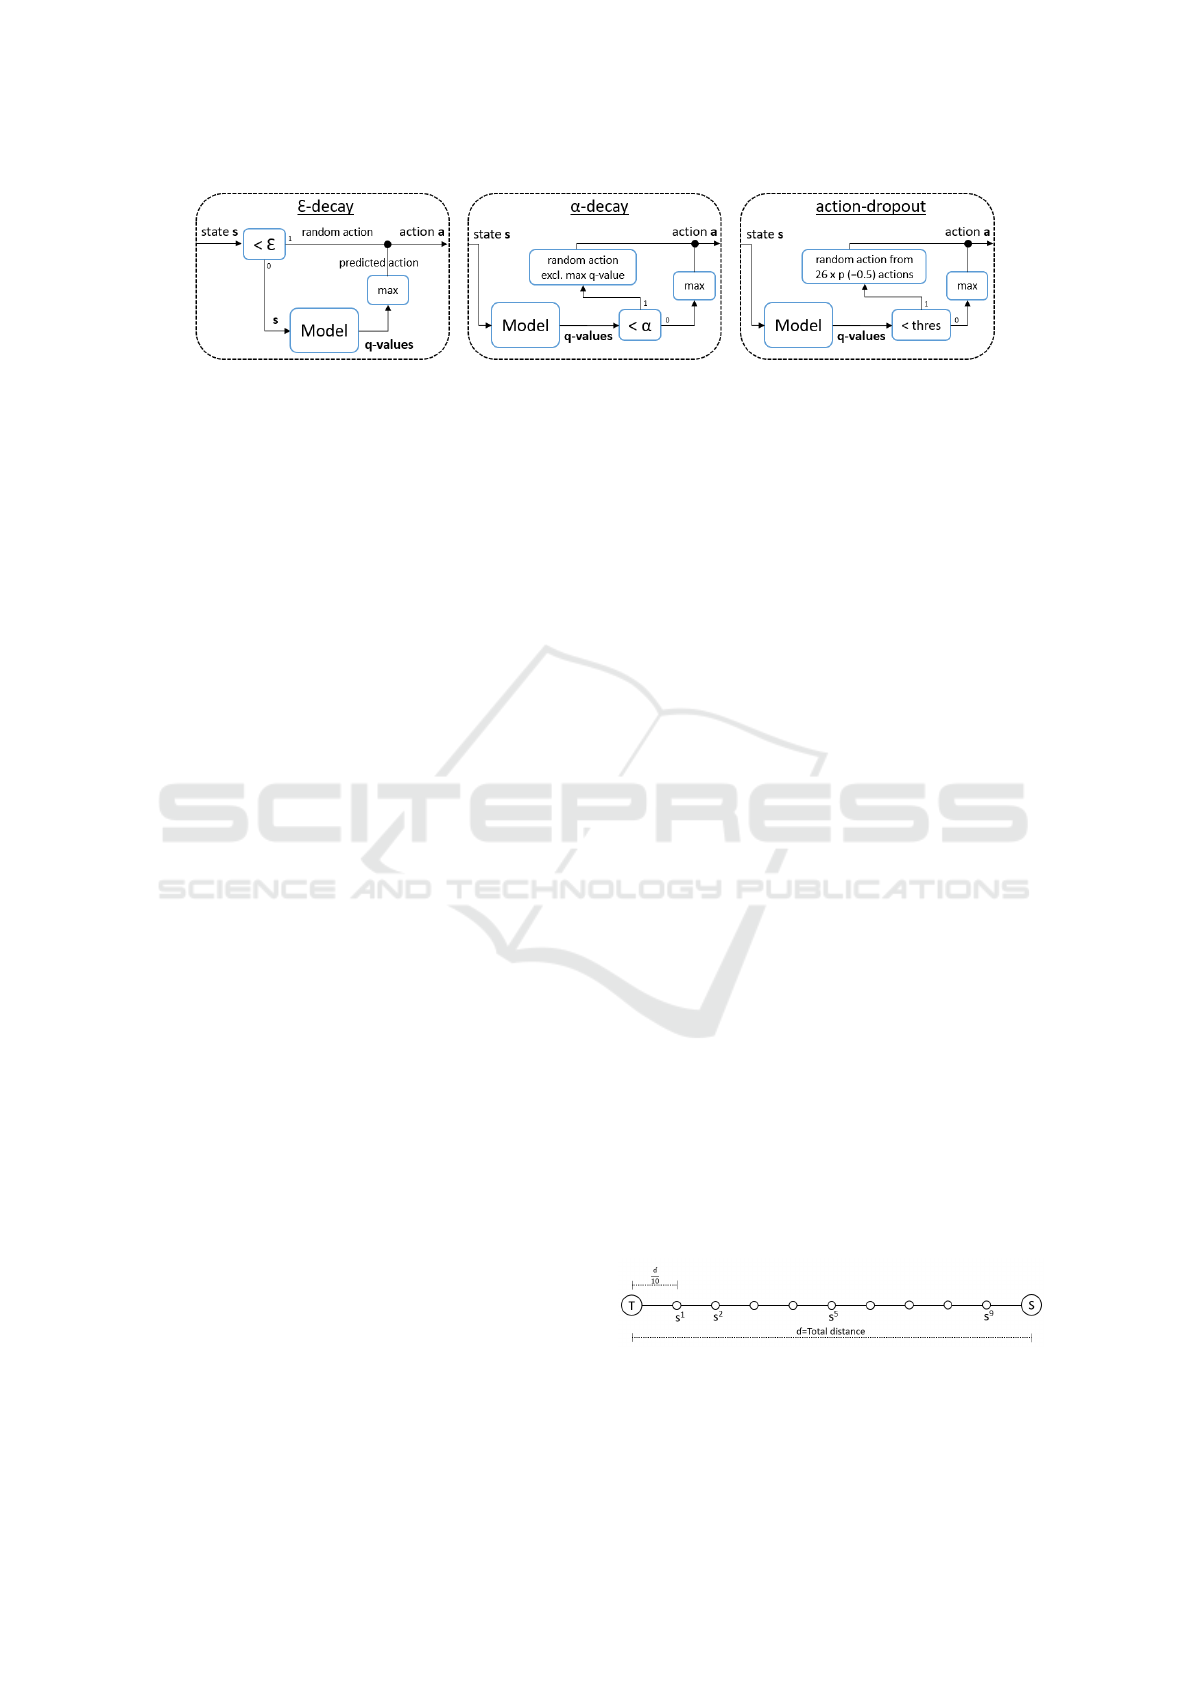
Figure 4: Overview of the three action-selection strategies: ε-decay, α-decay and action-dropout.
The model’s output yields the Q-values for each
action for the current state. The size of the output
of the DQN model, therefore, equals the size of the
action-space. In order to select the right action for
the current state, the index of the highest Q-value is
selected, which yields the maximum future reward for
the agent.
Initially, random actions are selected by the agent,
but this randomness needs to be reduced over time.
This process is usually guided by the established ε-
decay strategy; however, other strategies were ex-
plored in this work.
2.4 The Exploring Agent
To learn the pathway towards the target point, the
agent needs to explore and exploit paths. The explora-
tion is required at the beginning of the training to dis-
cover new directions towards the target point. The ex-
ploitation is required near the end of the training to es-
tablish discovered routes. In this study, we compared
three strategies to balance exploration and exploit-
ation: the established exponential ε-decay and two
novel strategies: α-decay and action-dropout (Figure
4).
Exponential ε-decay uses a value ε that drives the
decision for predicting an action or randomly select-
ing an action. An ε value needs to be decayed from
0.999 to 0.05 during training. When a random value
is smaller than the current ε value, random action is
chosen. Otherwise, the model predicts the Q-values
from the current state and the action with the highest
Q-value is selected as the predicted action.
Linear α-decay always uses the model to predict
the Q-values from the current state of the agent. An
α value needs to be linearly decayed from 1.0 to 0.0
during training. If a random value is smaller than the
current α value, the action with the highest Q-value
is ignored, and a random action between the remain-
ing 25 actions is selected. When applied, this strategy
ignores the highest Q-value on purpose, causing the
agent to find other routes to the target landmark. Oth-
erwise, the action with the highest Q-value is selected
as the predicted action.
Similar to α-decay, action-dropout always uses
the model to predict the Q-values from the current
state of the agent. A threshold value needs to be
linearly decayed from 1.0 to 0.0 during training. If
a random value is smaller than the current threshold
value, action-dropout is applied, which implies that a
percentage (p=0.5) of actions are removed from the
action-space, and a random action is selected from
the reduced action-space. If action-dropout is not ap-
plied, the action with the highest Q-value is selected.
In this study, we aimed to train a DQN model
with a larger action-space, a smaller state-space and
less computational resources than the state-of-the-art.
In order to overcome these challenges, we used cur-
riculum learning.
2.5 Landmark Detection with
Curriculum Deep Q-Learning
Curriculum learning (Bengio et al., 2009) is inspired
by the human education system, where students
start with a straightforward concept before learning
more advanced concepts. This multiple-concept ap-
proach was already applied to object detection, where
straightforward networks were trained first (Zhang
et al., 2016). In this study, curriculum learning was
applied to the linear distance between starting point
S (the center of the aortic root) and target point T
(one of the three landmarks: MS1, MS2 or MS3).
The distance between these points was split into ten
sub-starting points. The first and most straightforward
concept was defined as the path from the closest sub-
starting point s
1
to T. When the agent had learned this
path, the next starting points were processed until the
model had learned the longest path from S to T (Fig-
ure 5).
Figure 5: Graphical representation of the curriculum learn-
ing approach. The final goal was to learn an entire pathway
from the starting point S to the target point T.
BIOIMAGING 2020 - 7th International Conference on Bioimaging
40
2.6 Training
In order to train the models, the optimizer Adam
(Kingma and Ba, 2014) was used with a learning rate
of 0.5e-5. This optimizer was chosen to include ad-
aptive learning rates for different parameters. Since
the initial learning rate was set to a small value, no
learning rate decay was used.
Each time the agent was positioned at a starting
position, random uniform noise was added to this co-
ordinate which introduced a certain degree of posi-
tional variation and prevented overfitting.
2.7 Validation
The cohort size was relatively small (278 patients),
and k-folding cross-validation was used to validate
the method. K-folding (k=4) divides the entire dataset
randomly (with a fixed seed) into four sub-sets, and
the training and validation process is repeated four
times or folds. Each fold uses a different sub-set as
the validation dataset, and the remaining three subsets
are used as the training dataset. K-folding enables the
usage of the entire dataset as the validation dataset
while preserving the separation between training and
validation dataset.
The validation process was similar to the training
process except that the threshold value (used in the
action-selection strategy) was set to -1. This value
forced the agent to use the model to predict the action
from the current state.
2.8 Statistical Analysis
The accuracy of the landmark detection was assessed
by measuring the Euclidean distance from the pre-
dicted landmark to the ground truth landmark. All
variables were reported as median [lower quartile
(LQ) - upper quartile (UQ)]. The agreement between
ground truth and predicted landmarks were evaluated
using the non-parametric signed Wilcoxon test (with
a significant p-value <0.05).
2.9 Implementation
All the computational work was performed on a
multi-core computer with a Titan X GPU (NVIDIA
Corporation, Los Alamitos, CA). The models and
deep learning pipeline were developed with PyTorch
v0.4.1 (Paszke et al., 2017).
3 RESULTS
In this section, we discuss the results of the valida-
tion process, which were obtained by using the trained
models to analyse previously unseen data. The valid-
ation process was applied to all three action-selection
strategies. Cross-validation was applied to train and
validate the method for all three target landmarks:
MS1, MS2 and MS3. We obtained 278 validated
patients per target landmark as a result of using k-
folding. The action-selection strategies were com-
pared to each other by grouping the results of the
three target landmarks into 834 validated patients per
strategy. A total of 24 models were trained in this
study (each training session used two models), and 12
trained models were used to validate the three action-
selection strategies.
At the end of the curriculum learning algorithm,
the final path from starting point S to target point T
was learned. The Euclidean distance from the agent’s
final position to the target point was measured and
was considered the predicted landmark of the method.
The ε-decay and action-dropout strategy yielded sim-
ilar results, whereas the α-decay strategy was slightly
more accurate than the other strategies. The predic-
tion time of the full path for a single patient was below
1 second (Table 1).
Table 1: A summary of the Euclidean distances from the
predicted landmark to the target landmark for all three
action-selection strategies. Distances are reported as me-
dian [LQ - UQ].
Distance from target landmark [mm]
ε-decay α-decay action-dropout
MS1 2.4 [0.0-4.9] 1.2 [0.0-4.2] 2.3 [0.0-4.5]
MS2 3.0 [0.0-4.7] 0.0 [0.0-4.6] 2.0 [0.0-4.2]
MS3 2.2 [0.0-4.5] 1.4 [0.0-4.3] 1.0 [0.0-4.2]
All 2.4 [0.0-4.6] 0.0 [0.0-4.4] 2.0 [0.0-4.4]
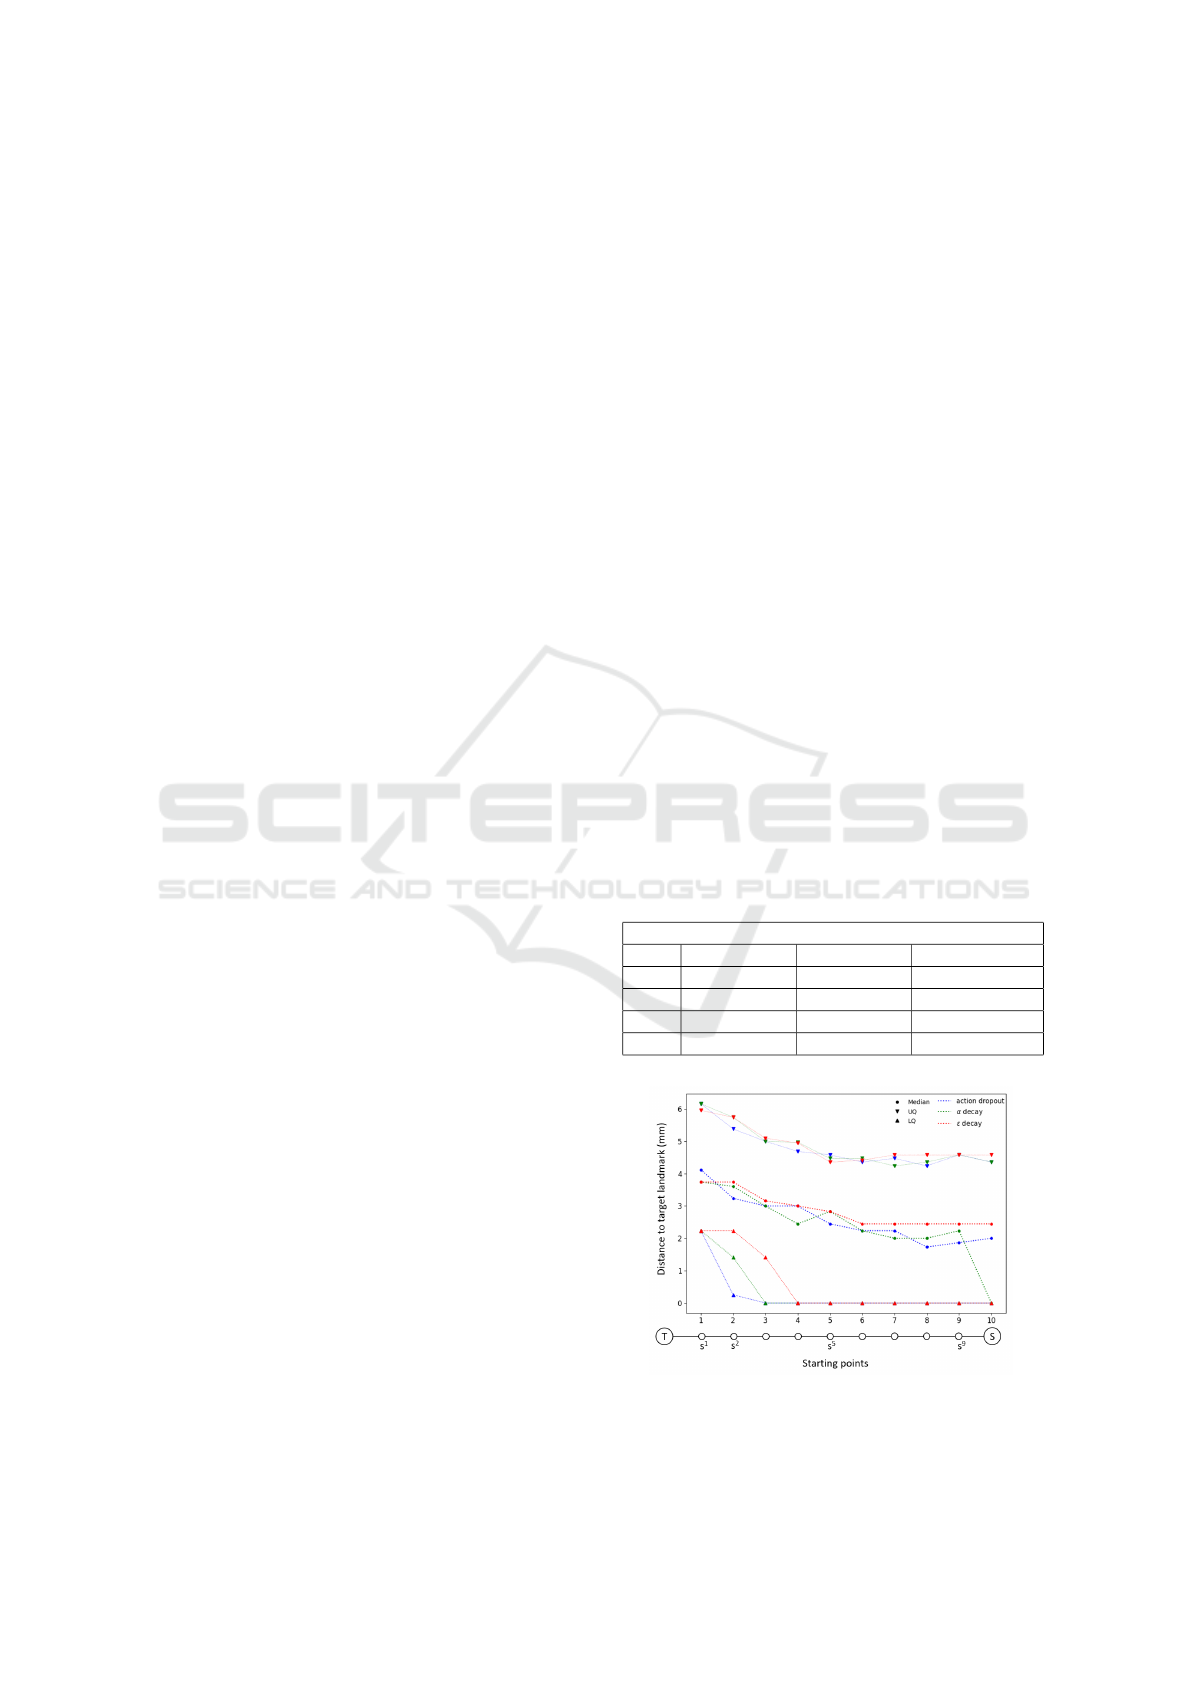
Figure 6: The evolution of the distances to the target
landmarks for each sub-starting point for all three action-
selection strategies.
Curriculum Deep Reinforcement Learning with Different Exploration Strategies: A Feasibility Study on Cardiac Landmark Detection
41
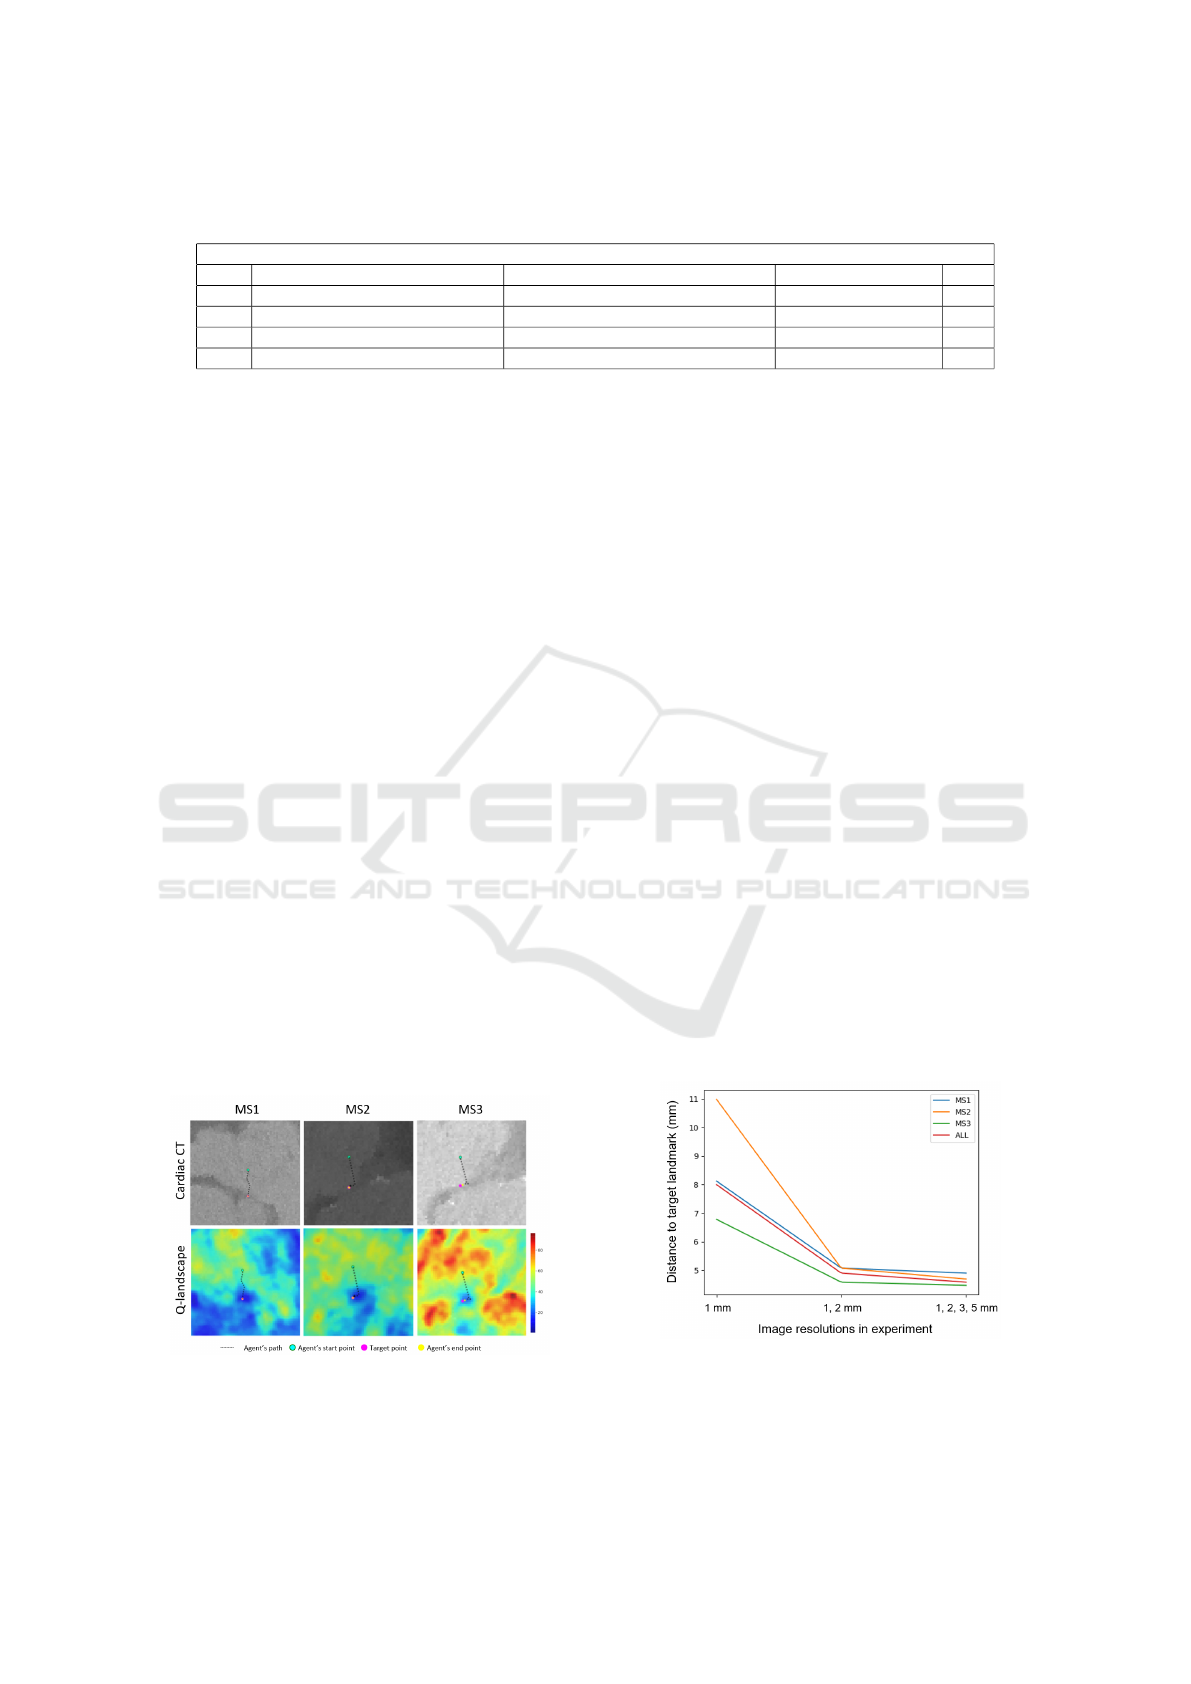
Table 2: Comparison of the Euclidean distances between the predicted and target landmarks (d
1
), and the target points
identified by the two observers (d
2
).
Distance from target landmark [mm]
α-decay vs observer 1 (d
1
) [mm] Observer 1 vs observer 2 (d
2
) [mm] Paired diff. (d
1
− d
2
) p
MS1 2.7 [0.0-5.1] 3.8 [2.8-5.6] 0.2 ± 7.9 0.1
MS2 0.0 [0.0-4.5] 3.4 [1.8-4.4] -1.3 ± 2.1 0.01
MS3 3.0 [0.0-4.3] 2.3 [1.4-4.8] -0.1 ± 3.0 1.0
All 2.6 [0.0-4.5] 3.1 [1.6-4.9] -0.4 ± 5.1 0.4
The agent’s performance during the curriculum
learning process was measured by validating the mod-
els before moving to the next sub-starting point. This
inter-algorithmic-validation resulted in Euclidean dis-
tances between the predicted points and T for each
of the ten sub-starting points. In order to com-
pare action-selection strategies, the distances for each
starting point were grouped per strategy. The dis-
tances to the target landmarks reduced overtime for
all three strategies. The α-decay strategy is similar
to the other strategies until the final starting point S,
where the median distance to the target landmark was
zero (Figure 6).
An inter-observer variability study was conducted
on 20 patients to assess the accuracy of the method.
The Euclidean distances between the landmarks an-
notated by the two observers were used as the dif-
ference between both observers. These differences
were compared to the predicted landmarks of the α-
decay strategy of the same 20 patients. The differ-
ences between the predictions of the model and the
first observer were overall lower than the differences
between both observers (Table 2).
3.1 Q-Landscapes
In order to provide additional insight into the agent’s
world view, we plotted Q-landscapes which show the
highest Q-values for the entire image (Figure 7).
Figure 7: The path of the agent in the cardiac CT image
(top) and the Q-landscape (bottom) for each of the target
landmarks: MS1, MS2 and MS3. The Q-values are depicted
as a heatmap (red are high and blue are low values).
The Q-landscapes were generated by convolving
a state-sized cube over the entire image and select-
ing the highest Q-value. This operation produced a
volumetric Q-landscape where each voxel represen-
ted the highest Q-value of that particular position. In
order to depict the 3D path of the agent, the path was
projected on a plane. This plane was defined by the
starting point, the target point and the center of those
two. Low Q-values can be observed around the target
landmarks.
3.2 Multiple Resolutions
The effect of using multiple resolutions was measured
on the ε-decay strategy. This strategy was chosen be-
cause it is an already established strategy. In order
to measure the effect, three experiments were con-
ducted, each time repeating the entire cross-validation
process. The first experiment contained only one res-
olution (1.0 mm), the second experiment contained
two resolutions (1.0 and 2.0 mm), and the final ex-
periment contained all available resolutions. The dis-
tances from the predicted landmarks to the target
landmarks are summarised in Figure 8. From this
plot, it is clear that the first experiment is the least ac-
curate and that the accuracy improves when the num-
ber of resolutions increases. This trend clearly shows
that the usage of multiple resolutions improves the ac-
curacy of the method.
Figure 8: Comparison of the Euclidean distances between
the predicted and target landmarks of experiments with dif-
ferent resolutions. Only the upper quartile values are plotted
for brevity reasons.
BIOIMAGING 2020 - 7th International Conference on Bioimaging
42

4 DISCUSSION
In this feasibility study, a curriculum deep Q-learning
method was proposed to detect the inferior border of
the membranous septum. We compared three action-
selection strategies: ε-decay, α-decay and action-
dropout, and it was shown that α-decay yielded
slightly more accurate results. The decaying nature
of this strategy can explain this: α-decay, when ap-
plied, deliberately omits the best action and chooses a
random action from the remaining action-space. The
other strategies, when applied, choose a random ac-
tion from the (reduced) action-space, which may in-
clude the best action. Our method was efficient since
the prediction time per patient was below 1 second,
and an inter-observer variability study confirmed the
accuracy.
Previous studies (Ghesu et al., 2016; Ghesu et al.,
2017b; Alansary et al., 2019) presented accurate and
efficient landmark detection methods from medical
images using deep Q-learning. The authors used
clusters of computational resources. In this study,
the computational resources were limited to a single
graphics processing unit (GPU). Additionally, these
studies used a larger state-space and a smaller action-
space. In this study, a state size of 8
3
voxels and 26
actions were used, which is, to the best of our know-
ledge, the first time such a small state-space and large
action-space was used to detect landmarks from volu-
metric (medical) images. We expected that a smaller
state-space and a larger action-space would prolong
or hamper the convergence of the models, but this was
not the case. It is our opinion that the incremental
character of curriculum learning was responsible for
the successful convergence.
Although this preliminary study has proven to be
promising, there are a few limitations to be noted.
First, the model only learns the path from the center
of the aortic annular plane (with small random oscilla-
tions) to the target landmarks. When the agent enters
areas outside the trained area or discovers image arte-
facts, it can get lost. This limitation will be handled
in future work, wherein the agent will be put on the
surface of a sphere around the target landmark with a
gradually increasing radius. Next, the cohort size was
relatively small, which prevented the introduction of
an independent test-dataset. Adding more patients to
the cohort can overcome this limitation and will in-
crease the robustness of the method. This limitation
can partially be addressed by applying a proper data-
augmentation strategy.
There are a couple of recommendations for fu-
ture work. First, a halting signal should be included.
This mechanism can be obtained by adding a stop-
ping action or measure oscillations in Q-values (as
described in (Ghesu et al., 2017b; Alansary et al.,
2019)). Next, searching for landmarks by using
multiple agents/workers could be considered ((Mnih
et al., 2016; Espeholt et al., 2018)). Finally, the task of
detecting landmarks with curriculum deep Q-learning
in volumetric images is computationally cheap yet
difficult enough to serve as a baseline to experiment
with novel deep reinforcement learning techniques.
5 CONCLUSIONS
Curriculum deep Q-learning was applied to detect
the inferior border of the membranous septum. The
output of this study is four-fold: first, the pre-
dicted landmarks were detected accurately and effi-
ciently. Next, we have proposed and validated two
novel action-selection strategies: α-decay and action-
dropout, and compared it to the already established ε-
decay strategy. Thirdly, the agent was equipped with
a small state-space and burdened with a large action-
space yet still managed to detect landmarks accur-
ately. Finally, the incremental character of curriculum
learning enabled the research into novel mechanisms
and strategies in the domain of deep reinforcement
learning.
ACKNOWLEDGEMENTS
The authors would like to thank both operators that
detected the landmarks from cardiac CT for both
ground truth and inter-operator data. All computa-
tional work was performed on NVIDIA GPUs from
the NVIDIA GPU Grant Program. This work was
supported by the European Commission within the
Horizon 2020 Framework through the MSCA-ITN-
ETN European Training Networks (project number
642458).
REFERENCES
Al, W. A., Jung, H. Y., Yun, I. D., Jang, Y., Park, H.-B., and
Chang, H.-J. (2018). Automatic aortic valve landmark
localization in coronary ct angiography using colonial
walk. PloS one, 13(7):e0200317.
Alansary, A., Oktay, O., Li, Y., Le Folgoc, L., Hou, B.,
Vaillant, G., Kamnitsas, K., Vlontzos, A., Glocker,
B., Kainz, B., et al. (2019). Evaluating reinforce-
ment learning agents for anatomical landmark detec-
tion. Medical image analysis, 53:156–164.
Curriculum Deep Reinforcement Learning with Different Exploration Strategies: A Feasibility Study on Cardiac Landmark Detection
43

Bellman, R. et al. (1954). The theory of dynamic program-
ming. Bulletin of the American Mathematical Society,
60(6):503–515.
Bengio, Y., Louradour, J., Collobert, R., and Weston, J.
(2009). Curriculum learning. In Proceedings of
the 26th annual international conference on machine
learning, pages 41–48. ACM.
Espeholt, L., Soyer, H., Munos, R., Simonyan, K., Mnih, V.,
Ward, T., Doron, Y., Firoiu, V., Harley, T., Dunning,
I., et al. (2018). Impala: Scalable distributed deep-rl
with importance weighted actor-learner architectures.
arXiv preprint arXiv:1802.01561.
Ghesu, F. C., Georgescu, B., Grbic, S., Maier, A. K.,
Hornegger, J., and Comaniciu, D. (2017a). Robust
multi-scale anatomical landmark detection in incom-
plete 3d-ct data. In International Conference on Med-
ical Image Computing and Computer-Assisted Inter-
vention, pages 194–202. Springer.
Ghesu, F. C., Georgescu, B., Mansi, T., Neumann, D.,
Hornegger, J., and Comaniciu, D. (2016). An artificial
agent for anatomical landmark detection in medical
images. In International Conference on Medical Im-
age Computing and Computer-Assisted Intervention,
pages 229–237. Springer.
Ghesu, F.-C., Georgescu, B., Zheng, Y., Grbic, S., Maier,
A., Hornegger, J., and Comaniciu, D. (2017b). Multi-
scale deep reinforcement learning for real-time 3d-
landmark detection in ct scans. IEEE transactions on
pattern analysis and machine intelligence, 41(1):176–
189.
Hamdan, A., Guetta, V., Klempfner, R., Konen, E.,
Raanani, E., Glikson, M., Goitein, O., Segev, A., Bar-
bash, I., Fefer, P., et al. (2015). Inverse relationship
between membranous septal length and the risk of at-
rioventricular block in patients undergoing transcath-
eter aortic valve implantation. JACC: Cardiovascular
Interventions, 8(9):1218–1228.
Kingma, D. P. and Ba, J. (2014). Adam: A
method for stochastic optimization. arXiv preprint
arXiv:1412.6980.
Leon, M. B., Smith, C. R., Mack, M. J., Makkar, R. R.,
Svensson, L. G., Kodali, S. K., Thourani, V. H.,
Tuzcu, E. M., Miller, D. C., Herrmann, H. C., et al.
(2016). Transcatheter or surgical aortic-valve re-
placement in intermediate-risk patients. New England
Journal of Medicine, 374(17):1609–1620.
Litjens, G., Kooi, T., Bejnordi, B. E., Setio, A. A. A.,
Ciompi, F., Ghafoorian, M., Van Der Laak, J. A.,
Van Ginneken, B., and S
´
anchez, C. I. (2017). A survey
on deep learning in medical image analysis. Medical
image analysis, 42:60–88.
Mack, M. J., Leon, M. B., Thourani, V. H., Makkar, R.,
Kodali, S. K., Russo, M., Kapadia, S. R., Malaisrie,
S. C., Cohen, D. J., Pibarot, P., et al. (2019). Tran-
scatheter aortic-valve replacement with a balloon-
expandable valve in low-risk patients. New England
Journal of Medicine, 380(18):1695–1705.
Mnih, V., Badia, A. P., Mirza, M., Graves, A., Lillicrap, T.,
Harley, T., Silver, D., and Kavukcuoglu, K. (2016).
Asynchronous methods for deep reinforcement learn-
ing. In International conference on machine learning,
pages 1928–1937.
Mnih, V., Kavukcuoglu, K., Silver, D., Rusu, A. A., Veness,
J., Bellemare, M. G., Graves, A., Riedmiller, M., Fid-
jeland, A. K., Ostrovski, G., et al. (2015). Human-
level control through deep reinforcement learning.
Nature, 518(7540):529.
O’Neil, A. Q., Kascenas, A., Henry, J., Wyeth, D., Shep-
herd, M., Beveridge, E., Clunie, L., Sansom, C., Se-
duikyte Keith Muir, E., and Poole, I. (2018). Attaining
human-level performance with atlas location autocon-
text for anatomical landmark detection in 3d ct data.
In Proceedings of the European Conference on Com-
puter Vision (ECCV), pages 0–0.
Paszke, A., Gross, S., Chintala, S., Chanan, G., Yang, E.,
DeVito, Z., Lin, Z., Desmaison, A., Antiga, L., and
Lerer, A. (2017). Automatic differentiation in pytorch.
Payer, C.,
ˇ
Stern, D., Bischof, H., and Urschler, M. (2016).
Regressing heatmaps for multiple landmark localiza-
tion using cnns. In International Conference on Med-
ical Image Computing and Computer-Assisted Inter-
vention, pages 230–238. Springer.
Popma, J. J., Deeb, G. M., Yakubov, S. J., Mumtaz, M.,
Gada, H., O’Hair, D., Bajwa, T., Heiser, J. C., Merhi,
W., Kleiman, N. S., et al. (2019). Transcatheter aortic-
valve replacement with a self-expanding valve in low-
risk patients. New England Journal of Medicine,
380(18):1706–1715.
Reardon, M. J., Van Mieghem, N. M., Popma, J. J., Klei-
man, N. S., Søndergaard, L., Mumtaz, M., Adams,
D. H., Deeb, G. M., Maini, B., Gada, H., et al. (2017).
Surgical or transcatheter aortic-valve replacement in
intermediate-risk patients. New England journal of
medicine, 376(14):1321–1331.
Rocatello, G., El Faquir, N., De Santis, G., Iannaccone, F.,
Bosmans, J., De Backer, O., Sondergaard, L., Segers,
P., De Beule, M., de Jaegere, P., et al. (2018). Patient-
specific computer simulation to elucidate the role of
contact pressure in the development of new conduc-
tion abnormalities after catheter-based implantation of
a self-expanding aortic valve. Circulation: Cardiovas-
cular Interventions, 11(2):e005344.
Sahiner, B., Pezeshk, A., Hadjiiski, L. M., Wang, X., Druk-
ker, K., Cha, K. H., Summers, R. M., and Giger, M. L.
(2019). Deep learning in medical imaging and radi-
ation therapy. Medical physics, 46(1):e1–e36.
Saxe, A. M., McClelland, J. L., and Ganguli, S. (2013).
Exact solutions to the nonlinear dynamics of learn-
ing in deep linear neural networks. arXiv preprint
arXiv:1312.6120.
Schaul, T., Quan, J., Antonoglou, I., and Silver, D.
(2015). Prioritized experience replay. arXiv preprint
arXiv:1511.05952.
Smith, C. R., Leon, M. B., Mack, M. J., Miller, D. C.,
Moses, J. W., Svensson, L. G., Tuzcu, E. M., Webb,
J. G., Fontana, G. P., Makkar, R. R., et al. (2011).
Transcatheter versus surgical aortic-valve replacement
in high-risk patients. New England Journal of Medi-
cine, 364(23):2187–2198.
BIOIMAGING 2020 - 7th International Conference on Bioimaging
44
Van Hasselt, H., Guez, A., and Silver, D. (2016). Deep re-
inforcement learning with double q-learning. In Thir-
tieth AAAI conference on artificial intelligence.
Wang, Z., Schaul, T., Hessel, M., Van Hasselt, H., Lanc-
tot, M., and De Freitas, N. (2015). Dueling network
architectures for deep reinforcement learning. arXiv
preprint arXiv:1511.06581.
Zhang, J., Liu, M., and Shen, D. (2017). Detecting
anatomical landmarks from limited medical imaging
data using two-stage task-oriented deep neural net-
works. IEEE Transactions on Image Processing,
26(10):4753–4764.
Zhang, K., Zhang, Z., Li, Z., and Qiao, Y. (2016). Joint
face detection and alignment using multitask cascaded
convolutional networks. IEEE Signal Processing Let-
ters, 23(10):1499–1503.
Zheng, Y., John, M., Liao, R., Nottling, A., Boese, J., Kem-
pfert, J., Walther, T., Brockmann, G., and Comaniciu,
D. (2012). Automatic aorta segmentation and valve
landmark detection in c-arm ct for transcatheter aor-
tic valve implantation. IEEE transactions on medical
imaging, 31(12):2307–2321.
Zheng, Y., Liu, D., Georgescu, B., Nguyen, H., and Coman-
iciu, D. (2015). 3d deep learning for efficient and
robust landmark detection in volumetric data. In In-
ternational Conference on Medical Image Computing
and Computer-Assisted Intervention, pages 565–572.
Springer.
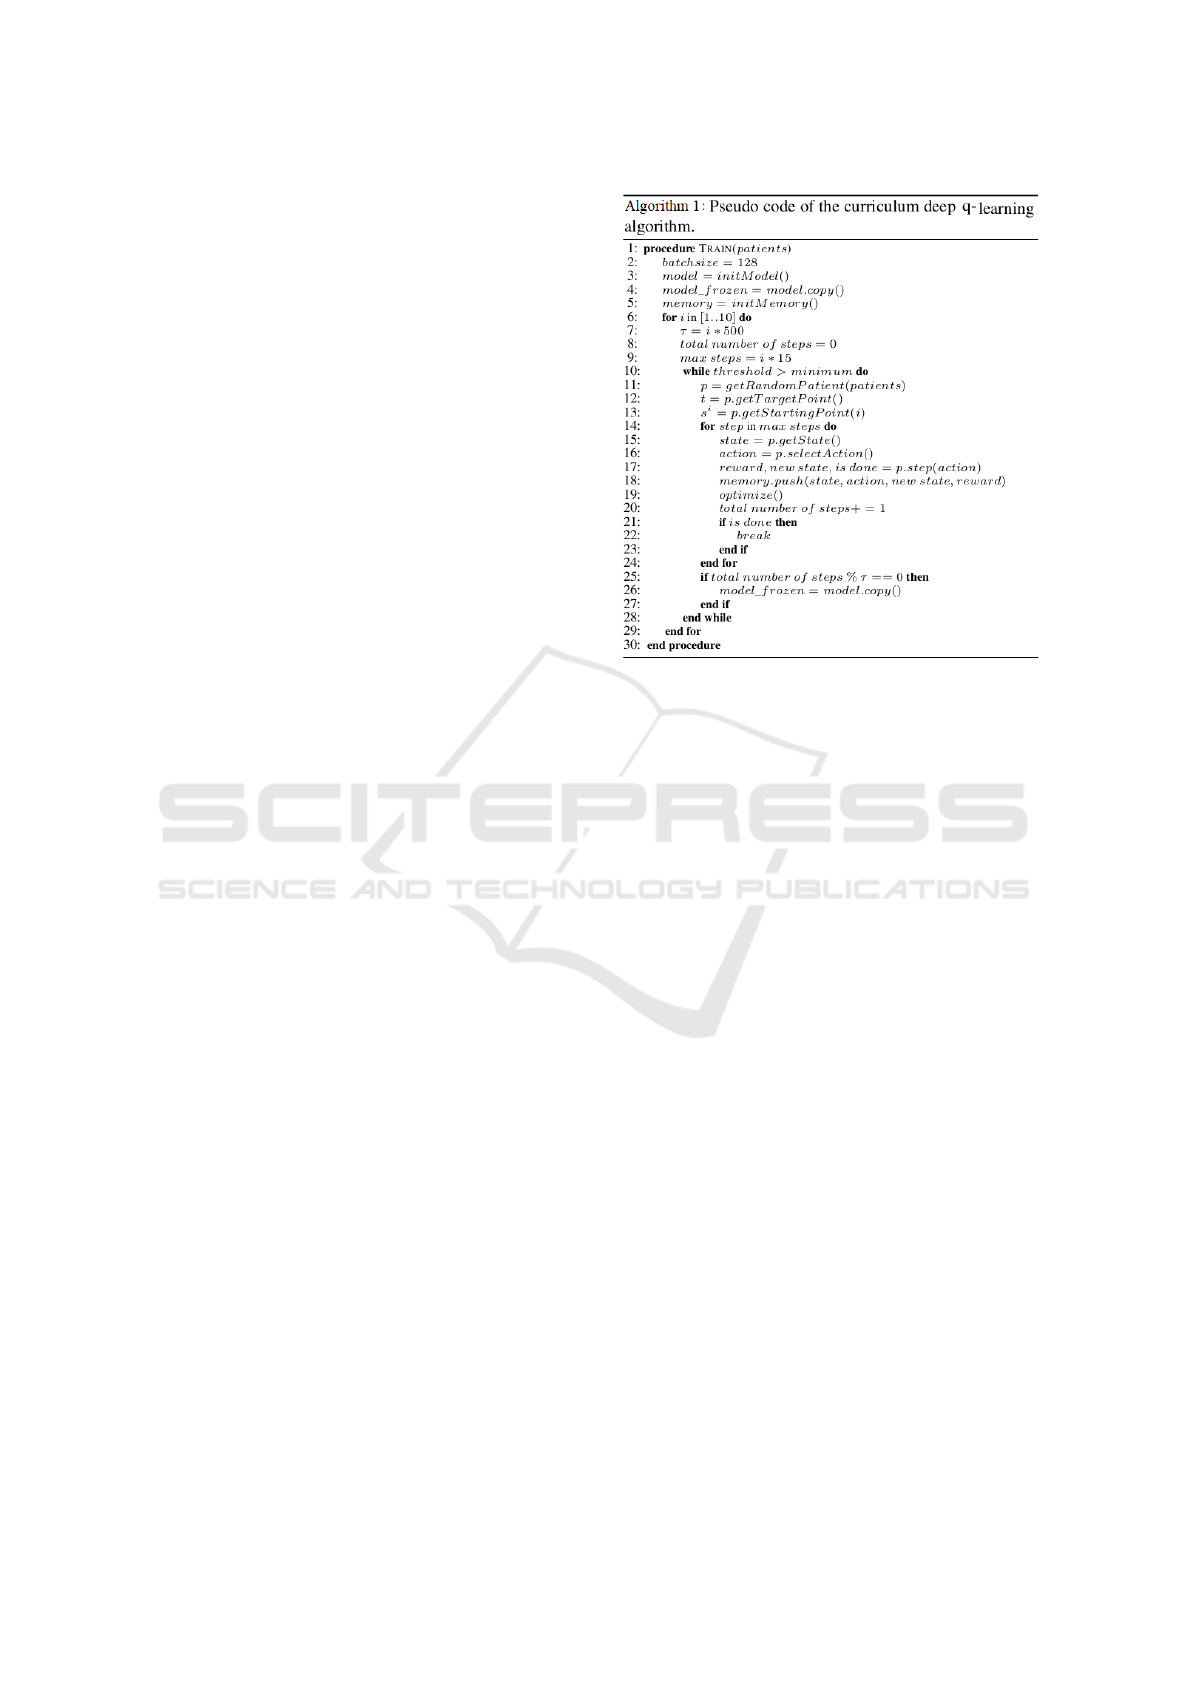
APPENDIX
Algorithmic Details
The pseudo-code of the used curriculum deep Q-
learning algorithm is presented in Algorithm 1.
The model learns the paths from starting point s
1
to s
10
or S. In this section; we explain a few para-
meters. The maximum number of steps that the agent
could make was initially set to 15 to avoid the agent
getting lost at the beginning of the algorithm. The al-
gorithm gradually increased the maximum number of
steps to ensure that the agent had enough time to reach
the target point. The number of iterations τ triggered
the weight transfer from the first DQN to the frozen
DQN and was initially set to a small value. There-
fore, numerous patients would pass before the weight
transfer. We observed that transferring the weights
too quickly resulted in models which were not able
to find the target point. The algorithm increased the
parameter τ when the starting points were set further
away from the target points.
Curriculum Deep Reinforcement Learning with Different Exploration Strategies: A Feasibility Study on Cardiac Landmark Detection
45
