
Assessing the Feasibility of using Augmented Reality to Visualize
Interventional Radiology Imagery
Christopher Bartlett
1
, Noelle LeRoy
1
, Damian Schofield
1
, Jonathan Ford
2
and Summer Decker
2
1
Department of Computer Science, State University of New York, Oswego, New York, U.S.A.
2
Department of Radiology, Morsani College of Medicine, University of South Florida, Tampa, Florida, U.S.A.
Keywords: Medical Visualization, Augmented Reality, Interventional Radiology, Surgery, Human Computer Interaction.
Abstract: Image-guided procedures, such as those in radiology, are frequently reliant on data which is visualized on
traditional monitors. In an operating theatre, these monitors are often placed at poor ergonomic positions,
causing physicians to rotate their heads to the side while their hands are working before them. This study
seeks to investigate whether visualizing data on an augmented reality headset that projects an image in front
of the participant will reduce task-time and increase efficiency. The primary purpose behind this study is to
alleviate neck and back pain in physicians performing data/image guided procedures. A number of augmented
reality headsets were tested in a clinical setting and a number of experiments were undertaken to test the
viability of this technology in an operating theatre. The experiment consisted of comparing the use of an
augmented reality headset against a computer monitor while performing tasks that required similar hand eye
co-ordination to that needed during a surgery. The research hypothesized that the use of an augmented reality
headset would increase accuracy and efficiency; while decreasing eye fatigue and neck/back pain.
1 INTRODUCTION
Interventional Radiology (IR) is characterized by
minimally invasive procedures which are guided by
images such as Computerized Tomography (CT),
fluoroscopy and ultrasound. These visualization
modalities allow interventional radiologists to guide
small instruments through the body in hopes of
avoiding invasive open surgeries.
Vascular Interventional Radiology (VIR) is a
subfield in which endovascular disorders are treated
using catheters, typically guided through
fluoroscopy. Peripheral artery disease, deep vein
thrombosis, and abdominal aortic aneurysms are
examples of some of the conditions treated through
VIR.
VIR is one of the fastest growing fields in
radiology as it combines surgical procedures with real
time medical imaging and visualization. In order to
accomplish this, special operating suites in the
hospital have been designed with live diagnostic
imaging (fluoroscopy) in addition to the standard
surgical equipment. In these operating suites several
large monitors surround the room to display the live
data from the scanners.
Physicians wear heavy protective vests while they
operate. These surgeons watch the images come on
the screens as they thread catheters through the
patient’s vascular system (BSIR, 2017).
Due to the need for multiple large pieces of
equipment to be installed within the operating suite,
space is at a premium. Often, the monitors displaying
VIR data and images are situated away from the
physician’s view of the patient and catheter controls,
causing the physician to consciously keep their hands
in the right position while their view is, in some cases,
at 90 degrees, or even behind their view of the patient.
This issue is unfortunately common, surgeons often
have to coordinate their movements with monitors in
distant locations while trying not to damage the
patient, an example is shown in Figure 1. It is delicate
work that can easily go wrong (Shinohara, 2015).
Due to the heavy vests that must be worn and the
badly positioned monitors, many surgeons using VIR
present neck and spinal pain and injuries from
constantly turning to see the images (Sacks et al,
2003). Not only does this present a health risk for the
surgeon, but it creates a larger risk in the patient as
erroneous movement of the catheter can lead to injury
or potentially death.
Bartlett, C., LeRoy, N., Schofield, D., Ford, J. and Decker, S.
Assessing the Feasibility of using Augmented Reality to Visualize Interventional Radiology Imagery.
DOI: 10.5220/0008947701690176
In Proceedings of the 15th International Joint Conference on Computer Vision, Imaging and Computer Graphics Theory and Applications (VISIGRAPP 2020) - Volume 3: IVAPP, pages
169-176
ISBN: 978-989-758-402-2; ISSN: 2184-4321
Copyright
c
2022 by SCITEPRESS – Science and Technology Publications, Lda. All rights reserved
169
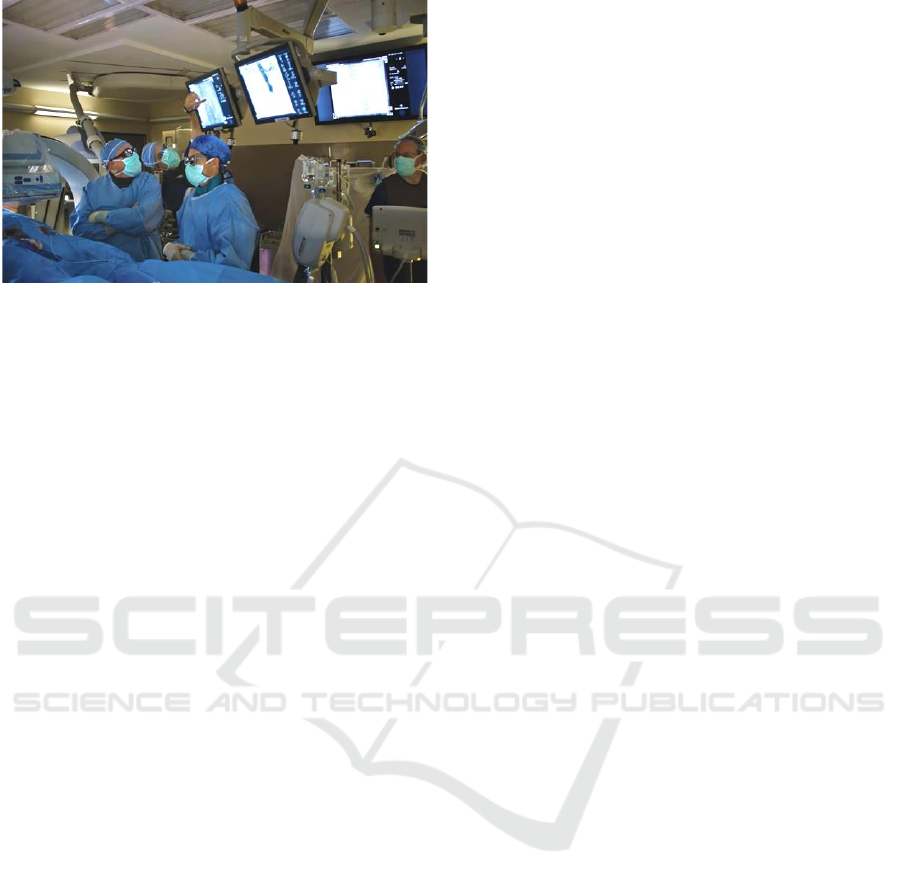
Figure 1: A surgeon rotates to view data on a monitor.
Common ergonomic problems during IR include
(Shinohara, 2015) :
• Neuromuscular fatigue due to heavy lead
protectors.
• Inappropriate work postures from unfavourable
arrangements of imaging equipment and their
displays.
• Impaired manoeuvrability due to placement of
imaging equipment and their displays.
• Eyestrain due to dim lighting.
• Neuromuscular fatigue during small calibre
catheter placement.
• Lack of intuitive usability and standardization of
IVR devices and their instruction manuals.
Shinohara (2015) specifically stated that the
configuration of the X-ray apparatus, displays and the
procedural table in the operating theatre usually
cannot be freely arranged, forcing the physicians to
manipulate the devices and their posture to
ergonomically poor positions.
This paper describes work undertaken to alleviates
the risk of injury during VIR operations, increase
perceived accuracy and precision, and potentially
decrease the surgical duration through the
introduction of an Augmented Reality (AR) based
visualization system into the operating theatre.
1.1 Medical Applications of AR
The use of VR has been widespread in the medical
field over the past few decades. The key application
area has primarily been in the realm of training
simulators. Clinicians can learn crucial perspectives
on surgical anatomy and repeatedly practice surgical
procedures until they gain the required skills before
performing surgery on ‘live’ patients. A number of
commentators have stated that this educational
technology is potentially as important to surgery as
the flight simulator is to aviation (Satava, 1993;
Ahlberg et al, 2002; Gallagher et al, 2005).
In recent years, many companies have announced
new AR products, specifically for the medical field
and the use of AR in many other fields of surgery
continues to be reported (ITN, 2017; Fritz et al 2012).
AR surgical applications have been reported in the
fields of maxillofacial surgery (Badiali et al, 2014),
dental surgery (Wang et al, 2014), soft tissue surgery
(Mountney, 2014), and endoscopic surgery (Ishioka
et al, 2014).
The use of AR in surgery is not a new idea, the
use of such systems have been discussed by
academics for many years. The first ‘see-through’
HMDs used for medical purposes were monocular
optical see-through devices which were typically
used to display a patient’s vital information (Keller,
State, and Fuchs, 2017).
Chen et al. (2015) used an optical ‘see-through’
HMD for surgical navigation. Using this AR surgical
navigation system, the surgeon can view a fused
image that virtually displays anatomical structures
such as the soft tissue, blood vessels and nerves
within the intra-operative natural environment. A
preoperative CT scan is performed on the patient, and
the obtained images are segmented so that 3D models
of the hard and soft tissue can be reconstructed. The
AR system is then used to integrate the virtual model
of the patient’s anatomical structures with the real
anatomical structures to aide in surgical navigation.
Diaz et al. (2017) undertook an interesting project
using the Google Glass display for image-guided
brain tumor resection. During brain tumor removal,
neurosurgeons look back and forth between the
surgical field and the navigation display which can
create a delay or, in worse cases, surgical error. The
resulting video feed was transmitted wirelessly to the
Google Glass display. The researchers did note that
cognitive attention could not be simultaneously given
to the operative field and the Google Glass display,
due to the fact that this display technology cannot
superimpose its image onto the surgical field, forcing
users to switch from one view to the other.
Although, at present there is no reported work on
real-time visualization of IR data using AR
techniques in a surgical situation, there is comparable
work being undertaken with Magnetic Resonance
Imaging (MRI) data. Marker et al (2017) report on
work undertaken on MRI-guided paravertebral
sympathetic injections utilizing AR navigation and
1.5 T MRI scanner. The underlying premise for using
imaging guidance is accurate needle placement in
order to provide optimal treatment while avoiding
problems. The study showed that the combination of
IVAPP 2020 - 11th International Conference on Information Visualization Theory and Applications
170
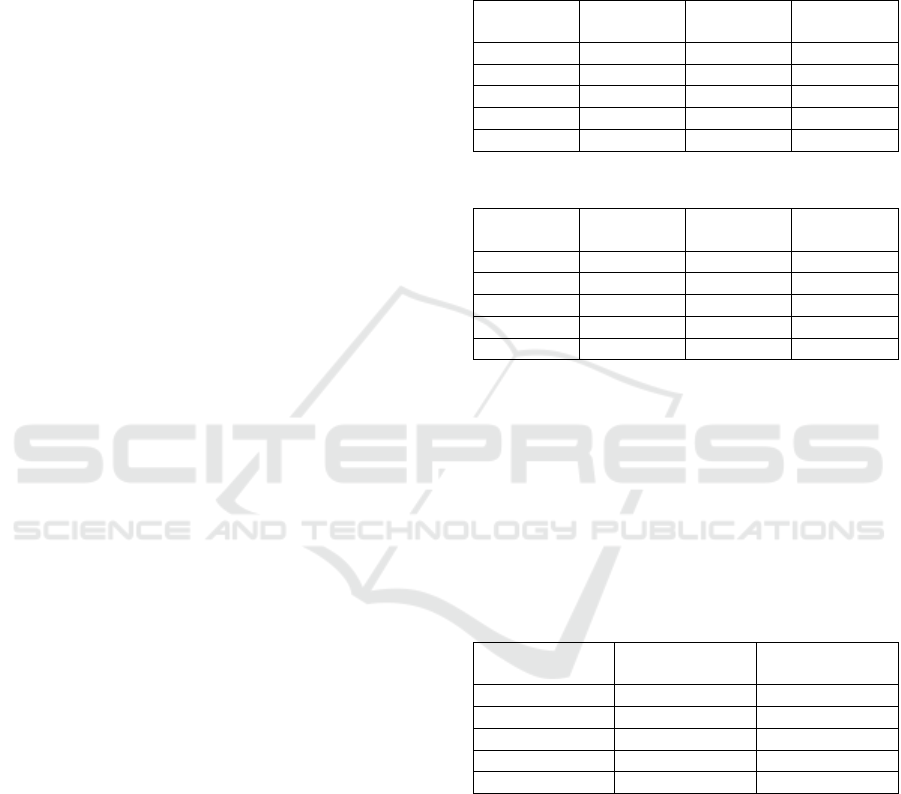
image-overlay navigation and the image quality of
interventional MRI at 1.5 T was able to readily define
accurate needle paths and provide safe needle
guidance in all cases (Marker et al, 2017).
The only similar project to the work described in
this paper was undertaken by the Maryland Blended
Reality Center (MBRC) at the University of
Maryland. In 2018, MBRC performed a live
demonstration where a trauma surgeon at the Cowley
Shock Trauma Center, performed an ultrasound
examination of a patient’s heart using AR displayed
on a Microsoft HoloLens. The success of this
demonstration led researchers to state that they
believe that AR and VR will become a widespread
technology used in surgery, making procedures
simpler and easier (Salopek, 2018).
2 MONITORING
The goal of this project is to improve the current use
of IR with vascular surgical procedures, leading to
fewer mistakes and patient complications. The
research project aims to reach this goal by reducing
the risk of injury during IR procedures by increasing
surgical accuracy and precision. This will be achieved
by decreasing the duration in which the radiologist is
looking away from the patient by introducing an AR
based visualization system into the operating suite.
2.1 Data Collection
Initially, data was collected on the existing conditions
under which the surgeons work. Presently,
radiologists at Tampa General Hospital work while
viewing the IR images on a monitor located on a
swinging arm within the operating theatre. Initial data
collection was undertaken in two discrete phases.
The first phase involved monitoring VIR
procedures and collecting data on how the physician
was positioned when they looked at the monitor with
the live IR feed. The second phase involved timing
how long the physician looked at the fluoroscopy feed
on the monitor with a stop watch.
The purpose of this data collection was to develop
a baseline which could be used to demonstrate
whether the AR headset could significantly reduce the
time the physician spends viewing the monitor feed.
2.1.1 Physician Position
Four lengthy VIR procedures were monitored and the
radiologist’s viewing of the monitor containing the
live visualization was recorded. The radiologist’s
head position, whether their hands were working,
whether they were standing upright or leaning over,
and the monitor’s position in relation to the
radiologist were all logged during each procedure
(Tables 1 and 2).
Table 1: Head rotations during each procedure.
Procedure
Number
80°
Rotation
60°
Rotation
55°
Elevation
1
10
5
0
2
0
0
5
3
5
1
0
4
16
15
0
Total
31
21
5
Table 2: Time viewing monitor during each procedure.
Procedure
Number
Surgery
Time
Viewing
Time
Working
& Viewing
1
2h 35m
3m 54s
3m 0s
2
1h 26m
12m 35s
7m 33s
3
1h 15m
12m 28s
6m 12s
4
2h 53m
13m 29s
8m 42s
Total
8h 9m
52m 26s
25m 27s
2.1.2 Physician Timing
Four additional, shorter procedures were viewed
while the physician’s time spent looking at the live
visualization was recorded using a stopwatch.
Recording began when the physician’s gaze shifted
towards the live monitor feed and ended when the
physician’s eyes shifted to any other object within the
room (Table 3).
Table 3: Time viewing monitor during each procedure.
Procedure
Number
Surgery
Time
Viewing
Time
5
28m
8m 11s
6
30m
12m 44s
7
20m
6m 15s
8
28m
4m 42s
Total
1h 46m
31m 52s
The State University of New York at Oswego and
the USF Health Morsani College of Medicine at the
University of South Florida in Tampa experimented
initially with two AR visualizations modalities:
• A micro-projector that could sit on a stable surface
and project an image onto the patient.
• A monocular headset that could be easily moved
around the physician’s line of vision.
Due to problems with both systems, it was
decided to take a step back, identify a different AR
syatem and undertake some formal and rigorous
Assessing the Feasibility of using Augmented Reality to Visualize Interventional Radiology Imagery
171

experimentation to empirically demonstrate the
benefits of introducing this technology into and
operating suite to view real time IR data.
3 EMPIRICAL TESTING
In deciding on the next steps to take, the team
investigated the work of the team from the MBRC,
viewing ultrasound visualisations on a Microsoft
Hololens (Salopek, 2018). After extensive
discussions with the medical faculty and surgeons in
Tampa, it was decided to take a similar path and
investigate the use of a Hololens to visualize real time
AR data during surgical procedures.
Initial trials were undertaken with the Hololens
allowing the surgeons to test the equipment and
discern whether they thought they could use it, or if
they would find it too bulky and obtrusive. Each
radiologist who tried it, gave a positive review, so it
was decided to proceed on this project using a
Microsoft Hololens.
Hence, the HMD that was selected for this phase
of the project was the Microsoft HoloLens (1st gen).
This was chosen due to its compact size, low weight
(579g), Wi-Fi and Bluetooth connectivity, see-
through holographic lenses, high output resolution
(1268x720), and battery life of approximately 2-3
hours. In addition, the HoloLens had the ability to
place projection-based AR anywhere within the
physician’s line of sight.
Following the problems experienced with the
Brother AiRScouter AR headset in a surgical setting
it was decided that the team should undertake some
empirical work to demonstrate the effectiveness of
this equipment in a surgical setting. It was decided to
run a sequence of experiments using an AR based
system, asking participants to undertake a series of
tasks that simulated the clinician viewing the imaging
feed, the patient [their task], and their hands with
minimal head movements. This study would then
compare the usage of an AR headset to complete the
tasks in order to evaluate whether the use of an AR
device would increase perceived accuracy, as well as,
speed efficiency of the tasks undertaken. We
hypothesize that the AR HMD will increase
efficiency, by decreasing timed tasks and neck/back
discomfort.
3.1 Experimental Method
These experiments attempted to test whether the
HoloLens will increase efficacy in the specific Tampa
operating suite under consideration. In this operating
suite, surgeons consciously keep their hands in the
right plane while frequently turning their head 60˚ to
80˚ away from the patient. A mock operating suite
was constructed to simulate the conditions under
which the surgeons operate (Figure 2).
During the experiments undertaken, participants
were requested to sit facing the workspace, monitor
A was set up above the workspace and was intended
only to be used in the high-level task phase of the
experiment. Monitor B is meant to imitate the VIR
monitor a surgeon would turn towards and was used
during both low-level and high-level tasks. Monitor
B was set up at an angle of 80˚ from the view towards
monitor A to simulate the operating suite conditions.
A video camera was set up to capture and record the
movements each participant makes while undertaking
the experimental tasks.
Figure 2: Experimental setup, a mock surgical suite.
The experiments were designed to require
participants to undertake tasks in which they would
need to coordinate their hand movements using
information displayed on a monitor and/or the AR
headset to determine which is more efficient and
allows for greater levels of focus on the task at hand.
In order to test whether the AR headset
visualization would outperform data displayed on a
static monitor (the control group), two different
skilled tasks were created, a high-level task and a
low-level task :
The high-level task is meant to require a sense of
direction, where navigation instructions come from
data and images displayed in a visualization that is
displayed separately to the task being undertaken.
This high-level task has the participants navigating
and completing a maze on Monitor A while the maze
IVAPP 2020 - 11th International Conference on Information Visualization Theory and Applications
172
layout is provided on either the Hololens or Monitor
B located at an angle of 80˚ on their right.
The low-level task was intended to be simpler than
the high-level task, but to involve a higher level of
haptic, physical manipulation – simulating the
physical operations a surgeon must perform while
operating. Here the participant will construct a Lego
object on the workspace, while the instructions are
provided on either the Hololens or Monitor B located
at an angle of 80˚ on their right side.
Each participant undertakes both tasks, one with
instructions being displayed on an AR headset, the
other getting instructions from monitor B. Half the
participants use the AR headset for the low-level task
and Monitor B for the high-level task, the other half
switch the visualization modalities.
The dependent variables within these
experiments are the time taken to complete the tasks,
the number of times the participants reference
monitor B, and the time’s spent looking at the
visualisations rather than at the task in hand.
This constructed environment will hopefully
simulate the radiology environment in such a way that
results from these tasks will not only correlate with
results found during testing in Florida but also
provide a justification for the introduction of this
technology into a surgical setting.
3.1.1 High-level Experiment
The high-level experiment utilized an immersive
dungeon game (Figure 3). Half of the participants
completed the high-level task using the HoloLens,
while the rest were asked to complete the tasking
using monitor to get instructions and navigation
information.
When using the AR HMD, the participant was
guided step by step, using several visual cues, to
complete the navigation task through the maze.
A series of contextual slides containing
navigation information were displayed and viewable
to the participant through the Hololens, this
information floated above monitor A, its position
varied slightly depending on the orientation of the
participant’s head while undertaking the task. In the
screen modality, the contextual navigation
information was displayed on monitor B.
When viewing through the AR HMD, the
participant was guided step by step, using several
visual cues, to complete the navigation task through
the maze.
A series of contextual slides containing
navigation information were displayed and viewable
to the participant through the Hololens, this
information floated above monitor A, its position
varied slightly depending on the orientation of the
participant’s head while undertaking the task. In the
screen modality, the contextual navigation
information was displayed on monitor B.
Figure 3: A participant using the game.
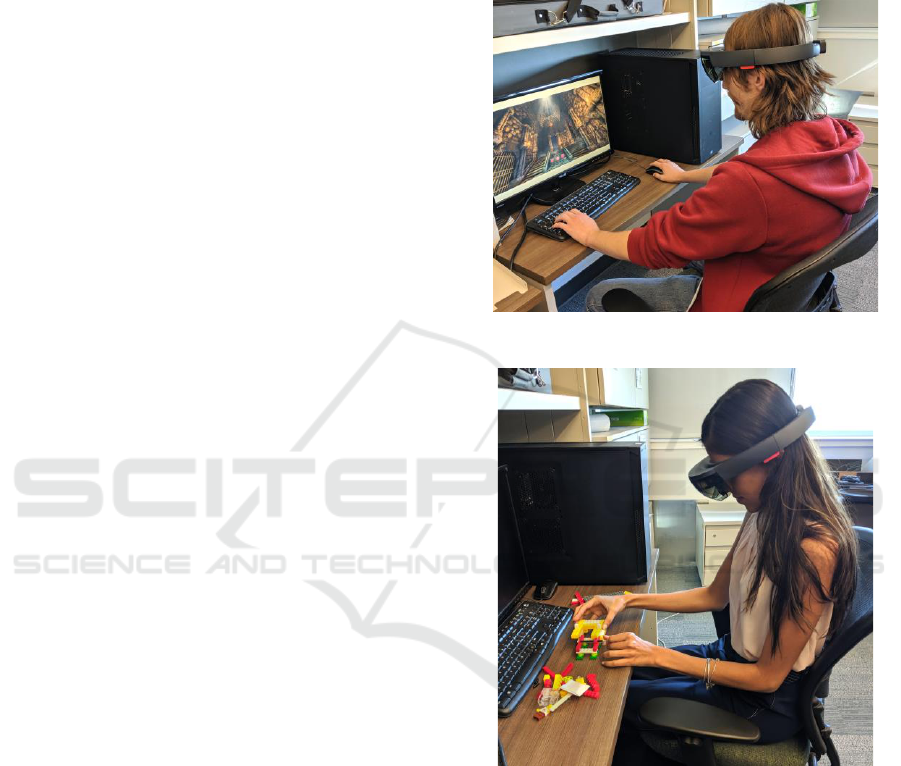
Figure 4: A Participant using the Lego.
3.1.2 Low-level Experiment
For the low-level LEGO task, participants are asked
to follow a step by step visual guide that, if followed
correctly, builds a LEGO bird in the workspace
provided in front of them (Figure 4).
A series of contextual slides containing construction
information were displayed and viewable to the
participant through the Hololens, this information
floated above monitor A, its position varied slightly
depending on the participant’s head orientation while
undertaking the task. In the screen modality, the
construction information was displayed on monitor
Assessing the Feasibility of using Augmented Reality to Visualize Interventional Radiology Imagery
173

Table 4: Experimental results, average completion times compared to time viewing visualization.
Game (Monitor B)
Game (Hololens)
Lego (Monitor B)
Lego (Hololens)
Average Time (s)
617.5
650.3
258.8
350.0
Number of Tasks
17
17
14
14
Time per Task (s)
36.3
38.3
18.5
25.0
Average View Time
2.87
4.35
3.31
4.07
Number of Views
37
29
39
27
Total View Time (s)
138.4
144.9
128.5
115.9
Viewing Ratio (%)
21.1
15.11
51.9
33.9
Table 5: Results of t Test comparing task times, number of views and view time (%) for the game task.
Modality
Mean
Std Dev
DF
t Stat
t Crit
p
Total Time
Monitor
617.5
231.5
10
-0.28
2.23
0.78
Headset
650.3
169.4
Number
of Views
Monitor
38.8
26.8
10
0.79
2.22
0.44
Headset
29.5
10.0
Total
View Time
Monitor
138.4
173.2
10
-0.07
2.23
0.93
Headset
144.9
105.8
View Time
(%)
Monitor
19.8
22.6
10
-0.11
2.23
0.909
Headset
21.1
15.11
Table 6: Results of t Test comparing task times, number of views and view time (%) for the Lego task.
Modality
Mean
Std Dev
DF
t Stat
t Crit
p
Total Time
Monitor
258.8
58.5
10
-1.37
2.23
0.20
Headset
350.0
151.6
Number
of Views
Monitor
39.0
8.2
10
2.32
2.22
0.04
Headset
28.2
7.9
Total
View Time
Monitor
128.5
12.9
10
0.92
2.23
0.75
Headset
115.9
30.8
View Time
(%)
Monitor
51.9
13.3
10
2.79
2.23
0.02
Headset
33.9
8.5
B. Discussion with medical professionals indicated
that these two tasks would sufficiently replicate the
navigation and haptic skills required during a surgical
procedure.
3.1.3 Procedure
There were a total of sixteen participants in this study,
who each undertook both tasks using a different
information modality for each task. The average age
of the participants was 22 and 66% of the participants
were female. It was felt that although the number of
participants was small, the sample size was large
enough to provide meaningful results.
The data is discreetly arranged into four
experimental conditions, for a 2x2 independent
sample t test. The modality of the display method (AR
headset, monitor B) was the between-subjects factor
and the difficulty of tasks (high-level, low-level) was
the within-subjects factor. The rejection level for all
analyses was set at p = .05.
A questionnaire was provided post experiment
and completed by every participant. This
questionnaire measured device comfort, image
quality rating and device satisfaction. It also
measured the perceived speed, accuracy, and eye
fatigue that the participant experienced.
4 RESULTS AND DISCUSSION
A summary of the results of the experiment are shown
in Table 4. The average completion time of the low-
level Lego task was lower than the completion time
of the high-level Game task. This was due to the
nature of the tasks themselves. The Lego task
consisted of 14 separate steps whereas the Game task
had 17 individual steps.
Participants viewed the AR headset visualization,
on average, for longer than the image on the monitor,
even when view times included the times taken for
IVAPP 2020 - 11th International Conference on Information Visualization Theory and Applications
174

the participants to rotate their head to see the screen.
This could be due to the unfamiliarity of the
participants with viewing information in the Hololens
or perhaps it took participants longer to focus and
read information from the Hololens display.
The majority of participants looked at the monitor
more often than looked at the visualization on the AR
headset. It is difficult to understand why this occurred
it could perhaps be because participants are used to
glancing at a monitor, whereas looking at the
Hololens screen was a more thoughtful action.
Participants viewed the Game visualization, on
average, for less than the Lego instructions on each
view. The time taken viewing the Lego instructions
was high ranging from 34% of task time on the
Hololens to 52% of task time on the monitor. Again
this is thought to be primarily related to the nature of
the task where participants had to spend more time
understanding the complex construction information,
rather than quickly checking their location on a map.
The visualization viewing time for the game task
was similar on both the Hololens and monitor, with
the monitor viewing time being slightly less.
However, the average time spent viewing the Lego
visualization on the Hololens was much less, as a
percentage of task time, than the time spent viewing
Running a number of t tests on the metrics from
the game task shows little significance between the
monitor visualization and viewing the visualizations
on the AR headset or on the monitor (Table 5).
This indicates that during the game task when
using either an AR headset or a monitor :
• The difference in time taken to perform the game
task is not significant.
• The difference in number of views of the
visualization is not significant.
• The difference in the total time viewing the
visualization is not significant.
• The difference in percentage of time spent looking
at the visualization is not significant.
Running a number of t tests on the metrics from
the Lego task however, shows some significance
between viewing the visualizations on the AR headset
or on the monitor. This indicates that during the Lego
task when using either an AR headset or a monitor :
• The difference in time taken to perform the game
task is not significant.
• The difference in number of views of the
visualization is significant.
• The difference in the total time viewing the
visualization is not significant.
• The difference in percentage of time spent looking
at the visualization is significant.
A possible explanation for the significance in the
different lower number of views was explained
above, where participants are used to glancing at a
monitor, whereas looking at the Hololens screen was
a more thoughtful action, taken as and when needed.
The difference in the view time can possibly be
explained by the time taken to rotate the head when
looking at the monitor. If this is removed from the
time looking at the screen, the two values would
become closer and the difference less significant.
While it is interesting to look at the time taken
with each modality, perhaps a more useful measure is
whether the Hololens worked as effectively as the
monitor as a visualization tool. Qualitative survey
results which were rated on a 5-point Likert scale :
• Participants rated the Hololens comfort at 3.2
• Image quality of the Hololens at 4.2
• Image quality of the monitor at 4.4
• Eye fatigue with the Hololens at 3.6
5 CONCLUSIONS
This study aimed to alleviate the risk of injury during
VIR operations, increase perceived accuracy and
precision, and potentially decrease the surgical
duration through supplementing the operating suite
with an AR based viewing system. It is believed this
would grant a clinician, a greater range of movement,
decreased cognitive load and improved focus.
We found evidence that shows a significance
regarding the number of times the participant’s
looked at the screen during the Lego task, which
required the participants to understand a range of
complex instructions (Table 6). Although the
participants viewed the visualization on the Hololens
less, they did look at the visualization for longer
periods of time. This could have been affected by a
participant’s familiarization with using a monitor.
The time spent viewing the visualization during
the game task was similar on both the Hololens and
monitor. However, the average time spent viewing
the Lego visualization on the AR headset was
significantly less, as a percentage of task time, than
the time spent viewing the monitor visualization. If
the time taken to rotate the head to the monitor is
factored in then the viewing time becomes equivalent.
The crucial aspect of this work involved
determining the effectiveness of the AR headset as a
replacement for the badly positioned monitor.
Participants rated the image quality of the
visualization on the AR headset slightly lower than
the monitor. A couple of participants complained that
Assessing the Feasibility of using Augmented Reality to Visualize Interventional Radiology Imagery
175

the HoloLens sat heavily on the bridge of their nose
during the experiment. This is perhaps an alternative
form of discomfort, replacing the back/neck strain
experienced by the surgeons.
A few participants mentioned that there was some
eye strain when trying to view the visualizations on
the AR headset. Another limiting factor was that the
virtual object rendered by the HoloLens may begin to
fade out if participants move their head or do not have
their view completely aligned. However, it should be
noted that the head movements required to correct
this problem involve only a few degrees of rotation.
However, it is perhaps important to note that
overall, ten participants greatly preferred the
Hololens to the monitor.
This experiment demonstrated the potential of our
hypotheses, that the implementation of an AR headset
as a visualization tool in a surgical setting could
increase the efficiency of timed tasks and decrease
neck/back pain among medical practitioners.
ACKNOWLEDGEMENTS
Many thanks to Bruce Zwiebel, MD and all the other
medical staff from the Morsani Center for Advanced
Healthcare in Tampa, Florida who donated their time.
We acknowledge the funding support of the
SCAC and the Festa Fellowship Programs at the State
University of New York.
Thank you to Brother International for providing
the Brother AiRScouter-200B for the initial trials.
REFERENCES
Ahlberg, G., Heikkinen, T., Iselius, L., Leijonmarck, C. E.,
Rutqvist, J., Arvidsson, D., 2002. Does Training in a
Virtual Reality Simulator Improve Surgical
Performance? Surgical Endoscopy, 16(1), 126-129.
Badiali, G., Ferrari, V., Cutolo, F., Freschi, C., Caramella,
D., Bianchi, A., Marchetti, C., 2014, Augmented
Reality as an Aid in Maxillofacial Surgery: Validation
of a Wearable System Allowing Maxillary
Repositioning. Journal of Cranio-Maxillofacial
Surgery, 42(8), 1970-1976.
British Society of Interventional Radiology (BSIR), 2017,
The Home of Image Guided Surgery, URL at
http://www.bsir.org/patients/what-is-interventional-
radiology/ (accessed 12/08/2019)
Diaz, R., Yoon, J., Chen, R., Quinones-Hinojosa, A.,
Wharen, R., Komotar, R., 2017, Real-Time Video-
Streaming to Surgical Loupe Mounted Head-Up
Display for Navigated Meningioma Resection, Turkish
Neurosurgery, 1.
Gallagher, A. G., Ritter, E. M., Champion, H., Higgins, G.,
Fried, M. P., Moses, G., Satava, R. M., 2005. Virtual
Reality Simulation for the Operating Room:
Proficiency-Based Training as a Paradigm Shift in
Surgical Skills Training, Annals of Surgery, 241(2),
364-372.
Imaging Technology News (ITN), 2017, Philips Announces
New Augmented-Reality Surgical Navigation
Technology, URl at
https://www.itnonline.com/content/philips-announces-
new-augmented-reality-surgical-navigation-
technology (accessed 12/08/2019).
Ishioka, J., Kihara, K., Higuchi, S., Nakayama, T.,
Takeshita, H., Yoshida, S., Fujii, Y., 2014. New Head-
Mounted Display System Applied to Endoscopic
Management of Upper Urinary Tract Carcinomas,
Brazilian Journal Urology, 40(6), 842-845.
Fritz, J., U-Thainual, P., Ungi, T., Flammang, A.J., Cho, N.,
Fichtinger, G., Iordachita, I.I., Carrino, J.A., 2012,
Augmented Reality Visualization With Image Overlay
for MRI-Guided Intervention: Accuracy for Lumbar
Spinal Procedures With a 1.5-T MRI System, American
Journal of Roentgenology 2012 198(3), W266-W273.
Keller, K., State, A., Fuchs, H., 2008. Head Mounted
Displays for Medical Use, Journal of Display
Technology, 4(4), 468-472.
Marker, D. R., Paweena, U., Thainual, T. U., Flammang, A.
J., Fichtinger, G., Iordachita, I. I., Fritz, J., 2017. 1.5 T
Augmented Reality Navigated Interventional MRI:
Paravertebral Sympathetic Plexus Injections.
Diagnostic and Interventional Radiology, 23(3), 227.
Mountney P., Fallert J., Nicolau S., Soler L., Mewes P.W.,
2014, An Augmented Reality Framework for Soft
Tissue Surgery. In: Golland P., Hata N., Barillot C.,
Hornegger J., Howe R. (eds) Medical Image Computing
and Computer-Assisted Intervention. Lecture Notes in
Computer Science, 8673, Springer, Cambridge.
Sacks, D., McClenny, T. E., Cardella, J. F., Lewis, C. A.,
2003. Society of Interventional Radiology Clinical
Practice Guidelines, Journal of Vascular and
Interventional Radiology, 14(9), S199-S202.
Salopek, J., 2018. Augmented and Virtual Reality in the IR
Suite, IRQuarterly, URL at https://connect.sirweb.
org/e-irq/participate/viewirqarticle?DocumentKey=4bf
c61a8-8b03-4e62-b78e-3e5a25fd88a4 (accessed
12/08/2019)
Shinohara, K., 2015. Ergonomic Investigation of
Interventional Radiology, Procedia Manufacturing, 3,
308-311.
Satava, R. M., 1993. Virtual Reality Surgical Simulator.
Surgical Endoscopy, 7(3), 203-205.
Wang, J., Suenaga, H., Hoshi, K., Yang, L., Kobayashi, E.,
Sakuma, I., Liao, H., 2014. Augmented Reality
Navigation with Automatic Marker-Free Image
Registration Using 3-D Image Overlay for Dental
Surgery, IEEE Transactions Biomedical Engineering,
61(4), 1295–1304.
IVAPP 2020 - 11th International Conference on Information Visualization Theory and Applications
176
