
Impact of Threshold Values for Filter-based Univariate Feature
Selection in Heart Disease Classification
Houda Benhar
1
, Ali Idri
1,2
and Mohamed Hosni
1
1
Software Project Management Research Team, ENSIAS, Mohammed V University, Rabat, Morocco
2
Complex Systems Engineering and Human Systems, Mohammed VI Polytechnic University, Ben Guerir, Morocco
Keywords: Data Preprocessing, Feature Selection, Univariate, Filter Technique, Heart Disease, Classification.
Abstract: In the last decade, feature selection (FS), was one of the most investigated preprocessing tasks for heart
disease prediction. Determining the optimal features which contribute more towards the diagnosis of heart
disease can reduce the number of clinical tests needed to be taken by a patient, decrease the model cost,
reduce the storage requirements and improve the comprehensibility of the induced model. In this study a
comparison of three filter feature ranking methods was carried out. Feature ranking methods need to set a
threshold (i.e. the percentage of the number of relevant features to be selected) in order to select the final
subset of features. Thus, the aim of this study is to investigate if there is a threshold value which is an
optimal choice for three different feature ranking methods and four classifiers used for heart disease
classification in four heart disease datasets. The used feature ranking methods and selection thresholds
resulted in optimal classification performance for one or more classifiers over small and large heart disease
datasets. The size of the dataset takes an important role in the choice of the selection threshold.
1 INTRODUCTION
Heart disease (HD) is a general term referring to a
variety of conditions and disorders that affect the
heart and blood vessels (Mendes et al., 2015). HD
types include coronary artery disease, valvular heart
disease, cardiomyopathy, heart rhythm disturbances
(arrhythmias) and heart infections. According to the
World Health Organization, an estimation of 17.9
million people died due to HD in 2016, representing
31% of all global deaths. An accurate and early
detection of cardiac diseases can save many lives by
monitoring heart activities (Mustaqeem, Anwar,
Majid, & Khan, 2017). Data mining (DM) offers a
set of powerful techniques that allow the
identification and extraction of relevant information
embedded in large data sets (Ting, Shum, Kwok,
Tsang, & Lee, 2009). DM can be very beneficial for
doctors and patients particularly in the case of
diseases with high mortality and morbidity rates
such as HD. Nonetheless, the quality of the
knowledge extracted highly depends on the quality
of the data used (Idri, Benhar, Fernández-Alemán, &
Kadi, 2018). A rigorous preprocessing of data before
using DM techniques is, therefore, mandatory (Ting
et al., 2009). A previous study on data preprocessing
tasks in heart disease knowledge discovery (Benhar,
Idri, & Fernández-Alemán, 2019), showed that
researchers were mainly interested in data reduction
and particularly in feature selection in order to
improve the performance of DM-based decision
support systems for HD prediction.
Feature selection is defined as the process of
detecting relevant features and discarding irrelevant
and redundant ones with the goal of obtaining a
subset of features that accurately describe a given
problem (Guyon, Steve, Masoud, & Lotfi, 2006). In
addition to its ability to improve the performance of
a DM model (Bolón-Canedo, Sánchez-Maroño, &
Alonso-Betanzos, 2015), FS has other advantages
such as shortening the number of measurements,
reducing the execution time and improving
transparency and compactness of the suggested
diagnosis (Huan & Lei, 2005; Jaganathan &
Kuppuchamy, 2013). FS algorithms are generally
classified as filter, wrapper or embedded models
(Jovic, Brkic, & Bogunovic, 2015). Filter feature
selection techniques consist of evaluating the
characteristics of the training data to select feature
subsets independently of any learning algorithm,
while wrappers use a targeted learning algorithm in
order to assess the performance of the selected
Benhar, H., Idri, A. and Hosni, M.
Impact of Threshold Values for Filter-based Univariate Feature Selection in Heart Disease Classification.
DOI: 10.5220/0008947403910398
In Proceedings of the 13th International Joint Conference on Biomedical Engineering Systems and Technologies (BIOSTEC 2020) - Volume 5: HEALTHINF, pages 391-398
ISBN: 978-989-758-398-8; ISSN: 2184-4305
Copyright
c
2022 by SCITEPRESS – Science and Technology Publications, Lda. All rights reserved
391

subsets (Bolón-Canedo, Sánchez-Maroño, &
Alonso-Betanzos, 2013). Embedded methods embed
the process of FS into the training process of the
learning algorithm. In addition to these three types
of FS techniques, researchers proposed new hybrid
approaches in order to consolidate the advantages
and eliminate the drawbacks of the individual ones
(Peter & Somasundaram, 2012).
FS methods can also be classified according to:
(1) univariate techniques (i.e. rankers) which provide
a ranking of features and the subset of selected
features can be determined by setting a cutoff
threshold or specify how many attributes to retain;
and (2) multivariate techniques which produce the
best subset of features based on a specific search
strategy using some performance measures. Several
studies in the literature made use of feature ranking
techniques to classify heart disease without
providing information about the threshold used to
select the final subset (Jabbar, Deekshatulu, &
Chandra, 2013, 2015; Peter & Somasundaram,
2012), or used a default threshold (Almuhaideb &
Menai, 2016) (e.g. selecting the 10 top ranked
attributes) for all feature ranking methods and over
all datasets.
The main purpose of this study is, therefore, to
evaluate and compare the impact of ReliefF, Info
Gain and Correlation feature ranking techniques
using different threshold values on the performance
of heart disease classification using four classifiers:
(K-Nearest Neighbor (KNN), Support Vector
Machine (SVM), Multilayer Perceptron (MLP)
neural network architecture and Decision Trees
(DT). The rationale behind choosing these four
classifiers is that they were the most frequently
employed techniques when developing classifiers to
diagnose HD patients (Kadi, Idri, & Fernandez-
Aleman, 2017; Shouman, Turner, & Stocker, 2012).
The experiments were performed using the Weka
3.8.3 software (Hall et al., 2009) using four heart
disease datasets taken from the UCI Machine
Learning Repository (Dua & Graff, 2019). The
classifiers were evaluated using three performance
criteria: accuracy, kappa statistic and area under the
ROC curve, and a 10-fold cross validation method.
The rest of the paper is organized as follows:
Section 2 presents an overview of the feature
selection and classification techniques used. The
experimental design is described in Section 3.
Results are presented and discussed in Section 4.
Findings and future work are presented in Section 5.
2 FEATURE SELECTION AND
CLASSIFICATION
TECHNIQUES
2.1 Feature Selection Techniques
2.1.1 ReliefF
ReliefF (Kononenko, Robnik-Šikonja, & Pompe,
1996) is an extension of the original Relief
algorithm (Kenji & A., 1992) that works by
randomly sampling an instance from the dataset and
then locating its nearest neighbor from the same
class (called nearest hit) and the opposite one (called
nearest miss). The rationale is that a good attribute
should have the same value for instances from the
same class and should differentiate between
instances from different classes.
2.1.2 Correlation
Correlation based feature selection, also known as
linear correlation or Pearson correlation coefficient,
measures linear correlation between two variables.
The resulting value ranges between -1 and 1, with -1
meaning perfect negative correlation, +1 meaning
perfect positive correlation and 0 meaning no linear
correlation between the two variables (Gooch,
2011).
2.1.3 Info Gain
Information Gain (Quinlan, 1986) is one of the most
common attribute evaluation methods. It uses
entropy to measure how much “information” a
feature gives us about the class considering a single
feature at a time.
2.2 Threshold Values
Several studies in the literature used different
thresholds that retain different percentages of
features (Bolón-Canedo et al., 2013; Hosni, Idri, &
Abran, 2017; Jaganathan & Kuppuchamy, 2013;
Seijo-Pardo, Porto-Díaz, Bolón-Canedo, & Alonso-
Betanzos, 2017). In (Bolón-Canedo et al., 2013), the
authors suggested selecting 40% of features if the
initial number of features ranges from 10 to 75.
Studies on fault prediction and software effort
estimation recommended the use of the top
Log_2(N) features of feature ranking techniques in
the Weka tool (Hosni et al., 2017), where N is the
number of features in the initial set. In this study, a
comparison between five different thresholds,
HEALTHINF 2020 - 13th International Conference on Health Informatics
392

including the aforementioned ones, is conducted.
The selected thresholds used are:
▪ Log_2(N): where N is the number of features in a
given dataset.
▪ 10%, 20%, 40%, and 50%: these thresholds select
the top 10%, 20%, 40%, and 50% of the most
relevant features of the final ordered rankings
respectively.
2.3 Classification Techniques
2.3.1 K-Nearest Neighbor
The k-nearest neighbor (KNN) algorithm assumes
that similar instances have similar classifications:
novel instances are classified according to the
classifications of their most similar neighbors. K is a
positive, and typically small, integer. An object is
classified by a plurality vote of its neighbours
(Cover & Hart, 1967).
2.3.2 Support Vector Machine
Support Vector Machines (SVMs) are a set of
related methods for supervised learning which
consist of creating a maximum-margin hyperplane
that lies in a transformed input space and splits the
example classes, while maximizing the distance to
the nearest cleanly split examples (Vapnik, 2000).
2.3.3 Multilayer Perceptron
Multilayer perceptron (MLP) is a feedforward neural
network model used for classification and regression
tasks and consists of, at least, three layers of nodes:
an input layer, a hidden layer and an output layer. In
the input layer each node represents an independent
variable. The outputs of the first layer are used as
inputs of the next layer and this procedure is
repeated recursively until finally the output layer is
reached (Gardner & Dorling, 1998).
2.3.4 Decision Trees
A decision tree (DT) is a decision support tool that
uses a tree-like model of decisions and their possible
consequences (Bhargava, Sharma, Bhargava, &
Mathuria, 2013). In a DT each node represents a
feature (attribute), each link (branch) represents a
decision (rule) and each leaf represents an outcome.
The variant of DTs used in this paper is C4.5 known
as J48 in Weka.
3 EXPERIMENTAL DESIGN
3.1 Datasets Description
Statlog Heart Dataset: This dataset contains 270
instances belonging to two classes: the absence
(class absent) or presence (class present) of heart
disease. The number of instances belonging to the
class absent is 150 while 120 instances belong to the
class present. The dataset contains 13 attributes in
addition to the class attribute.
Cleveland Heart Disease Dataset: Experiments
published on this dataset refer to using its processed
version which contains 13 attributes in addition to
the class attribute and 303 instances. In addition to
this version we used the unprocessed dataset which
contains 75 attributes and 282 instances, as we
believe it might contain valuable information. The
instances of both datasets belong to five classes
integer valued from 0 (no presence of heart disease)
to 4. Experiments with the Cleveland database have
concentrated on simply attempting to distinguish
presence (values 1, 2, 3, 4) from absence (value 0) of
heart disease. Therefore, all values from 2 to 4 were
replaced by 1 to determine patients with heart
disease. The number of healthy patients (belonging
to class 0) in the processed and the unprocessed
datasets is 164 and 157 respectively while the
number of heart disease patients is 139 and 125
respectively. The processed and unprocessed
datasets contain a total of 6 and 5968 missing values
respectively.
Arrhythmia Dataset: This database contains 452
instances belonging to 16 classes integer valued
from 1 (no presence of heart disease) to 16. In this
study we only concentrate on binary classification to
distinguish between the presence and absence of
heart disease. Therefore, the absence of heart disease
was indicated with the value 0 by replacing values of
1, and its presence with 1 by replacing all values
from 2 to 16. The number of healthy patients
(belonging to class 0) is 245 while 207 patients have
heart disease (class 1). The dataset contains 279
attributes in addition to the class attribute. The
dataset contains a total of 408 missing values.
3.2 Performance Measures
Three criteria were used to evaluate the performance
of the classifiers (Ferri, Hernández-Orallo, &
Modroiu, 2009): Accuracy, Kappa statistic and Area
Under the ROC (Receiver Operating Characteristics)
Curve or simply AUC.
Impact of Threshold Values for Filter-based Univariate Feature Selection in Heart Disease Classification
393

Accuracy is the rate of correct predictions made by a
classifier. The Area Under the Receiver Operating
Characteristics (ROC) Curve known as Area under
the curve (AUC) is an evaluation metric which
calculates the performance of a binary classifier by
adjusting the appearance of true positive results and
false positive results in the model. Furthermore, the
Kappa statistic measures the agreement between two
raters who each classify N items into C mutually
exclusive categories.
3.3 Methodology
In this study 10-fold cross validation method is used
to evaluate the performances of the classifiers (Arlot
& Celisse, 2010). KNN, SVM, MLP and DT
classifiers were applied using the default parameters
of the Weka tool. The procedure of the experiments
is as follows:
Step 1: For each dataset and each feature ranking
method, a feature ranking list is returned and the top
ranked features are selected using five thresholds.
Step 2: Build the different classifiers with each
feature subset as well as the entire feature set and
evaluate the classification performance using a10-
fold cross validation method to obtain accuracy,
kappa statistic and AUC scores.
Step 3: Cluster the classifiers using Scott-Knott test
(Scott & Knott, 1974) based on the Kappa criterion
in order to assess whether there is a significant
difference between the different classifiers.
Step 4: Rank the classifiers that belong to the best
Scott-Knott (SK) cluster using the Borda Count
voting system based on three performance criteria:
Accuracy, Kappa and AUC.
For the sake of clarity, the following
abbreviations were used: the feature ranking
technique ReliefF was denoted R, Info Gain was
denoted I and Correlation was denoted C.
Furthermore, to describe a feature subset selected
with a threshold and a ranker, the first number or
letter of the threshold was used along with the
abbreviation of the ranker. Furthemore, the entire
feature set was denoted ORG. For instance, SVMI4
means the classifier SVM trained using the subset
obtained with Info Gain and the threshold 40%.
4 RESULTS AND DISCUSSIONS
This section presents the empirical results of the
experiments. In order to apply feature selection and
train the different classifiers, a software prototype
based on Weka API was developed using Java
programming language under a Microsoft
environment, while the SK statistical test was
performed using R Software.
4.1 Missing Data Handling
The unprocessed Cleveland dataset contains twenty
attributes with a percentage of 100% of missing
values and two attributes with a percentage of 92%
and 24% missing values. As high percentages of
missing values can severely degrade the
classification performance (Almuhaideb & Menai,
2016), those attributes were removed from the
dataset along with the patient’s identification
number (id), the social security number (ccf) and the
name (name) attributes. Nine other attributes
contained a few missing values that did not
exceed 2%, and thus were not removed. After this
step, we are left with a total of 50 features in
addition to the class attribute. Furthermore, an
attribute containing 376 missing values (83%) was
removed from the Arrhythmia dataset resulting in a
total of 278 attributes in addition to the class
attribute.
4.2 Feature Ranking Results
Due to the limit number of pages, the datasets that
was further preprocessed by the authors to handle
missing values in addition to the datasets obtained
with feature selection will be available upon request.
4.3 Classification Results and
Discussions
For each dataset, a total of 64 variants were
evaluated. The SK test results in terms of kappa
measure for the four datasets are depicted in Fig. 1-
Fig.4. The SK identified two clusters in processed
Cleveland and Statlog datasets, four clusters in
unprocessed Cleveland and three clusters in
Arrhythmia dataset.
Fig. 1 shows that the best cluster contains a total
of 31 variants (lines in black) for the processed
Cleveland dataset. A diversity of classifiers trained
using different subsets appear in this cluster. Eight
SVM classifiers trained on subsets selected with I4,
I5, R4, R5, C4, CL, C5 and R5, in addition to
SVMORG, appear in this cluster. Furthermore, nine
MLP classifiers based on the original feature set and
subsets obtained with CL, IL, R4, R5, C4, C5, I4
and I5 belong to this cluster. The rest of the
classifiers belonging to the best cluster consist of
eight DTs based on subsets selected with I4, I5, C4,
HEALTHINF 2020 - 13th International Conference on Health Informatics
394

C5, R4, R5, IL, CL and five KNNs trained with
subsets obtained with C4, R4, R5, CL and IL.
From Fig. 2, it can be noticed that the best cluster
contains 32 classifiers for the Statlog dataset. As can
be observed, nine MLP classifiers induced from
subsets selected with IL, CL, R4, R5, I4, I5, C4, C5
and C2, in addition to MLPORG, appear in this
cluster. Moreover, eight SVM classifiers trained on
the original feature set and subsets selected with C4,
C5, I4, I5, R4, R5 and CL belong to this cluster. The
rest of the classifiers of the best cluster consist of
eight DTs based on subsets selected with R4, R5, I4,
I5, IL, CL, C5 and C2 and six KNNs trained with
subsets obtained with I4, R4, R5, IL, CL, C2.
Fig. 3 shows that the best cluster contains a total
of 29 best classifiers for the unprocessed Cleveland
dataset. Among these 29 classifiers we find ten
MLPs and ten SVMs induced from the original
feature set and subsets obtained using C2, C4, C5,
R2, R4, R5, I2, I4 and I5, and eight DT classifiers
trained using the original feature set and subsets
selected with R2, R4, R5, I4, I5, C4 and C5.
Besides, only KNNC5 belong to the best cluster.
As can be seen from Fig. 4, a total of 39 variants
are present in the first cluster for the Arrhythmia
dataset. In this cluster we can notice the presence of
fourteen SVM classifiers based on the original
feature set and reduced subsets selected with CL ,
C1, C2, C4, C5, R1, R2, R4, R5, I1, I2, I4, I5. In
addition, thirteen MLP classifiers based on subsets
selected with RL, R1, R2, R4, R5, IL, I1, I2, I4, I5,
CL, C1 and C4 belong to the best cluster. The rest of
the classifiers of the best cluster are DTs trained
with the original features and feature subsets
obtained with IL , I1, I2, I4, I5, R1, R2, R4, C4, R5,
C5. Note that no KNN classifier appears in the best
cluster for this dataset.
The first ten ranks of the best classifiers
according to the Borda count voting system are
given in Table 1.Borda count ranks the classifiers of
the best cluster based on kappa, accuracy and AUC
measures in order to gain more insight into the
results. Classifiers marked with the same letter (e.g.
ᵃ) have the same rank.
From Table 1, we observe that four classifiers
based on reduced feature subsets gave the best
performance for the Cleveland dataset. These
classifiers include SVMI5, SVMC5, MLPCL and
KNNCL with accuracies of 83.81%, 83.81%,
83.15% and 82.82% respectively. For the Statlog
dataset, the first ranked classifier is MLPIL
achieving an accuracy of 85.19%. For the
unprocessed Cleveland dataset all the ten first
classifiers achieved an accuracy of 100% while for
Arrhythmia dataset the best classifier is DTI2 with
an accuracy of 80.92%.
From the obtained results, different remarks can
be made:
- SVM classifiers proved to be very powerful
since even SVMs trained on the whole feature set
belonged to the best SK clusters for all datasets.
- The larger the dataset is the poorer KNN
classifiers perform since only one KNN
classifier(KNNC2) appears in the best SK cluster of
the unprocessed Cleveland dataset and no KNN
classifier belongs to the best cluster for Arrhythmia
which is not surprising since KNN is a memory-
based method..
- From the Borda count results we can notice that
the different subsets on which the best ten
classifiers, for Statlog and Cleveland datasets, were
based were mainly obtained with Log, 40% or 50%
thresholds which selected more attributes than 10%
and 20%. For the unprocessed Cleveland the subsets
were mainly obtained with 20%, 40% and 50%
which select more attributes than 10% and Log
while for Arrhythmia the selected subsets were
mostly obtained with 10%, 20%, 40% which
selected more attributes than Log and less than 50%.
Therefore, the size of the datasets plays an important
role in the choice of the thresholds.
- We believe that the different thresholds and
feature ranking methods presented in this study can
be tested with different datasets and classifiers in
other domains in order to obtain optimal results. In
fact, the results we obtained are very promising. For
example, for Cleveland dataset SVMI5 and SVMC5
trained on six attributes outperformed the results of
other studies, such as those of RBF trained on
subsets selected with Fuzzy Entropy and Mean
selection (81.75% with six selected attributes) or
Half selection (83.44% with seven selected
attributes) (Jaganathan & Kuppuchamy, 2013).
Furthemore, our SVM classifiers outperformed the
accuracy of fuzzy AHP and feed-forward neural
network (83%) trained on nine attributes selected
form Cleveland dataset with a modified differential
evolution algorithm (Vivekanandan & Sriman,
2017). Also for Statlog dataset MLPIL with only
three features achieved the same results of RBF
(85.19% with four selected attributes) with Fuzzy
Entropy feature ranking and Neural Network for
threshold selection. Moreover the MLPIL classifier
achieved the same accuracy of MLP classifier with
a hybrid feature selection method which also
selected three features in
Impact of Threshold Values for Filter-based Univariate Feature Selection in Heart Disease Classification
395
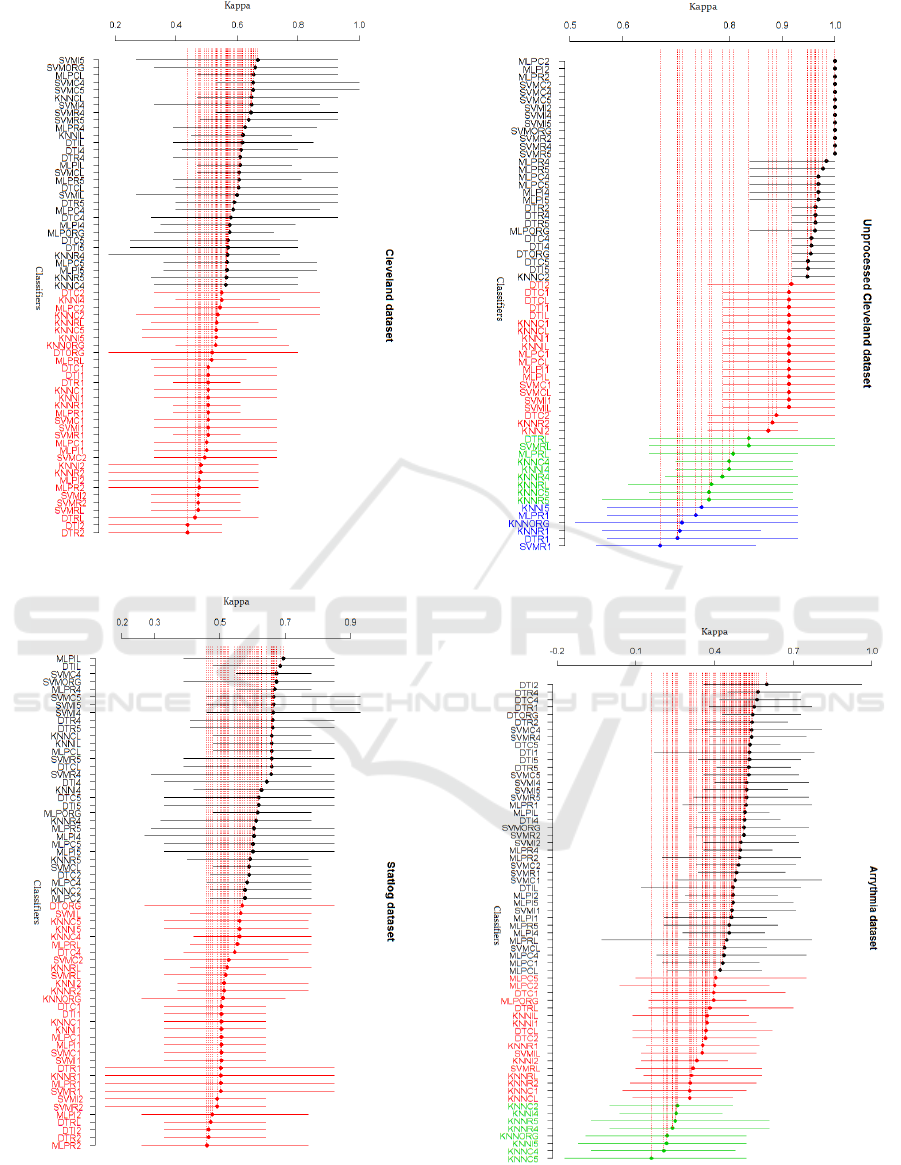
Figure 1: SK test results on processed Cleveland dataset.
Figure 2: SK test results on Statlog dataset.
Figure 3: SK test results on unprocessed Cleveland
dataset.
Figure 4: SK test results on Arrhythmia dataset.
HEALTHINF 2020 - 13th International Conference on Health Informatics
396

Table 1: Classifiers ranked at the top ten positions of Borda count.
Cleveland
Statlog
Unprocessed cleveland
Arrhythmia
Rank
Classifiers
Rank
Classifiers
Rank
Classifiers
Rank
Classifiers
1
ᵃSVMI5
1
MLPIL
1
ᵃMLPC2
1
DTI2
1
ᵃSVMC5
2
ᵃDTIL
1
ᵃMLPI2
2
ᵃDTC4
1
ᵃMLPCL
2
ᵃMLPR4
1
ᵃMLPR2
2
ᵃDTR4
1
ᵃKNNCL
3
ᵇSVMC4
1
ᵃSVMC2
3
DTR1
2
SVMORG
3
ᵇSVMORG
1
ᵃSVMC4
4
SVMC4
3
MLPR4
3
ᵇDTR4
1
ᵃSVMC5
5
ᵇSVMR4
4
SVMC4
3
ᵇDTR5
1
ᵃSVMI2
5
ᵇDTR2
5
ᵇSVMI4
3
ᵇKNNCL
1
ᵃSVMI4
6
DTORG
5
ᵇSVMR4
3
ᵇKNNIL
1
ᵃSVMI5
7
SVMC5
6
SVMR5
3
ᵇMLPCL
1
ᵃSVMORG
8
DTI1
.
(Peter & Somasundaram, 2012). For Arrhythmia
dataset, the accuracy of DTI2 outperformed the
accuracy results of DT and four other classifiers
obtained in (Sasikala, Appavu, & Geetha, 2014) with
feature extraction and hybrid feature selection.
- The results obtained for unprocessed Cleveland
considerably outperform those obtained for the
processed Cleveland dataset which shows that this
dataset contains features that can be very informative
about heart disease and thus this dataset should be
more investigated.
5 CONCLUSION
The use of univariate filter methods with different
thresholds for feature selection resulted in optimal
classification performance for one or more classifiers
over small and large heart disease datasets. The best
results obtained in this study are very competitive
with results of other methods in the literature which
used multivariate filters, hybrid or multivariate
wrapper feature selection methods on the same heart
disease datasets. The results of this study suggest that
the unprocessed Cleveland dataset might contain
highly informative features about heart disease
diagnosis.
Ongoing work aims to investigate more feature
ranking techniques to construct ensemble feature
ranking methods along with hyper-parameter tuning
for better results.
ACKNOWLEDGEMENTS
This work was conducted within the research project
MPHR/PPR1-2016-2020. The authors would like to
thank the Moroccan MESRSFC and CNRST for their
support.
REFERENCES
Almuhaideb, S., & Menai, M. E. B. (2016). Impact of
preprocessing on medical data classification.
Frontiers of Computer Science, 10(6), 1082–1102.
https://doi.org/10.1007/s11704-016-5203-5
Arlot, S., & Celisse, A. (2010). A survey of cross-validation
procedures for model selection. Statistics Surveys, 4,
40–79. https://doi.org/10.1214/09-SS054
Benhar, H., Idri, A., & Fernández-Alemán, J. L. (2019). A
Systematic Mapping Study of Data Preparation in
Heart Disease Knowledge Discovery. Journal of
Medical Systems, 43(1), 17. https://doi.org/10.1007/
s10916-018-1134-z
Bhargava, N., Sharma, G., Bhargava, R., & Mathuria, M.
(2013). Decision Tree Analysis on J48 Algorithm for
Data Mining. International Journal of Advanced
Research in Computer Science and Software
Engineering, 3(6), 1114–1119. https://doi.org/10
.23956/ijarcsse
Bolón-Canedo, V., Sánchez-Maroño, N., & Alonso-
Betanzos, A. (2013). A review of feature selection
methods on synthetic data. Knowledge and
Information Systems, 34(3), 483–519. https://doi.
org/10.1007/s10115-012-0487-8
Bolón-Canedo, V., Sánchez-Maroño, N., & Alonso-
Betanzos, A. (2015). Recent advances and emerging
challenges of feature selection in the context of big
data. Knowledge-Based Systems, 86, 33–45.
https://doi.org/10.1016/j.knosys.2015.05.014
Cover, T., & Hart, P. (1967). Nearest neighbor pattern
classification. IEEE Transactions on Information
Theory, 13(1), 21–27. https://doi.org/10.1109/
TIT.1967.1053964
Dua, D., & Graff, C. (2019). UCI Machine Learning
Repository. Retrieved from http://archive.ics.
uci.edu/ml
Ferri, C., Hernández-Orallo, J., & Modroiu, R. (2009). An
experimental comparison of performance measures
for classification. Pattern Recognition Letters, 30(1),
27–38. https://doi.org/10.1016/j.patrec.2008.08.010
Gardner, M. ., & Dorling, S. . (1998). Artificial neural
networks (the multilayer perceptron)—a review of
Impact of Threshold Values for Filter-based Univariate Feature Selection in Heart Disease Classification
397

applications in the atmospheric sciences. Atmospheric
Environment, 32(14–15), 2627–2636. https://doi.org/
10.1016/S1352-2310(97)00447-0
Gooch, J. W. (2011). Pearson Product-Moment Correlation
Coefficient. In Encyclopedia of Measurement and
Statistics. https://doi.org/
10.4135/9781412952644.n338
Guyon, I., Steve, G., Masoud, N., & Lotfi, A. Z. (2006).
Feature Extraction: Foundations and Applications (I.
Guyon, M. Nikravesh, S. Gunn, & L. A. Zadeh, Eds.).
https://doi.org/10.1007/978-3-540-35488-8
Hall, M., Frank, E., Holmes, G., Pfahringer, B., Reutemann,
P., & Witten, I. H. (2009). The WEKA data mining
software. ACM SIGKDD Explorations Newsletter.
https://doi.org/10.1145/1656274.1656278
Hosni, M., Idri, A., & Abran, A. (2017). Investigating
heterogeneous ensembles with filter feature selection for
software effort estimation. Proceedings of the 27th
International Workshop on Software Measurement and
12th International Conference on Software Process and
Product Measurement, 207–220.
https://doi.org/10.1145/3143434.3143456
Huan, L., & Lei, Y. (2005). Toward integrating feature
selection algorithms for classification and clustering.
IEEE Transactions on Knowledge and Data
Engineering, 17(4), 491–502. https://doi.org/
10.1109/TKDE.2005.66
Idri, A., Benhar, H., Fernández-Alemán, J. L., & Kadi, I.
(2018). A systematic map of medical data preprocessing
in knowledge discovery. Computer Methods and
Programs in Biomedicine, 162, 69–85.
https://doi.org/10.1016/j.cmpb.2018.05.007
Jabbar, M. A., Deekshatulu, B. L., & Chandra, P. (2013).
Heart disease classification using nearest neighbor
classifier with feature subset selection. ANNALS
.COMPUTER SCIENCE SERIES, Vol. XI fa, 47–54.
Jabbar, M. A., Deekshatulu, B. L., & Chandra, P. (2015).
Computational intelligence technique for early
diagnosis of heart disease. 2015 IEEE International
Conference on Engineering and Technology
(ICETECH), 1–6. https://doi.org/10.1109/
ICETECH.2015.7275001
Jaganathan, P., & Kuppuchamy, R. (2013). A threshold
fuzzy entropy based feature selection for medical
database classification. Computers in Biology and
Medicine, 43(12), 2222–2229. https://doi.org/10.1016/
j.compbiomed.2013.10.016
Jovic, A., Brkic, K., & Bogunovic, N. (2015). A review of
feature selection methods with applications. 2015 38th
International Convention on Information and
Communication Technology, Electronics and
Microelectronics (MIPRO), 1200–1205. https://doi.
org/10.1109/MIPRO.2015.7160458
Kadi, I., Idri, A., & Fernandez-Aleman, J. L. (2017).
Knowledge discovery in cardiology: A systematic
literature review. International Journal of Medical
Informatics, 97, 12–32. https://doi.org/10.1016/j.ijmed
inf.2016.09.005
Kenji, K., & A., R. L. (1992). The Feature Selection
Problem : Traditional Methods and a New Algorithm.
AAAI-92 Proceedings. https://doi.org/10.1016/S0031-
3203(01)00046-2
Kononenko, I., Robnik-Šikonja, M., & Pompe, U. (1996).
ReliefF for estimation and discretization of attributes in
classification, regression, and ILP problems. Artificial
Intelligence: Methodology, Systems, Applications, 31–
40. https://doi.org/DOI 10.1016/
j.chroma.2012.01.030
Mendes, D., Paredes, S., Rocha, T., Carvalho, P.,
Henriques, J., Cabiddu, R., & Morais, J. (2015).
Assessment of cardiovascular risk based on a data-
driven knowledge discovery approach. 2015 37th
Annual International Conference of the IEEE
Engineering in Medicine and Biology Society (EMBC),
6800–6803. https://doi.org/10.1109/EMBC.2015.7319
955
Mustaqeem, A., Anwar, S. M., Majid, M., & Khan, A. R.
(2017). Wrapper method for feature selection to classify
cardiac arrhythmia. Proceedings of the Annual
International Conference of the IEEE Engineering in
Medicine and Biology Society, EMBS, 3656–3659.
https://doi.org/10.1109/EMBC.2017.8037650
Peter, T. J., & Somasundaram, K. (2012). Study and
Development of Novel Feature Selection Framework
for Heart Disease Prediction. International Journal of
Scientific and Research Publications, 2(10), 1–7.
Quinlan, J. R. (1986). Induction of Decision Trees. Machine
Learning, 1(1), 81–106. https://doi.org/
10.1023/A:1022643204877
Sasikala, S., Appavu, A. B. S., & Geetha, S. (2014). RF-
SEA-Based Feature Selection for Data Classification in
Medical Domain. Intelligent Computing, Networking,
and Informatics, 243, 599–608.
https://doi.org/10.1007/978-81-322-1665-0_59
Scott, A. J., & Knott, M. (1974). A Cluster Analysis Method
for Grouping Means in the Analysis of Variance.
Biometrics. https://doi.org/10.2307/2529204
Seijo-Pardo, B., Porto-Díaz, I., Bolón-Canedo, V., &
Alonso-Betanzos, A. (2017). Ensemble feature
selection: Homogeneous and heterogeneous approaches.
Knowledge-Based Systems, 118, 124–139.
https://doi.org/10.1016/j.knosys.2016.11.017
Shouman, M., Turner, T., & Stocker, R. (2012). Using data
mining techniques in heart disease diagnosis and
treatment. 2012 Japan-Egypt Conference on
Electronics, Communications and Computers, 173–177.
https://doi.org/10.1109/JEC-ECC.2012.6186978
Ting, S. L., Shum, C. C., Kwok, S. K., Tsang, A. H. C., &
Lee, W. B. (2009). Data Mining in Biomedicine:
Current Applications and Further Directions for
Research. Journal of Software Engineering and
Applications, 02(03), 150–159. https://doi.org/10.
4236/jsea.2009.23022
Vapnik, V. N. (2000). The Nature of Statistical Learning
Theory. https://doi.org/10.1007/978-1-4757-3264-1
Vivekanandan, T., & Sriman, N. I. N. C. (2017). Optimal
feature selection using a modified differential evolution
algorithm and its effectiveness for prediction of heart
disease. Computers in Biology and Medicine, 90, 125–
136. https://doi.org/10.1016/j.compbiomed.2017.09.011
HEALTHINF 2020 - 13th International Conference on Health Informatics
398
