
Dual Single Pixel Imaging in SWIR using Compressed Sensing
Martin Oja
1
, Sebastian Olsson
1
, Carl Br
¨
annlund
2 a
, Andreas Brorsson
2 b
, David Bergstr
¨
om
2 c
and
David Gustafsson
2 d
1
Link
¨
oping University, Link
¨
oping, Sweden
2
FOI - Swedish Defence Research Agency, C4ISR , Link
¨
oping, Sweden
Keywords:
Compressive Sensing, Single Pixel Imaging, Complementary Sampling, SWIR, Total Variation.
Abstract:
In this paper, we present a dual Single Pixel Camera (SPC) operating in the Short Wave InfraRed (SWIR)
spectral range that reconstructs high resolution images from an ensemble of compressed measurements. The
SWIR spectrum provides significant benefits in many applications due to its night vision capabilities and
its ability to penetrate smoke and fog. Walsh-Hadamard matrices are used for generating pseudo-random
measurements which speed up the reconstruction and enable reconstruction of high resolution images. Total
variation regularization is used for finding a sparse solution in the gradient space. The detectors have been
fitted with analog filters and amplification in order to capture scenes in low light. A number of outdoor scenes
with varying illumination have been collected using the dual single pixel sensor. Visual inspection of the
reconstructed SWIR images indicate that most scenes and objects can be identified with a lower subsampling
ratio (SR) compared to a single detector setup. The image quality is consistently better than with one detector,
with similar results achieved with fewer samples or better results with the same number of samples. We also
present measurements on moving objects in the scene and movements in the SPC unit and compare the results
between single and dual detectors.
1 INTRODUCTION
Conventional focal plane array cameras capture the
scene by measuring the light incident at each of the
thousands of pixels instantly. In Compressed or Com-
pressive Sensing (CS) a relatively small number of
measurements with a Single Pixel Camera (SPC) us-
ing a single detector and a Spatial Light Modulator
(SLM), which changes pattern for each measurement,
are combined with a sparse reconstruction procedure
to recover a high resolution image. CS or when deal-
ing with images, Compressive Imaging (CI) exploits
the fact that natural images are compressible or sparse
in some basis and therefore only a few measurements
relative to the image resolution are needed to recon-
struct the image. M measurements are sampled to re-
construct an image with N pixels, where M N, far
fewer samples than required by the NyquistShannon
sampling theorem. Two constraints must be fulfilled
in order to utilize CS sampling: the image needs to
a
https://orcid.org/0000-0002-4047-2083
b
https://orcid.org/0000-0002-3922-9334
c
https://orcid.org/0000-0003-2414-4482
d
https://orcid.org/0000-0002-4370-2286
be compressible and the measurement matrix needs
to be incoherent with the sparse transform. The first
constraint is fulfilled because natural images are com-
pressible using for example JPEG or JPEG2000 (us-
ing wavelet transform) and the second constraint is
fulfilled using a measurement matrix with a random
characteristic. Although the light from the scene is
modulated by far fewer patterns on the SLM than the
image resolution, capturing a high quality image with
a SPC can be a time-consuming task. When recon-
structing an image, the CS-algorithms assumes the
scene to be stationary, so a SPC is sensitive to any
type of scene variations. Decreasing this sensitivity
as well as increasing the image quality and frame rate
are important goals for the development of SPCs.
The interest in SPCs is motivated by applica-
tions where sensors are very costly, such as imag-
ing in the Short-Wave Infrared (SWIR) spectrum. In
many applications the SWIR spectrum provides sig-
nificant benefits over the visual spectrum. For ex-
ample SWIR enables separation between camouflage
and vegetation, and penetrates to some extention fog
and smoke which enables imaging through scattering
media. Furthermore, SWIR sensors can be used for
48
Oja, M., Olsson, S., Brännlund, C., Brorsson, A., Bergström, D. and Gustafsson, D.
Dual Single Pixel Imaging in SWIR using Compressed Sensing.
DOI: 10.5220/0008947000480056
In Proceedings of the 15th International Joint Conference on Computer Vision, Imaging and Computer Graphics Theory and Applications (VISIGRAPP 2020) - Volume 4: VISAPP, pages
48-56
ISBN: 978-989-758-402-2; ISSN: 2184-4321
Copyright
c
2022 by SCITEPRESS – Science and Technology Publications, Lda. All rights reserved

passive imaging in the dark due to the night-glow of
the sky.
The twin, double or dual SPC (DSPC) presented
in this paper combines a Digital Micromirror Device
(DMD), two nearly identical InGaAs photodiodes, an
analog amplifier with a band-pass filter and an Ana-
log to Digital Converter (ADC). The second detector
measures the complementary patterns which are the
”dark” mirrors of the patterns not visible from the first
detector. Because the two detectors measures all the
light reflected off the DMD, they can produce higher
quality images, or the same quality at a lower SR,
thus increasing the frame rate. Using an extra detec-
tor also reduces sensitivity to scene and light varia-
tions, weather, turbulence and movement in the SPC
unit. The amplifier unit improves low light perfor-
mance and the band-pass filter blocks the DC-level
and high frequency noise. The two outputs are sam-
pled by the ADC and can in the software be combined
to a single signal, to be restored to one high quality
image or two lower quality images (one for each de-
tector). In this paper the main goal is to investigate the
difference between using one and two detectors. The
system is evaluated and the increase in image qual-
ity and Signal-to-Noise Ratio (SNR) is measured with
one and two detectors. Results from static and mov-
ing outdoor natural scenes with different lighting con-
dition and SR are presented, as well as a measurement
with small movements in the SPC-system (the system
is shaken by hand).
In 2014 (Yu et al., 2014) presented a similar setup
with two photomultiplier tubes and investigated the
potential for increase in performance for the first time.
A system with two detectors using a balanced ampli-
fier was presented for the first time in 2016 (Soldevila
et al., 2016). This increases the frame rate and SNR,
as well as improving performance in the presence of
ambient light. The balanced detection also reduces
electrical and quantization errors. Other examples of
systems with two detectors have been described in pa-
pers such as (Czajkowski et al., 2018), which uses
measurement matrices based on Morlet wavelets con-
volved with white noise to reduce the signal acquisi-
tion time, and (Lochocki et al., 2016), which evaluates
the performance and demonstrates increased frame
rate. A system with two different spectral band de-
tectors (visual + SWIR) has also been demonstrated
by (Welsh, 2017). A SPC with multiple detectors
(RGB and SWIR) in the same DMD reflection direc-
tion was presented by (Edgar et al., 2015). SPCs in
the SWIR band have been presented earlier and an
example of a high resolution SPC with one detector
is presented by (McMackin et al., 2012). The same
measurements and DSPC design used in this paper
are also described in a thesis (Oja and Olsson, 2019).
A paper by (Br
¨
annlund and Gustafsson, 2017), shows
the initial results and proof of concept of the SWIR
SPC architecture with one detector. The same design
is improved in a thesis by Brorsson (Brorsson, 2018),
which is also described in the paper (Brorsson et al.,
2019).
2 COMPRESSIVE SENSING
2.1 Sparse Reconstruction
CS is a sampling strategy for acquiring and recon-
structing a sparse signal, such as an image, by finding
solutions to underdetermined linear systems where
the number of measurements can be far fewer than
required by the Nyquist-Shannon sampling theorem.
Two constraints needs to be fulfilled to apply CS sam-
pling: the sampled image needs to be sparse in some
basis, and the measurement matrix must be incoherent
with the sparse transform. In CS the sampling model
is defined as
y =Φx +ε, (1)
where x
N×1
is the scene considered as an image
rearranged as an array with N pixels, y
M×1
is the sam-
pled signal with M measurements, Φ
M×N
is the mea-
surements matrix and ε is the noise. The subsampling
ratio is defined as SR = M/N, and this number can
be relatively small compared to how compressible the
image is. This is because the image x can be repre-
sented as
Ψθ = x, (2)
where Ψ
N×N
is some basis matrix and θ
N×1
is
the coefficients where θ is K-sparse. K-sparse means
that the image x has K non-zero elements in basis Ψ,
||θ||
0
= K. Given (2), (1) can be expanded to
y = Φx + ε =ΦΨθ + ε = Aθ + ε, (3)
where, A
M×N
= ΦΨ is called the reconstruction
matrix. The revelation in (3) is what makes CS pow-
erful. By sampling the scene using the measurement
matrix Φ (as in (1)), but then in the reconstruction
process transforming the measurement matrix Φ to
the reconstruction matrix A using some basis Ψ, the
optimization algorithm can solve the system for the
sparse coefficients θ instead of the dense spatial im-
age coefficients in x (Rish and Grabarnik, 2014).
Dual Single Pixel Imaging in SWIR using Compressed Sensing
49
2.2 Total Variation Regularization
The total variation (TV) based TVAL3 (Total Vari-
ation Augmented Lagrangian Alternating Direction
Algorithm) is used for image reconstruction. Natu-
ral images often contain sharp edges and piecewise
smooth areas which the TV regularization algorithm
is good at preserving. The main difference between
TV and other reconstruction algorithms is that TV
considers the gradient of signal to be sparse instead
of the signal itself, thus finding the sparsest gradient.
The TV optimization problem in TVAL3 is defined as
min
x
Σ
i
||D
i
x||, subject to Φx = y, x ≥ 0, (4)
where D
i
x is the discrete gradient of x at position i.
TVAL3 is an optimization method for solving con-
strained problems by substituting the original con-
strained problem with a series of unconstrained sub-
problems and introducing a penalty term. To solve the
new sub-problems the alternating direction method is
used (Li, 2010).
2.3 Permutated Sequence Ordered
Walsh-Hadamard Matrix
In addition to eliminating the need to store the large
measurement matrix in computer memory for recon-
struction, the Permutated Sequence Ordered Walsh-
Hadamard matrix (PSOWHM) can be generated when
sent to the DMD and thus eliminating the need to
store the matrix. PSOWHM has approximately the
same characteristics and properties as an independent
and identically distributed (i.i.d.) random matrix but
generally has a higher number of measurements for
exact reconstruction of the image. Research has how-
ever shown that there is no significant loss in recov-
ery of the image relative to the i.i.d. random matri-
ces (Zhuoran et al., 2013).
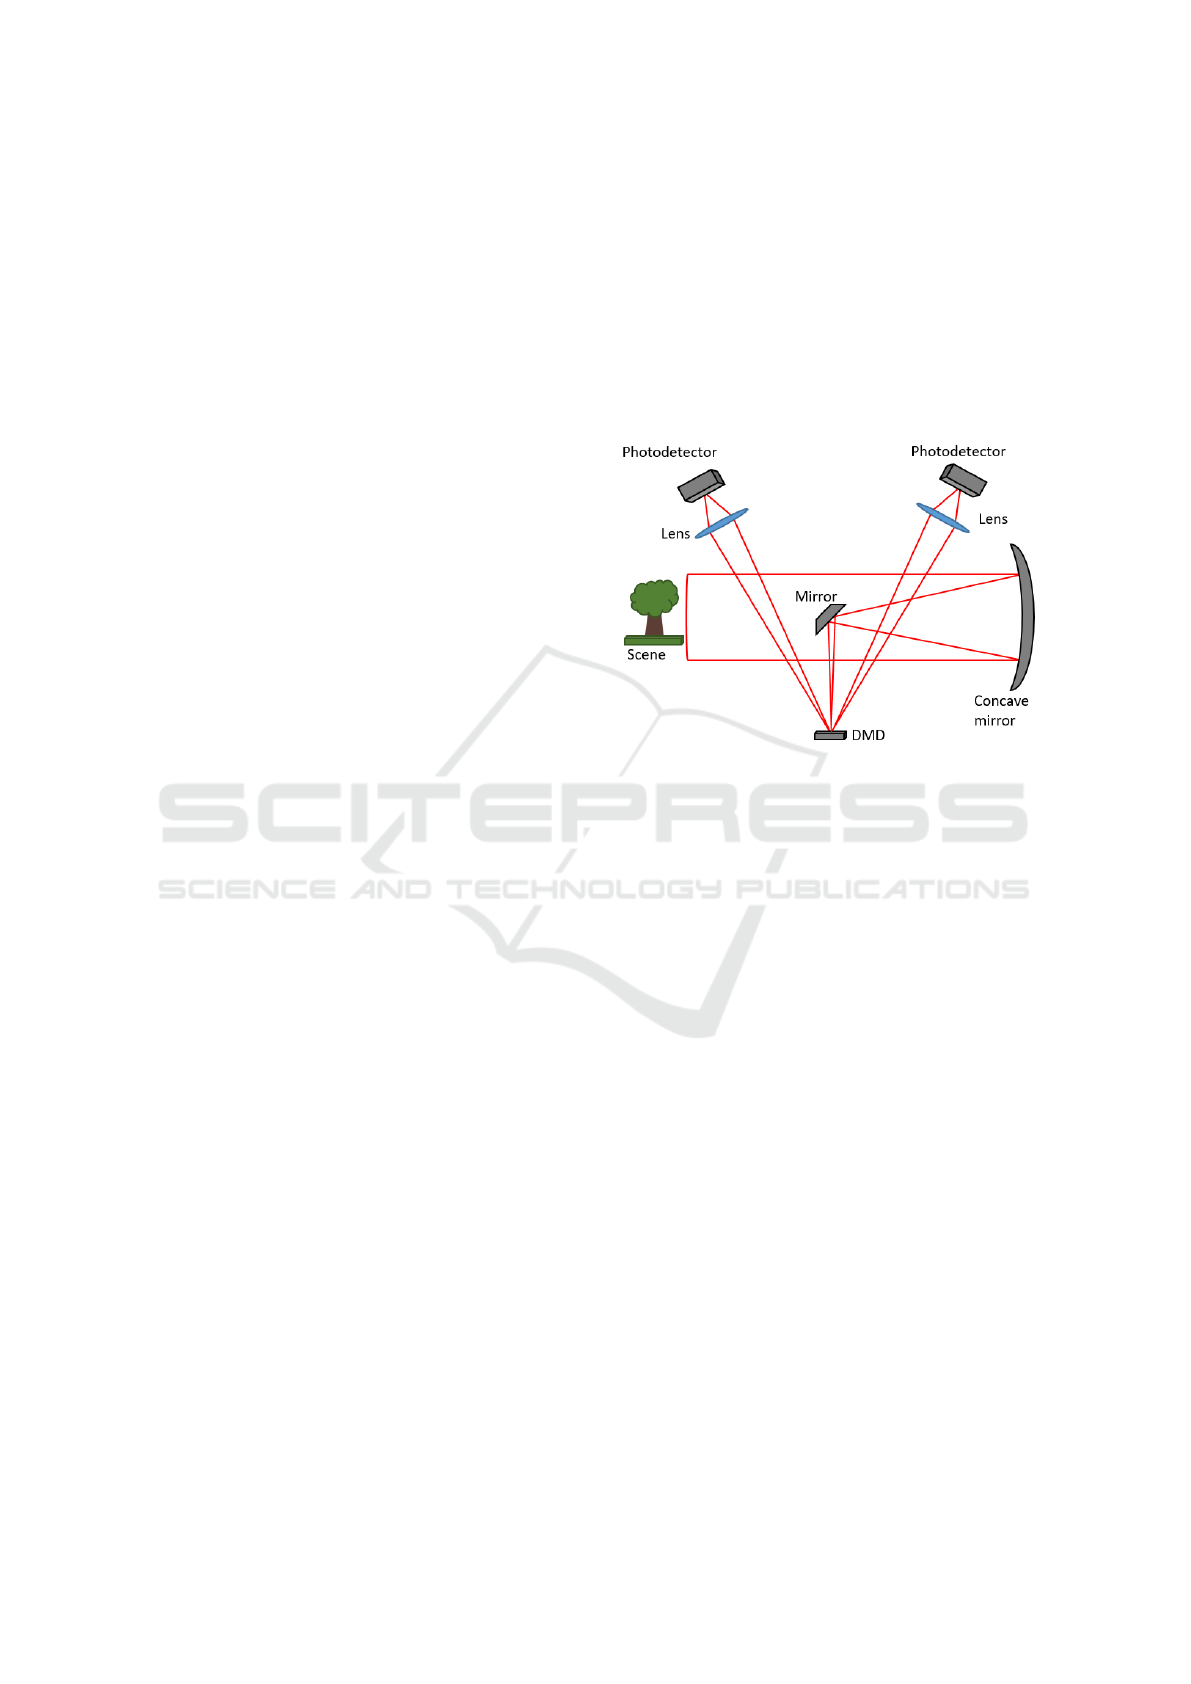
3 DUAL SINGLE PIXEL CAMERA
ARCHITECTURE
The DSPC platform consists of a DMD
(DLP4500NIR, 912 × 1140, 700 − 2500 nm),
two identical large area InGaAs-detectors with built-
in amplifiers (PDA20C/M, 800 − 1700 nm) and an
aluminium Newtonian telescope, which consists of a
concave primary mirror (108 mm, F4.1), and a flat
secondary mirror. This design has a maximum field
of view of 22 × 14 µrad, which gives highly detailed
scenes from a great distance. The motivation to use
a reflective optical system is partly that chromatic
aberration is eliminated and partly that it works over
a wide wavelength band. A visual spectrum reference
camera is mounted viewing the DMD via a mirror
in front of one of the detectors to simplify setup and
focusing of the system. This mirror is removed when
capturing images with the SPC. The lenses in front of
the detectors have a diameter of 50.8 mm and a focal
length of 32 mm (ACL50832U).
Figure 1: Illustration of the designed Dual Single Pixel
Camera (DSPC).
The pseudo-random patterns are generated in
C++ when streamed via HDMI as 24-bit images
from a Windows computer to the control unit (DLP
LightCrafterTM 4500). This unit is setup to split
the received 24-bit image into 1-bit planes which
are displayed in consecutive order. The control unit
can be operated at a maximum speed of 2880 Hz
(24-bit@120 Hz), but for synchronization reasons
with the 60 Hz computer display only 1440 Hz was
achieved (24-bit@60 Hz). At this rate a 512 × 512
measurement with a subsampling ratio of 10% is
streamed in 17 seconds. Walsh-Hadamard matrices
up to 512 × 512 (PSOWHM) are used for generating
pseudo-random patterns. An open source total
variation regularization algorithm (TVAL3) is used
for finding a sparse solution in the gradient space.
The amplifier unit is designed with a band pass
filter (100-13000 Hz) to remove the DC level as
well as high and low frequency noise, coming from,
for example, the electrical grid. The prototype was
designed using potentiometers to be able to easily
change the cut off frequency and gain. The two out-
puts from the amplifier are then greatly oversampled
with an ADC (PicoScope 2406B).
VISAPP 2020 - 15th International Conference on Computer Vision Theory and Applications
50
3.1 Signal Processing
In our experiments the two detector signals are
combined using the formula
y = y
A
− y
B
(5)
where y
A
and y
B
are the signals from the two identical
detectors. The reconstructed image using the com-
bined signal y will result in an image with a higher
quality, as well as reduced sensitivity to dynamic
scene variations, than y
A
or y
B
on their own. It is
noteworthy that this formula cancels out global light
changes during the measurements, and that the sum
of the two detector signals is constant, independent of
the pattern on the DMD, y
A
+ y
B
≈ const. The mean
value of y
A
and y
B
is zero because we filter out the
DC-part of the signal, which also leads to y
A
+y
B
≈ 0.
Since the amplitude of the signals from the detec-
tors varies depending on the light intensity, the gain
needs to be set to match the ADC reference voltage.
In bright sunlight there is little need for amplification
since the amplitude is high enough to be measured
with good resolution by the ADC, whereas in darker
conditions a higher gain is needed. An example of a
low light level signal from one detector with and with-
out amplification sampled by the ADC, can be seen in
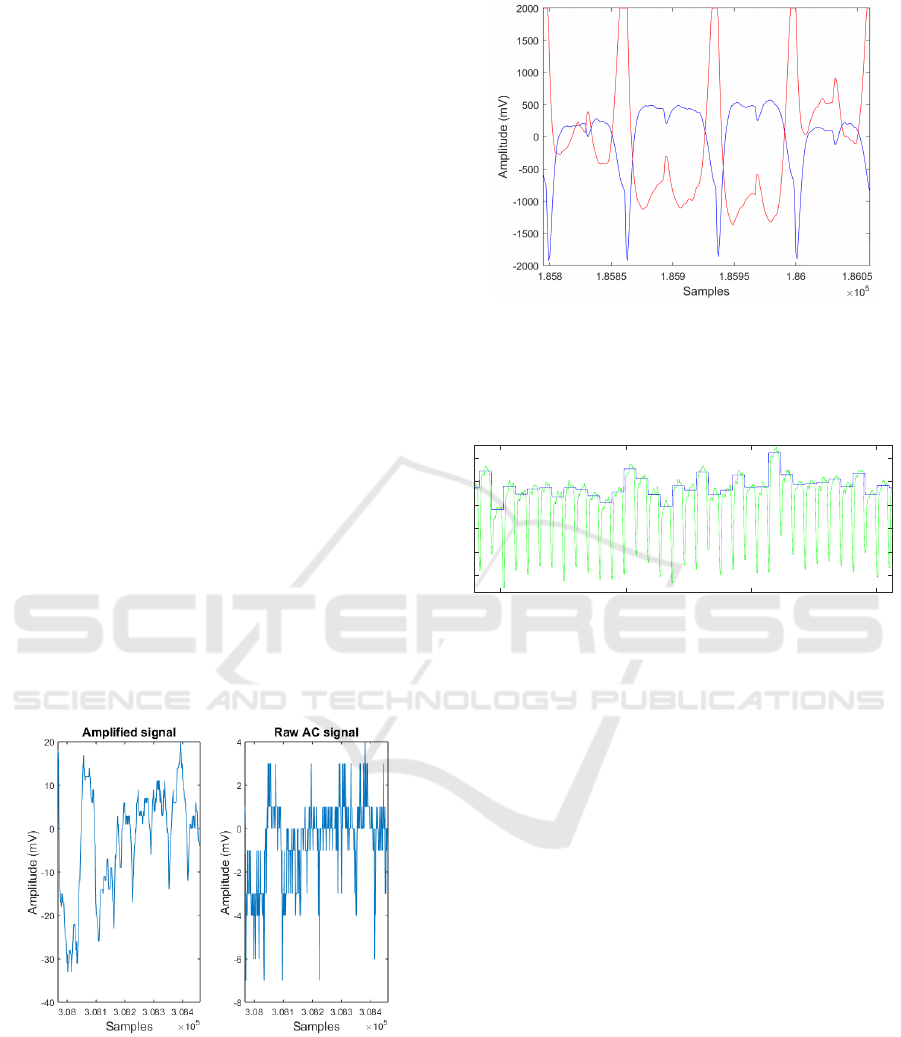
Figure 2. An example of the signals from the two de-
tectors sampled by the ADC can be seen in Figure 3.
Figure 2: An example of an amplified (left) and unamplified
(right) signal sampled by the ADC. Because of the band-
pass (100-13000 Hz) filter the signals are centered at zero.
The reference voltage is set to ± 250 mV.
The two output signals from the amplifier unit are
greatly oversampled by the ADC, such that a sin-
gle value corresponding to each pattern on the DMD
could be obtained, as seen in Figure 4. This is per-
formed in two steps; first we omit samples when the
Figure 3: An example of the signals from the two detectors
sampled by the ADC. Because of the band-pass (100-13000
Hz) filter the signals are centered at zero. Large positive and
negative spikes occur when the patterns is changed on the
DMD. A smaller spike is also visible in the middle of the
pattern.
3.332 3.3325 3.333 3.3335
sample
10
6
0.12
0.13
0.14
0.15
0.16
0.17
y
Figure 4: Signal measured using one detector (green) and
the mean values (blue) for each DMD pattern. The mean
values are calculated by omitting samples near the pattern
transition (seen as negative spikes).
DMD is changing pattern (a short negative or posi-
tive spike in the signal dependent on which detector is
measured), then the mean is calculated for each pat-
tern. An array with one value per pattern y[m], is fi-
nally created.
4 EXPERIMENTS
To compare the performance of a SPC with one and
two identical detectors multiple tests were conducted
on both stationary and moving targets, as well as
when small movements on the SPC system were
induced by hand. In all the presented experiments
the light level was quite high so the amplifier made
little difference to the image quality. The number
of active micromirrors in the measurements was
always 512 × 512 (the mirrors are binned together at
lower resolutions) independent of image resolution,
which means that the field of view is always the
same. Images of the same data were for a double
detector system restored using y = y
A
− y
B
, or when
considered as a single detector system y = y
A
as input
Dual Single Pixel Imaging in SWIR using Compressed Sensing
51
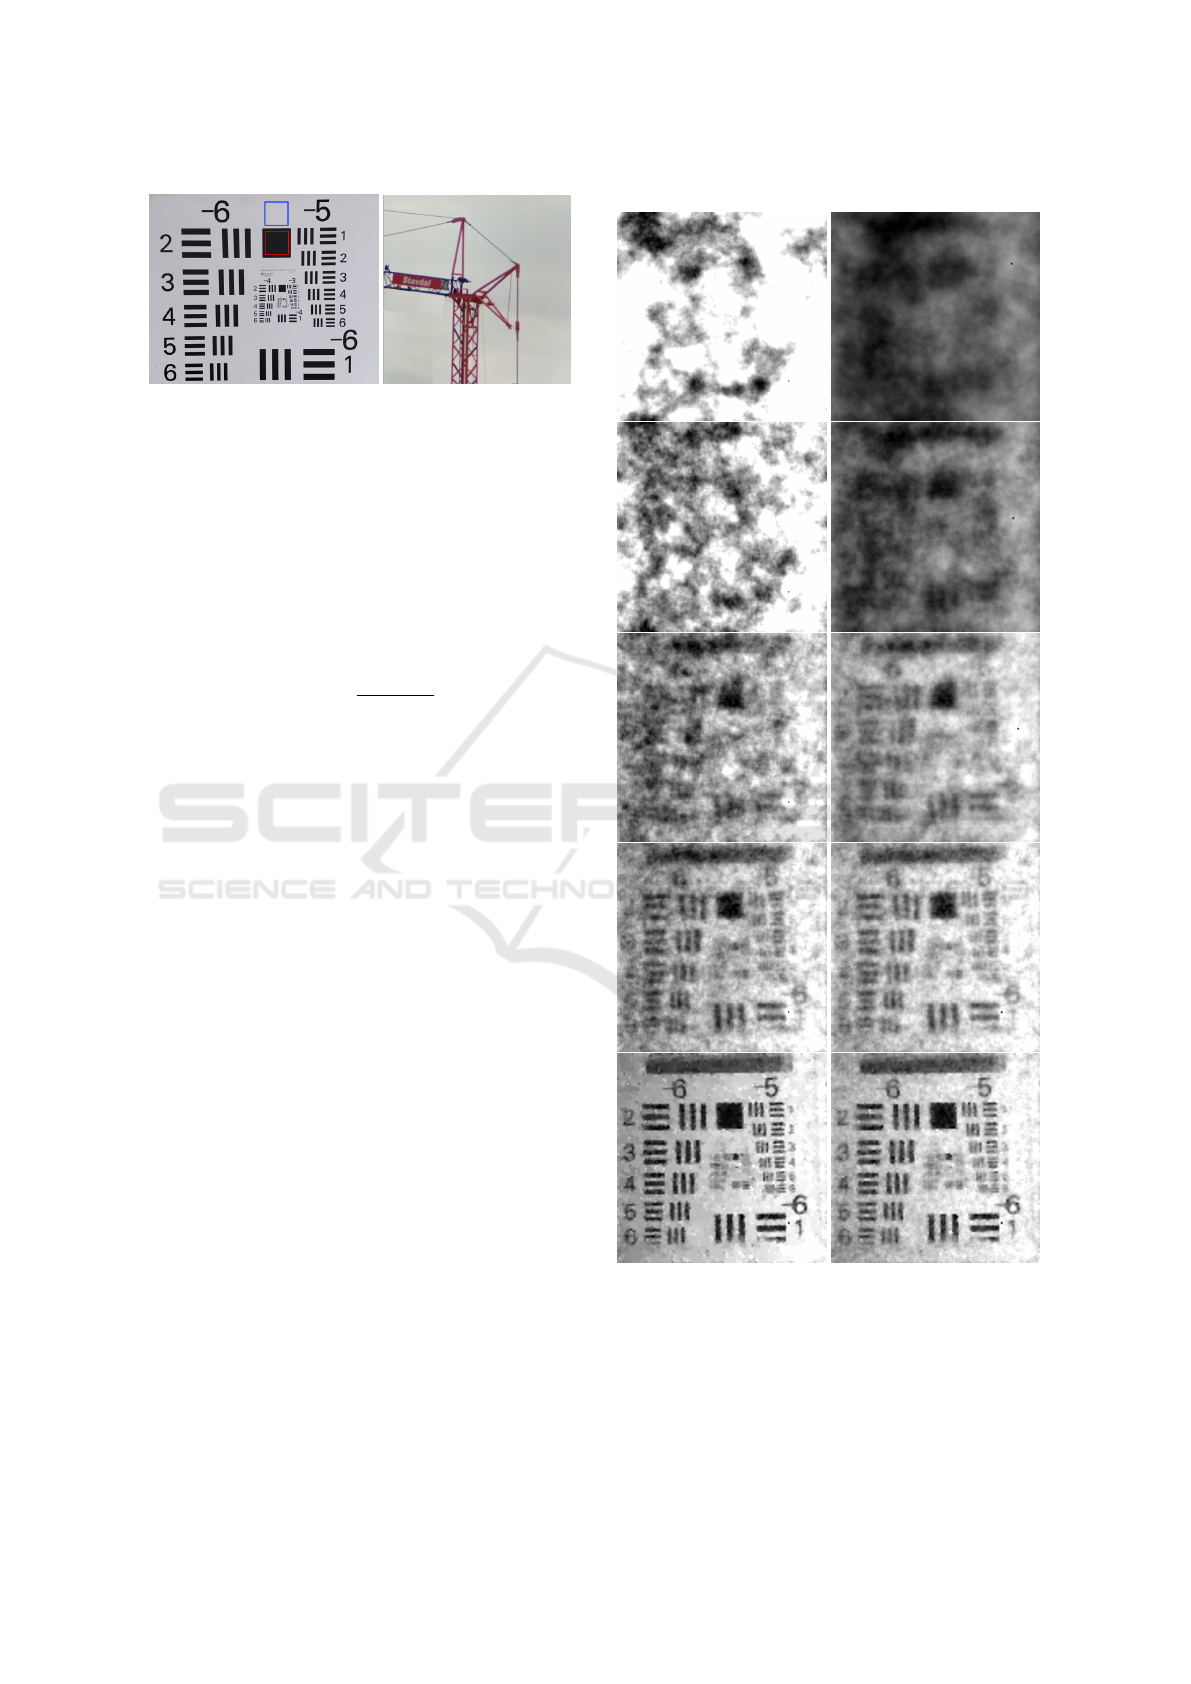
Figure 5: Left: The resolution board used in the experi-
ments, the blue and red boxes represent the white and black
uniform areas used for SNR calculations. Right: The con-
struction crane used in some of the experiments.
to TVAL3. Restored images using y
A
or y
B
produced
almost identical results in the experiments.
In order to measure the image quality, a series of
tests at varying resolutions were conducted on a reso-
lution board, outdoors at a distance of 90 m. The SNR
for an image was then determined with
SNR = 2
µ
1
− µ
2
(σ
1
+ σ
2
)
(6)
where the mean value µ
1
and standard deviation, σ
1
corresponds to a white area, and µ
2
and σ
2
corre-
sponds to a black area. The resolution board can be
seen in Figure 5 where the white and black areas are
marked. The difference between the two areas can be
considered to be the signal strength.
5 RESULTS
In this section a selection of reconstructed images and
SNR data, from stationary scenes, as well as dynamic
measurements are presented. The reconstructed im-
ages of a stationary resolution board, placed outdoors
at a relatively short range (90 m), can be seen in Fig-
ures 6, 7 and 8 at the resolutions 128×128, 256 ×256
and 512 × 512. The SNR for the same scene is pre-
sented in Figures 9, 10 and 11, where these graphs
does not directly correlate to the presented images,
because the images are reconstructed from one single
measurement while the SNR has been calculated as
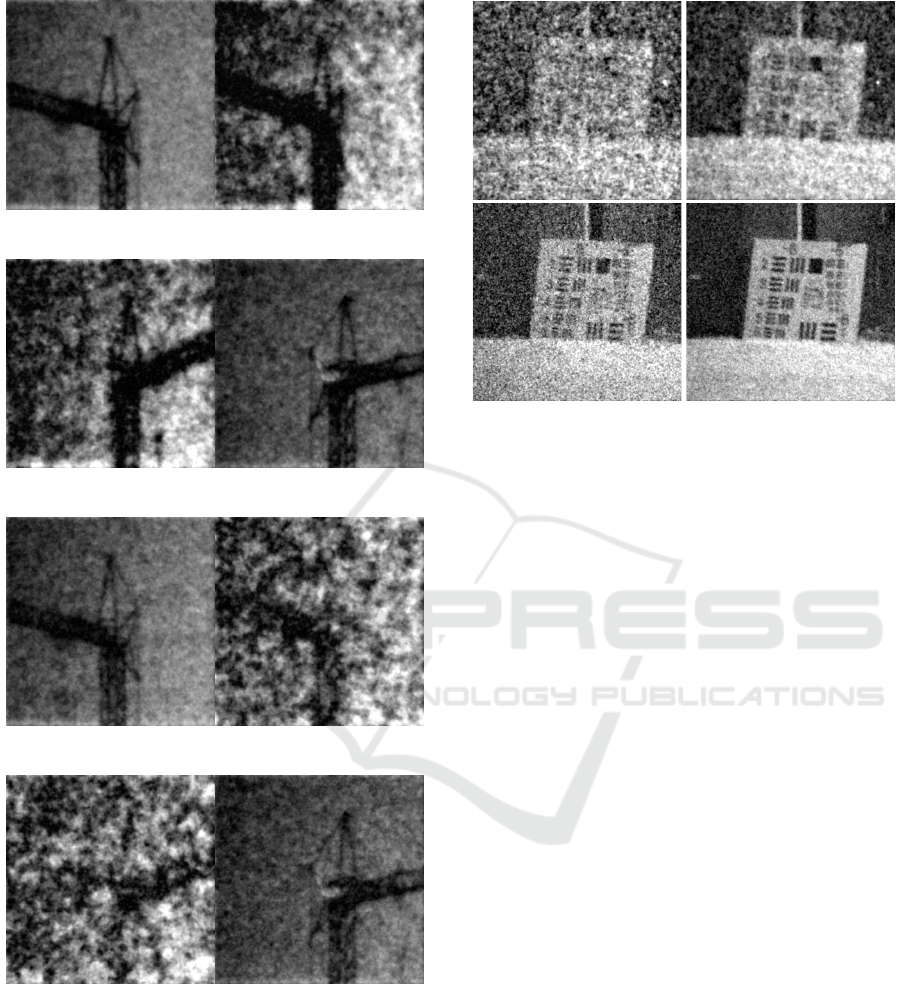
mean values from multiple measurements. In Figure
12 images at 256×256, with varying SR of a station-
ary construction crane at a distance of around 1000
m, can be seen. As can be seen the image quality is
clearly higher for all SR. Figure 13 shows images at
512 × 512 with 1% SR, of the same crane when sta-
tionary and rotating. The crane was stationary in the
beginning and end of the measurement, which can be
seen in Figures a, d, e and h. In the middle of the mea-
surement the crane was rotating which can be seen in
Resolution 128 × 128
Figure 6: Reconstructed images at 128×128 of a resolution
board at 90 m. Images are reconstructed using signals from
one (left) and two (right) detectors. The SR from top to
bottom is 1%, 3%, 7%, 17% and 35%. As can be seen the
largest image quality difference is at low SR.
Figures b, c, f and g. Results of another measurement
are presented in Figure 14, where small movements
VISAPP 2020 - 15th International Conference on Computer Vision Theory and Applications
52
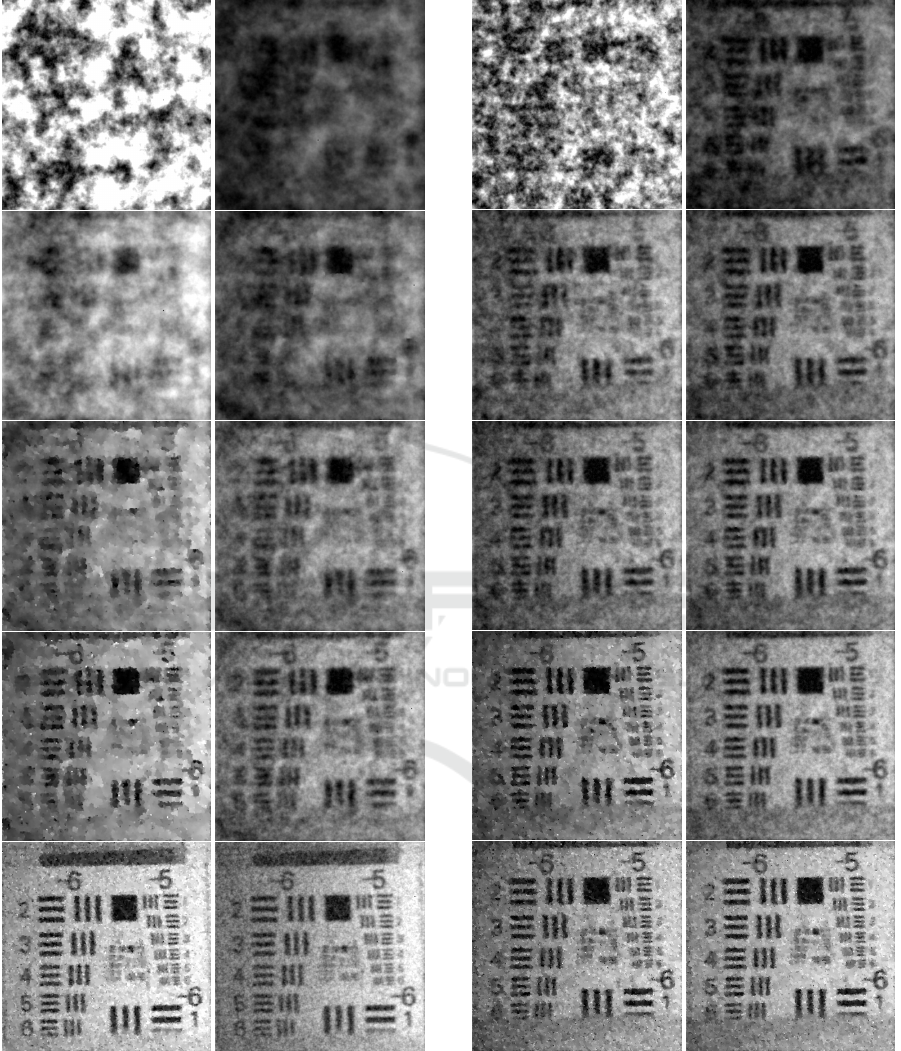
Resolution 256 × 256
Figure 7: Reconstructed images at 256×256 of a resolution
board at 90 m. Images are reconstructed using signals from
one (left) and two (right) detectors. The SR from top to
bottom is 1%, 2%, 4%, 7% and 30%. As can be seen the
largest image quality difference is at low SR.
Resolution 512 × 512
Figure 8: Reconstructed images at 512×512 of a resolution
board at 90 m. Images are reconstructed using signals from
one (left) and two (right) detectors. The SR from top to
bottom is 1%, 2%, 3% and 10%. As can be seen the largest
image quality difference is at low SR.
in the SPC system during the measurement were in-
duced by hand.
Dual Single Pixel Imaging in SWIR using Compressed Sensing
53
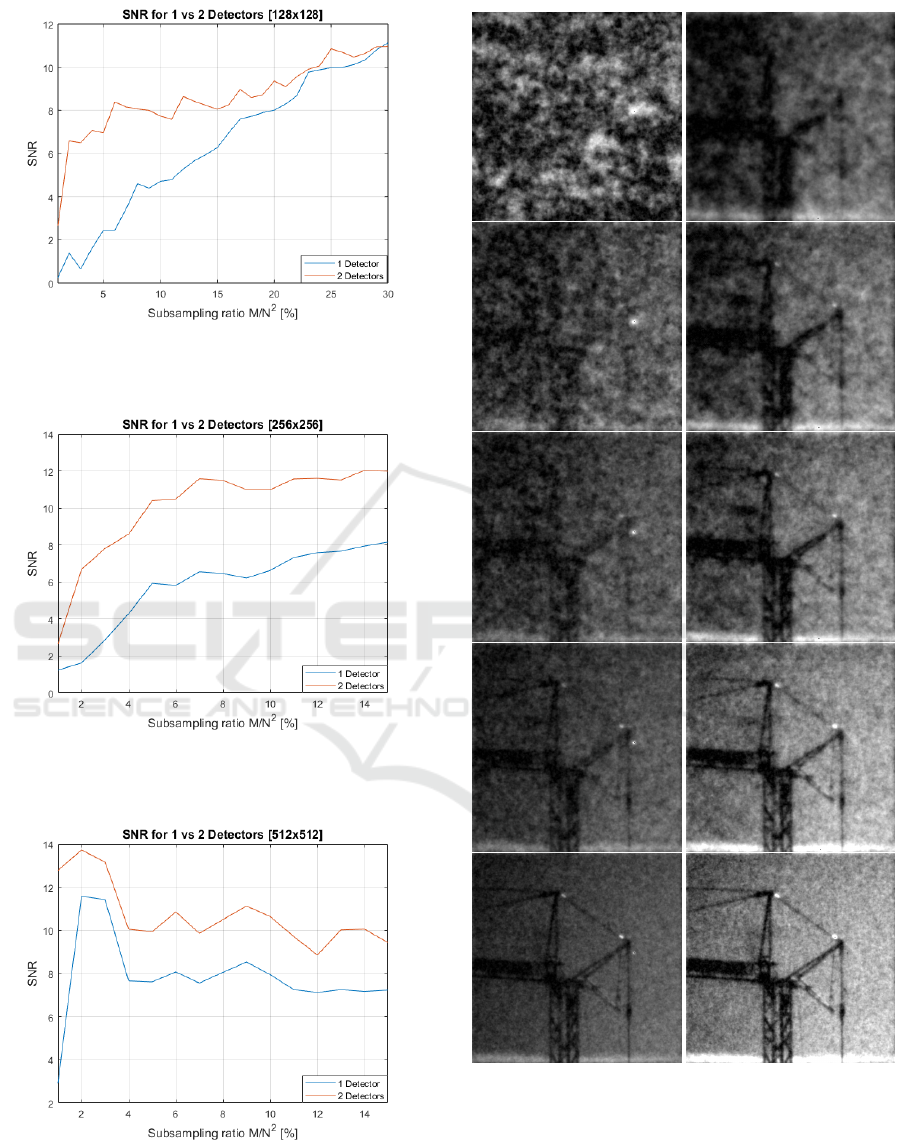
Figure 9: SNR for a resolution of 128 × 128. Multiple mea-
surements are performed and the SNR is calculated as a
mean value.
Figure 10: SNR for a resolution of 256 × 256. Multiple
measurements are performed and the SNR is calculated as
a mean value.
Figure 11: SNR for a resolution of 512 × 512. Multiple
measurements are performed and the SNR is calculated as
a mean value.
Figure 12: Reconstructed images at 256 × 256 of a station-
ary construction crane at different SR using one (left) and
two detectors (right). The SR from top to bottom is 2%,
4%, 6%, 10% and 20%. As can be seen the largest quality
difference is at low SR. It is also noteworthy that the image
is brighter using two detectors.
VISAPP 2020 - 15th International Conference on Computer Vision Theory and Applications
54
(a) Start, 2 detectors (b) Movement, 2 detectors
(c) Movement, 2 detectors (d) End, 2 detectors
(e) Start, 1 detector (f) Movement, 1 detector
(g) Movement, 1 detector (h) End, 1 detector
Figure 13: Reconstructed images at 512×512 and SR = 1%
of a stationary and rotating construction crane. The subfig-
ures (a) to (d) are captured with two detectors and (e) to (f)
with one detector. Start is just before the movement started
and End is after the movement stopped. The image qual-
ity of the moving crane is improved significantly with two
detectors.
Figure 14: Reconstructed images at 512 ×512 of the resolu-
tion board placed against a wall at 126 m, with one (left) and
two detectors (right). Vibrations/movements are induced by
hand in the SPC system during the measurement. The SR
from top to bottom is 5% and 20%. As can be seen the qual-
ity is significantly higher using two detectors for all SR.
6 CONCLUSIONS
What we consistently can see from the experiments
is that an extra detector will always produce higher
quality images with less noise, especially at low SR,
where the image quality is significantly improved. By
adding a second detector, the frame rate can be sig-
nificantly improved if a low quality, usable image is
acceptable. Our tests also show that a second detector
makes a significant difference when capturing scenes
with dynamics (light variations, movements in scene,
movements of the SPC, etc.). Figure 13 is an example
of this, when the moving crane is reconstructed using
only 1% SR, and the differences between one and two
detectors are very clear. The improvement in image
quality is also clear in Figure 14 where small move-
ments were induced in the SPC system. What should
also be noted is that the calculated SNR is not an exact
measure of image quality, where other factors such as
edge response and sharpness are also important. This
is obvious when comparing Figures 8 and 11 where
the quality of the images is improved with increas-
ing SR, while the measured SNR decreases when SR
increases. The addition of an analog band-pass fil-
ter and especially the amplification enabled the SPC
to produce images in poor weather conditions where
the signal is weak. However, in good weather with
a strong raw signal the filtering and amplification did
little to improve the signal other than ensuring the sig-
Dual Single Pixel Imaging in SWIR using Compressed Sensing
55

nal is close to the reference voltage of the ADC.
REFERENCES
Br
¨
annlund, C. and Gustafsson, D. (2017). Single pixel swir
imaging using compressed sensing. In Swedish Sym-
posium on Image Analysis (SSBA). Swedish Sympo-
sium on Image Analysis (SSBA).
Brorsson, A. (2018). Compressive sensing: Single pixel
swir imaging of natural scenes. Master’s thesis,
Link
¨
opings Universitet (LiTH-ISY-EX–18/5108–SE).
Brorsson, A., Br
¨
annlund, C., Bergstr
¨
om, D., and Gustafs-
son, D. (2019). Compressed imaging at long range in
swir. In Scandinavia Conference on Image Analysis
(SCIA). Springer International Publishing.
Czajkowski, K. M., Pastuszczak, A., and Koty
´
nski, R.
(2018). Single-pixel imaging with morlet wavelet cor-
related random patterns. Scientific Reports, 8(466).
Edgar, M. P., Gibson, G. M., Bowman, R. W., Sun, B., Rad-
well, N., Mitchell, K. J., Welsh, S. S., and Padgett,
M. J. (2015). Simultaneous real-time visible and in-
frared video with single-pixel detectors. Scientific Re-
ports, 5.
Li, C. (2010). An efficient algorithm for total variation regu-
larization with applications to the single pixel camera
and compressive sensing. Master’s thesis, Rice Uni-
versity.
Lochocki, B., Gamb
´
ın-Regadera, A., and Artal, P. (2016).
Performance evaluation of a two detector camera for
real-time video. Applied optics, 55(36):10198–10203.
McMackin, L., Herman, M. A., Chatterjee, B., and Wel-
don, M. (2012). A high-resolution swir camera via
compressed sensing. In Infrared Technology and Ap-
plications XXXVIII, volume 8353, pages 48 – 57. In-
ternational Society for Optics and Photonics, SPIE.
Oja, M. and Olsson, S. (2019). Stand-alone dual sens-
ing single pixel camera in swir. Master’s thesis,
Link
¨
opings Universitet (LiU-ITN-TEK-A–19/024–
SE).
Rish, I. and Grabarnik, G. (2014). Sparse Modeling:
Theory, Algorithms, and Applications. Chapman &
Hall/CRC Machine Learning & Pattern Recognition.
CRC Press, 1st edition.
Soldevila, F., Clemente, P., Tajahuerce, E., Uribe-Patarroyo,
N., Andrs, P., and Lancis, J. (2016). Computational
imaging with a balanced detector. Scientific Reports,
6.
Welsh, S. S. (2017). Applications of single-pixel imaging.
PhD thesis, University of Glasgow.
Yu, W.-K., Liu, X.-F., Yao, X.-R., Wang, C., Zhai, Y.,
and Zhai, G.-J. (2014). Complementary compressive
imaging for the telescopic system. Scientific Reports,
4(5834).
Zhuoran, C., Honglin, Z., Min, J., Gang, W., and Jingshi, S.
(2013). An improved hadamard measurement matrix
based on walsh code for compressive sensing. In 2013
9th International Conference on Information, Com-
munications & Signal Processing, pages 1–4.
VISAPP 2020 - 15th International Conference on Computer Vision Theory and Applications
56
