
Towards Collaborative and Dynamic Software Visualization in VR
Florian Jung
1
, Veronika Dashuber
2
and Michael Philippsen
1
1
Programming Systems Group, Friedrich-Alexander University Erlangen-N
¨
urnberg (FAU), Martensstr. 3, Germany
2
QAware GmbH, Aschauer Str. 32, Munich, Germany
Keywords:
Software Visualization, Virtual Reality, Collaboration, Software Engineering, Trace Data.
Abstract:
To improve comprehension and maintenance of distributed software systems, some software visualization
tools already bundle relevant information in a graphical way, but they either focus on the static structures and
dependencies, or on tracing information. Our novel visual representation lifts the software city metaphor into
VR and jointly addresses both static and dynamic behavioral aspects, such as call traces of microservice based
systems. Users can navigate both the traces in the time domain and the static structure in the spatial domain.
They can also collaborate with other developers. We argue that our 3D visualization provides the engineer
with a better grasp on relevant information. With a controlled experiment we evaluated its user acceptance.
1 INTRODUCTION
Because of the longevity of complex software sys-
tems and a high fluctuation rate in teams, there is a
need for an effective on-boarding of new developers
so that they quickly and correctly understand the code
and become productive. Industry often uses coaches
to train newbies, either 1:1 or in groups. Coaches
use tools like Jaeger (jaegertracing.io), Grafana Dash-
boards (grafana.com), etc. to illustrate structures, fea-
tures, metrics, etc. of the system at hand.
Two threats limit the effectiveness of training-
based approaches. (1) With many tools, each of which
visualizing a certain aspect of the system, users eas-
ily get confused and often have to switch between
tools. As this is error-prone and impacts productiv-
ity there is a need for tools that aggregate views. One
of the challenges is to display all the dimensions of
the information at once while keeping the result di-
gestible. While 3D visualizations can exploit an extra
axis, there are other issues such as occlusion of rele-
vant background objects by less relevant foreground
objects, etc.
We address (1) by exploiting recent advances in
VR technology. We immerse the user into a vir-
tual world whose artifacts represent characteristics of
the software system. We tackle the resulting prob-
lems: (a) When—due to the headset—developers can
no longer interact in the real world, there need to
be means for collaboration in the virtual world (e.g.,
to share information and to explore the software to-
gether) and (b) users need to navigate in the virtual
world. While the latter is well-understood in gaming
scenarios, there is also the issue of time, which we
discuss below.
Threat (2) is that current visualizations mainly fo-
cus on the static aspects of software. But microservice
based architectures rely on interactions between pro-
gram parts that are often set up dynamically and dis-
patched via frameworks like Spring (spring.io). These
remain hidden in static visualizations.
We address (2) by visualizing traces, i.e., the dy-
namic behavior of requests through the distributed
system. Users hence also need to navigate within the
time domain.
2 RELATED WORK
First we summarize the state of the art in static 3D
software visualization. We then briefly discuss work
on the visualization of dynamic aspects.
To display abstract information such as soft-
ware dependency graphs one needs a suitable vi-
sual representation, also called metaphor (Teyseyre
and Campo, 2009). Examples are the tree metaphor
(Reiss, 1995), the nested box metaphor (Rekimoto
and Green, 1993), and the city metaphor that mod-
els classes as buildings in a virtual city and represents
the package structure as districts of the city (Panas
et al., 2003; Wettel and Lanza, 2007). This is best
for our visualization as it offers both an intuitive and
Jung, F., Dashuber, V. and Philippsen, M.
Towards Collaborative and Dynamic Software Visualization in VR.
DOI: 10.5220/0008945201490156
In Proceedings of the 15th International Joint Conference on Computer Vision, Imaging and Computer Graphics Theory and Applications (VISIGRAPP 2020) - Volume 3: IVAPP, pages
149-156
ISBN: 978-989-758-402-2; ISSN: 2184-4321
Copyright
c
2022 by SCITEPRESS – Science and Technology Publications, Lda. All r ights reserved
149

familiar environment and allows to display additional
information such as call traces. The box metaphor
is unsuitable due to its many visual occlusions. The
tree metaphor causes too much visual noise as all the
contains-relationships lead to too many branches.
With the city metaphor in a VR environment, there
is also the need to navigate in the VR. To the best of
our knowledge, there is no work yet that allows the
user to walk around in a virtual software city. Ex-
plorViz (Fittkau et al., 2013) uses hand gestures for
moving the city while the user remains stationary (Fit-
tkau et al., 2015). Instead, we focus on actual locomo-
tion through the city.
Recent research covers locomotion in VR (Bolet-
sis, 2017). “Flying”, i.e., moving the user’s position
according to a joystick can cause nausea (Langbehn
et al., 2018; LaViola, 2000) and has a lower user ac-
ceptance than teleportation. Here the user points at a
target with the controller and presses a button to trig-
gers the teleport action (Bozgeyikli et al., 2016; Lang-
behn et al., 2018). Natural walking is the best way to
navigate in VR (Nabiyouni et al., 2015) although it
is constrained by the available physical space. Redi-
rected walking still requires more space than is avail-
able in most office environments (Langbehn et al.,
2017). Natural walking requires modern room-scale-
tracking headsets such as the Oculus Rift S or the
HTC Vive family. We thus selected both the telepor-
tation approach for long distance travel and natural
walking for a more precise positioning when analyz-
ing a small-scale structure.
In iViz (Donalek et al., 2014) a user can share
a view on high-dimensional data with others. In
SourceVis (Anslow et al., 2013) software engineers
collaborate using large tablets. Users are in the
same room and enrich their verbal communication
with non-verbal cues, e.g., pointing gestures. Analo-
gously, our VR must also provide visual communica-
tion cues. We use avatars to represent users’ positions
and orientations (Jackson and Fagan, 2000; Carlsson
and Hagsand, 1993). In the past the limited field
of view of the HMDs has caused misunderstandings
between collaborating users when they wrongly as-
sume that their partners can see objects (Fraser et al.,
2000). With the improvements of current VR head-
sets, displaying the avatar with its perceptible orienta-
tion should convey enough information. For efficient
collaboration, however, more visual cues are needed
(Cherubini et al., 2010; Clark, 2003), which fortu-
nately can easily be mapped into our VR.
Current microservice architectures employ many
services that are connected by networking frame-
works. Processes cross service boundaries and
their interaction is set up and dispatched dynami-
cally. Tracing tools instrument the system so that
all services report incoming calls on their inter-
faces/endpoints to a central collector. Responding to
a request usually takes a sequence of calls to vari-
ous endpoints, called a trace. It holds the dependen-
cies between endpoints and the durations of individ-
ual endpoint calls, so-called spans.
Trace visualization is a rather new research area.
ExplorViz (Fittkau et al., 2013) represents call rela-
tions between classes as streets. Users can play back
traces by highlighting the respective streets. There is
visual clutter because (a) streets overlap and (b) there
is a visual entity for each software entity listed in a
call trace, even for those missing in the static data
(Fittkau et al., 2017). Traces thus include frameworks
outside the scope of the visualized software system.
Ciolkowski et al. (2017) address these shortcomings
and use moving objects on the streets to indicate call
directions. ThreadCity (Hahn et al., 2015) displays
multiple threads of execution in 2D, with one lane per
thread. Our trace visualization reduces visual clutter
by only showing the relevant endpoints. We aggregate
intermediate call targets that lie outside of the soft-
ware system of interest (e.g., communication frame-
works), see Sec. 5. Exploiting the third dimension,
we display such calls as arcs above classes, making
them easy to see and reducing occlusion problems.
In our trace visualization users can travel through
the time frames of the traces. Since walking through a
time portal (Herbst et al., 2008) is not well-suited for
continuous time navigation, we use the controller’s
circular scroll pad for time navigation.
3 SOFTWARE CITY IN VR
We use the Godot 3 game engine (godotengine.org)
and Valve’s SteamVR (steamvr.com) to interface with
VR headsets, e.g., the HTC Vive Pro, and to reveal the
boundaries of the physical space to the user.
In our software city (Fig. 1) we map static struc-
tural elements such as packages or classes to dis-
tricts or buildings. This preserves the hierarchi-
cal “contains”-relationship as districts can have sub-
districts or buildings (cuboids). Buildings may have
courtyards that contain smaller buildings to model in-
ner classes. They have varying width, height, or color
to map additional attributes of the underlying class.
We use the width and height for depicting the number
of methods of a class. The manually assigned color
encodes the package to which a class belongs.
A static analysis gathers the calls between classes
and uses them as the attraction force between build-
ings in a force-directed layout (Schreiber et al., 2019).
IVAPP 2020 - 11th International Conference on Information Visualization Theory and Applications
150

Figure 1: Software city with an avatar pointing at a building.
Foreground: green buildings/classes of package A. Back-
ground: gray buildings/houses of package B. Lower left:
class with an inner class in a courtyard.
4 COLLABORATION
While two users, e.g., a coach and a newbie, can view
the same computer screen and discuss their findings
directly, this is impossible in a VR environment that
blocks all external visual influences. Hence, there
must be a way to interact in the VR.
As users independently navigate in the software
city and do not know what their collaborators can see,
there may be misunderstandings when they discuss
an artifact in the city, further aggravated by different
zoom factors they can have on the city. To select be-
tween precise-and-slow movement and rapid move-
ment through a model-landscape-sized software city,
we offer a zoom feature that allows the user to “grow”
or “shrink” at will. As this changes the view point of
a user it must be conveyed to other participants.
To show a collaborator’s position, gaze direction,
zoom factor, etc., we display an avatar in all other
headsets (Fig. 1). This avatar also lets the users in-
teract by pointing to entities in the software city with
a virtual laser pointer triggered with a button on the
VR controller. The avatar visibly points to the same
entity in all other users’ views, regardless of their cur-
rent zoom factors. Thus, it not only serves the purpose
of pointing at entities, but also provides the user with
familiar cues about their colleagues’ perspectives.
5 DYNAMIC TRACES
To visualize tracing information in 3D, results from
the 2D approaches are only of limited use because
both the static and the dynamic properties need to
be represented in a combined view. Thus, a mapping
scheme is needed that blends the tracing data with the
static software structure. Two issues arise from that,
namely (a) the occurrence of software entities in the
traces that do not belong to the software system itself,
but to libraries and frameworks used, and (b) a way
must be found to display the time component of the
traces. We present solutions to both issues below.
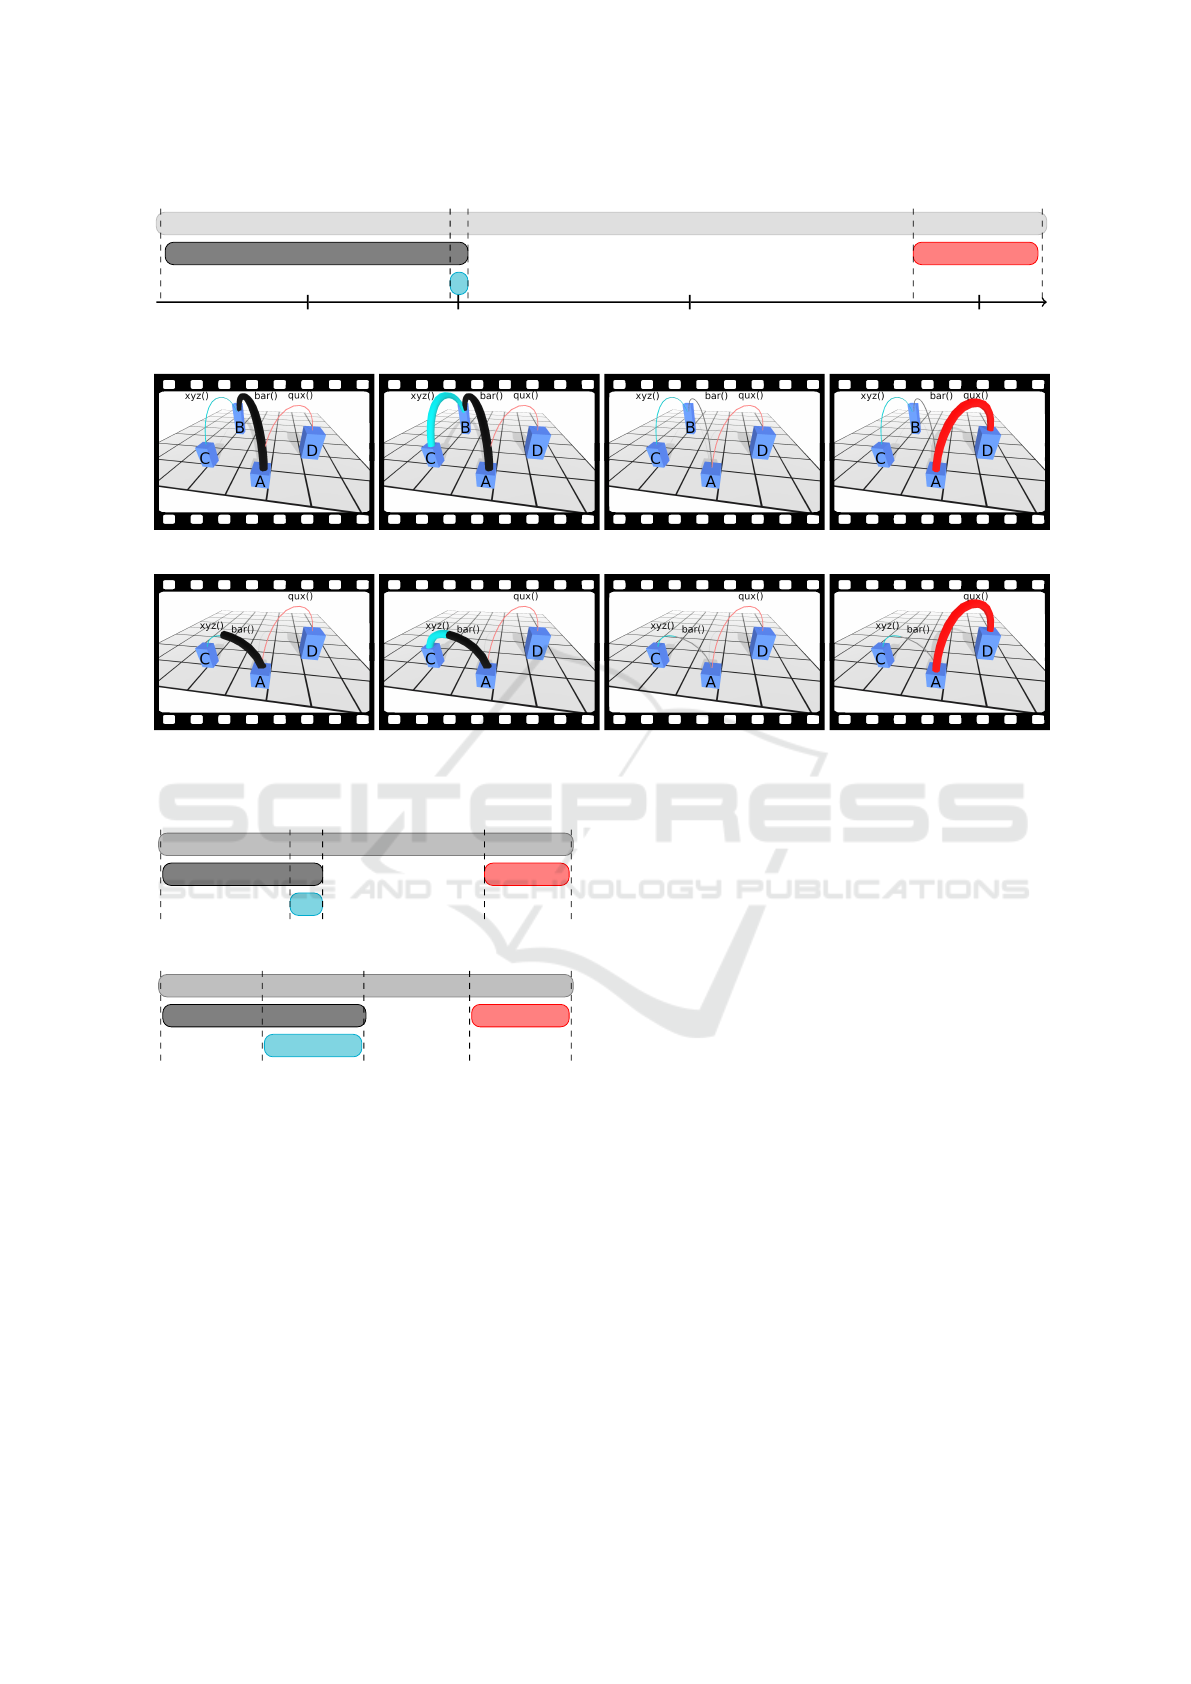
Trace Visualization by Means of Arcs. 2D trace vi-
sualizations like Zipkin (zipkin.io) or Jaeger use the
x-axis for progress of time (Fig. 2(a)) and focus on
revealing the hierarchical relationship of the spans.
Calls between parts of the software look like calls
to out-of-scope layers, e.g., communication frame-
works. Instead, we assign spans to buildings: An arc
from A’s building to B’s house indicates a call from
A::foo to B::bar. Fig. 2(b) shows four simplified
3D snapshots taken at the same times T
i
as the 2D
view. While 2D visualizers leave it to the user to re-
late the traces to metrics in other tools (e.g., LoC), we
jointly display the static structure and the traces, e.g.,
by mapping a LoC count to the height of a building.
Time. Since representing the static software struc-
ture uses all three spatial axes, we use the time axis
to represent time. As calls happen in the software,
arcs appear and disappear while users are watching
the dynamic behavior. The duration of the visibility
of an arc corresponds to the duration of the respec-
tive call. As C::xyz in Fig. 2(a) is a rather short-
running method starting at T
2
, users see the corre-
sponding bold arc in the snapshot at T
2
in Fig. 2(b)
only for a short while before it disappears again. For
a better overview, there are thin hints of arcs for future
or past calls. At time T
2
both the arcs of B::bar and
C::xyz are bold as the former calls the latter.
A user can also jump to arbitrary time points in the
trace using the circular scroll pad on the controller.
Time is shared and affects all users.
Time Modulation. If we used the real time to show
spans with (dis)appearing arcs, short calls are easy to
miss. This also holds for 2D, see C::xyz in Fig. 2(a).
Conversely, A::foo is long and uneventful. We thus
provide a seamless time modulation that scales from
the real ratios (used in Fig. 2, α = 0) to an artificial
timing in which all events (dashed lines) are equally
spaced. This emphasizes short spans and makes long
spans less prominent (Fig. 3).
For 0 ≤ α ≤ 1 we modulate the span durations as
follows: We sort all the starting and ending times of
the spans such that t
0
< t
1
< ... < t
n
and derive the list
of the durations d
0
:= t
1
−t
0
,...,d
n−1
:= t
n
−t
n−1
.
We then resize these durations according to α to be-
come
ˆ
d
i
:= (1 − α)
d
i
. This yields the modulated span
durations
¯
d
i
:=
ˆ
d
i
/
∑
n−1
i=1
ˆ
d
i
with their artificial time
stamps
¯
t
i
:=
∑
i
j=0
¯
d
j
.
Reducing Clutter with Segmented Spans. Some
spans use methods that belong to external frameworks
and are thus less interesting, overwhelming the users
Towards Collaborative and Dynamic Software Visualization in VR
151
A::foo
B::bar
C::xyz
D::qux
t
0
t
1
t
2
t
3
t
4
time
T
0
T
1
T
2
T
3
(a) Traditional 2D representation. The lengths of the spans correspond to the duration of calls (α = 0).
T
0
T
1
T
2
T
3
(b) Our 3D representation. 4 snapshots at times T
i
. Simplified: no avatar, no method windows, no packages.
T
0
T
1
T
2
T
3
(c) Our 3D representation, if B is an intermediate framework.
Figure 2: Representations of a simple trace.
A::foo
B::bar
C::xyz
D::qux
t
0
t
1
t
2
t
3
t
4
(a) Time modulation factor α = 0.5.
A::foo
B::bar
C::xyz
D::qux
t
0
t
1
t
2
t
3
t
4
(b) Time modulation factor α = 1.
Figure 3: Time modulated 2D view of the trace in Fig. 2(a).
with too much detail in current 2D visualizations. For
the example, if class B belongs to an external frame-
work, it is hard to see in Fig. 2(a) that the framework
B only routes the call between A::foo and C::xyz.
Fig. 2(c) shows how we use this idea to reduce
the visual clutter: (a) We eliminate the building for B.
The VR space is less populated and better to grasp.
(b) A direct segmented arc from A to C at T
2
replaces
the “detour” of the two arcs to B and back in Fig. 2(b,
T
2
) into irrelevant areas outside of the system under
analysis. The direct arc reduces clutter. Its colored
segments retain the information that a framework is
involved. (c) We leave out calls that only go to the
framework without going back to the system. There
is no such call in the example.
To implement this reduction of visual clutter, we
first flag all external framework nodes in the trace’s
call tree. As flagged nodes that are leaves of the
call graph cannot be mapped to buildings (as exter-
nal classes are not shown), we thus purge them (and
their calls) from the trace. Second, we work on the
remaining edges. An inner flagged node has n out-
going and one incoming calls. We remove it and re-
place each of the n pairs of in-/outgoing calls with
a direct edge. The original calls (arc segments) as
its attributes. We repeat this until no flagged node is
left. Note that chains of flagged edges turn into direct
edges with multiple segments, see Fig. 2(c, T
2
).
In the example, the inner node B::bar is flagged
because B belongs to the external framework. Hence
its incoming call from A is fused with its outgoing
call to the unflagged leaf C::xyz. Afterwards B::bar
is purged from the trace, leaving a direct arc from
A::foo to C::xyz with two segments.
6 EVALUATION
In order to answer the research question “How can
VR provide an improvement in software visualiza-
IVAPP 2020 - 11th International Conference on Information Visualization Theory and Applications
152

tion”, we evaluated our approach in a controlled ex-
periment. We chose a scenario, in which a coach
explains the static architecture of a productive real-
world software system SmartPen plus three exem-
plary call traces to a newbie in an 1:1 session.
SmartPen
1
is the backend of an app that rec-
ognizes a user’s handwritten text, translates it into
ASCII, identifies the intention of the text (e.g., cre-
ation of a to-do list), and sends it to an external app
(e.g., a task app) that best matches the user’s inten-
tion. Its static structure is composed of seven mi-
croservices (User Management, Device Gateway, De-
vice Management, State Service, Push Notifications,
Common Recognition Interface, and Writing History)
whose details are irrelevant here. SmartPen uses hys-
trix as its load-balancer.
For the study we use dynamic trace data of the
following three use cases: registering a new device,
creating a new service token for a user, and processing
of a complete user interaction, including saving it.
6.1 Participants
Before the experiment, all our 13 participants (11 ♂,
2 ♀, avg. age = 27.6, stdev. = 5.5; 5 PhD students,
6 master and 2 bachelor students, all in computer
science with a background in software engineering)
were asked to sign a form of consent (including a pre-
experiment questionnaire) and were informed about
anonymization and confidentiality. 7 participants had
known issues with acrophobia (2), travel sickness (4),
or dyschromatopsia (2); multiple answers. All par-
ticipants had normal or corrected-to-normal (8) eye
sight. Most had “some” VR experience (3 “none”,
9 “some”, 1 “lots”). While all had developed soft-
ware as semester tasks or as their hobbies, they had
less professional experience (2 “none”, 7 “some”,
4 “lots”). 10 felt focused while 3 felt less-than-
average focused before we began the experiment.
All participants knew the setup and goals of the
study. They knew that after the coaching session
there would be questions about their comprehension
of SmartPen and about our visualization’s features.
6.2 Experiment
We randomly assigned each of the 13 participants to
either the VR group (8) or the control group (5). Each
participant was introduced to the experiment individ-
ually in a room with an obstacle-free VR area of about
1
The project, class and package names in SmartPen have
been renamed (preserving semantics) in order to comply
with non-disclosure agreements. Project size: ca. 100 soft-
ware engineers, ca. 117k lines of code.
2 × 2 m. All participants, regardless of their group,
received a short introduction (recap on distributed ar-
chitectures, call traces, and how they are visualized in
traditional tools and in our tool). As all but one partic-
ipants of the control group also wanted to use the VR
system, we explained to all of them how to navigate
in our VR. They had 5 minutes to get familiar with
the VR controls for navigating and pointing.
Each of the VR-participants was then led into the
lab (similar VR setup, but about 4 × 3.5 m). They
were told to again set up the VR headset to their lik-
ings. For 15 minutes, the remote expert/coach then
explained the architecture of the SmartPen software
system and the traces. We used a telephone confer-
encing setup for the audio transmission and our tool’s
collaboration features for the visual channel.
Each of the control-participants was also led into
the lab, but had to sit in front of a computer screen.
The same remote expert then explained SmartPen in
15 minutes, this time using an audio/video confer-
encing tool, sharing with the participant a screen of
Jaeger. Upon request by the participant, the coach ad-
justed the visible screen section accordingly.
With all the participants, the remote expert strictly
followed a written script that dictated what to say.
The scripts for both groups were identical, with mi-
nor variations in the wording (e.g., “trace span” vs.
“arc” for the control/VR group). When asked some-
thing, the coach was only allowed to re-read parts of
the script, but not to reformulate an explanation.
Right after the experiment, back in the real
world or away from the computer screen, there were
three post-experiment questionnaires. Comprehen-
sion questionnaire I (Fig. 4) checked whether the par-
ticipant could reproduce the information received ear-
lier. Acceptance questionnaire II (Fig. 5) asked for the
participant’s subjective assessment of whether they
could follow the explanations, felt bored, etc. As all
but one of the 5 participants of the control group later
also tried out the VR variant, following the exact same
procedure described above, a total of 8 + 4 = 12 have
answered the final feature questionnaire III (Fig. 6)
regarding the usefulness of various features of the vir-
tual and dynamic software city visualization.
There were no reports of any symptoms of nausea,
VR sickness, etc. after the experiment.
6.3 Results and Discussion
Questionnaire I. Due to organizational issues we
failed to present Q.I to the first 4 participants and thus
have a reduced sample size of 5+4 for the VR+control
group. Although this does not allow significant con-
clusions, we do not observe any indication that our
Towards Collaborative and Dynamic Software Visualization in VR
153
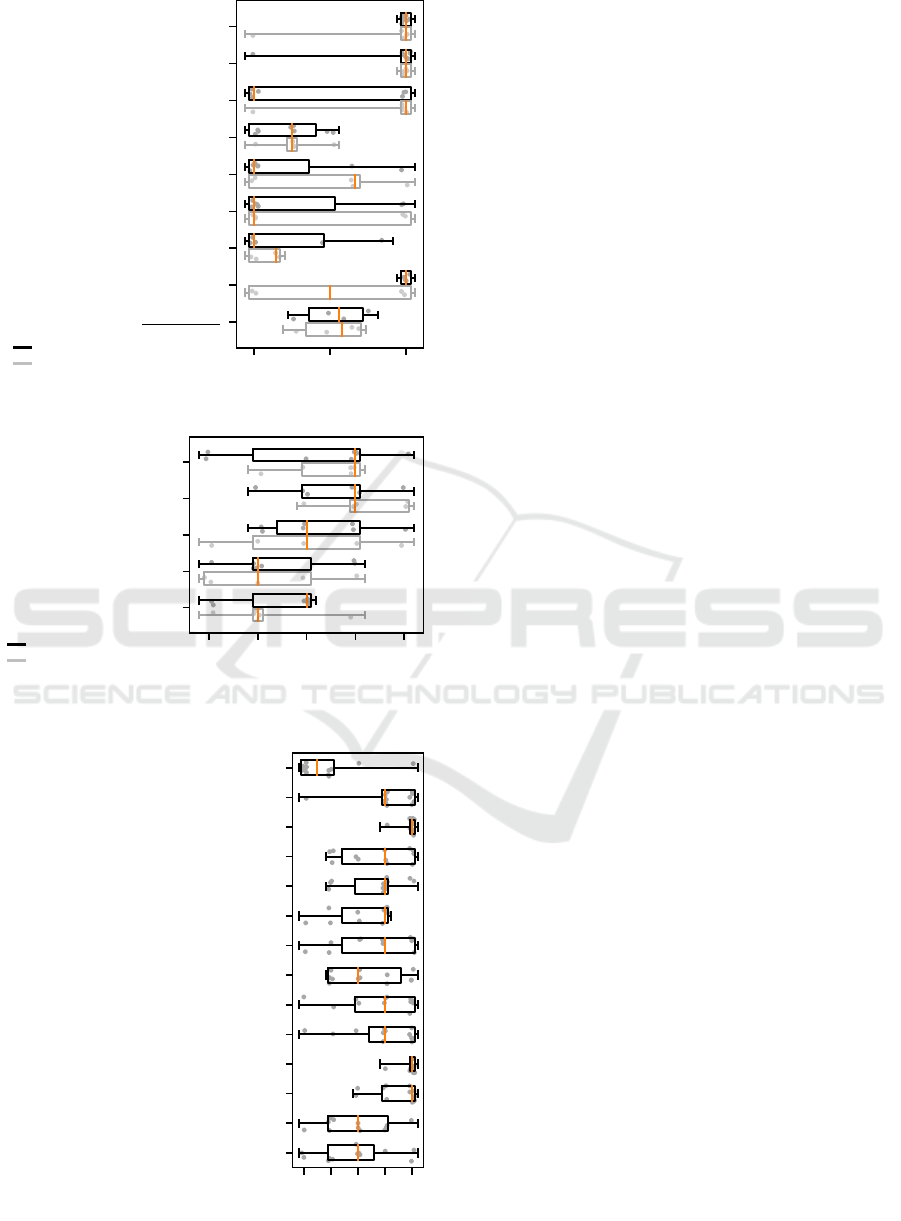
wrong
50%
correct
a) Which purpose does the
hystrix component serve?
b) How do the microservices
communicate?
c) Which is the component that
calls the WritingHistory?
d) Which use cases did the State
Service participate in?
e) Draw a sequence diagram for
the ”create new device” use case.
f) Which service holds the
user-device mapping?
g) Draw all relationships between
the shown 7 components.
h) Which use case touched the
least number of microservices?
a) + ... + h)
8
VR group (n = 5)
control group (n = 4)
Figure 4: Questionnaire I (comprehension).
strongly
disagree
disagree
neutral
agree
strongly
agree
a) I felt focussed during
the experiment
b) I could follow the
coach’s explanations
c) It was difficult to follow
the coach’s explanations
d) I was bored
e) I feel like I have learned
something
VR group (n=8)
control group (n=5)
Figure 5: Questionnaire II (acceptance).
strongly
disagree
disagree
neutral
agree
strongly
agree
a) The labels on the houses were helpful
b) Enlargening an object’s name with the
laser pointer was helpful
c) Being able to see the coach’s laser
pointer was helpful
d) Seeing the coach’s avatar was helpful
e) The trace visualization was easy to
understand
f) The segmented trace arcs were easy to
understand
g) The zoom function was useful
h) The zoom function was convenient to
use
i) Free walking was useful
j) Free walking was convenient to use
k) The teleportation feature was useful
l) The teleportation feature was convenient
to use
m) The city metaphor is an intuitive and
helpful means of software visualization
n) Virtual reality improves the user
experience
Figure 6: Questionnaire III (feature rating, n = 12).
visualization is any worse than traditional approaches
in conveying information. We cannot explain why the
VR group performed worse than the control group in
question Q.I.e, whereas they did a lot better in Q.I.h.
But on average (last pair of box plots), the partici-
pants were able to understand and memorize the sys-
tem and its internal workings about equally well. The
VR group achieved an overall correctness median of
58%; the control group reached 56%.
Questionnaire II. It seems like the ability to focus
and to follow the remote expert’s explanations was a
bit better with the traditional screen-based visualiza-
tion (Q.II.a-c). However, the VR participants at least
“agree” that it was possible to follow the explanations.
We explain the large spread in the answers from the
VR group with the relative novelty of the VR medium
as most of the participants had “little” or “no” pre-
experience and probably were impressed by a room-
scale VR setup. We suggest that some users were
overwhelmed, wanting to explore the new technol-
ogy without focusing on the explanations they were
subjected to. This is in line with other studies, find-
ing their users “curious” and “excited” (Merino et al.,
2017). Future experiments should extend the period
in which—after some training—the participants have
unsupervised time to play.
While a majority of the control group “[strongly]
disagrees” to have learned something (Q.II.e), our
approach at least had a majority being “neutral” or
“[strongly] agreeing”. We argue that because of the
visually more pleasing presentation, users felt that
they could remember more of the information that
was given to them. This is in line with research show-
ing that supporting multimedial cues help people re-
member facts better (Mayer et al., 1996).
Overall the data suggests that our approach is able
to present complex software relationships in a way
that is well-accepted by the participants.
Questionnaire III. From the answers to Q.III we con-
clude that visualizing the coach with the avatar and its
laser pointer are the key for collaborative software ex-
ploration in VR. Most of our users (Q.III.b-d) deemed
this at least “helpful”. This is not surprising since hu-
man collaboration relies a lot on visual cues (Clark
and Brennan, 1991; Clark, 2003).
While the object names were an important hint to
the user, having them attached to the tops of buildings
was not helpful (Q.III.a). Most participants did not
even notice their presence. Despite recent advances
in VR headset resolution and quality, the text was still
hard to read and thus useless. Our alternative was
well-accepted (Q.III.b): When pointing with the laser
pointer at an object, we show the name in a large over-
lay floating above the selected object.
IVAPP 2020 - 11th International Conference on Information Visualization Theory and Applications
154

All our navigation techniques (zoom, natural
walking and teleportation) were “[strongly] agreed”
to be helpful by a majority (Q.III.g-l). While we note
a large spread in the answers with the other two tech-
niques, teleportation was even “strongly agreed” to be
useful by more than 75%. Probably many participants
did not trust the boundaries shown by the VR system
and were uncomfortable walking, fearing they would
hit a wall. According to the recorded position logs
many users picked at most two spots and teleported
from there. Maybe an augmented or mixed reality
solution that embeds the VR into a 3D model of the
physical space can encourage users to better utilize
the available space.
Most participants “[strongly] agree” that our vi-
sualization makes traces easy to understand (Q.III.e).
The segmentation of the arcs to show external frame-
works is a good way of representing such dynamic
call relationships (Q.III.f).
In conclusion, most features implemented in our
approach were well accepted by the participants.
Finally, although the majority of the partici-
pants was “neutral” about the usefulness of the city
metaphor and the usage of VR to visualize software,
this is still good news as our system is just a re-
search prototype and can nevertheless already com-
pete a with state-of-the-art 2D tool. Also, more par-
ticipants from the VR group learned something new
than in the control group (Q.II.e).
6.4 Threats to Validity
The selection of the participants might influence the
result of the study. Some participants could be less
competent than others. Random group assignment
mitigated the issue. Participants in the VR group may
have been more motivated as VR is often regarded as
something new and exciting. We mitigated this by of-
fering all participants to try the VR.
Another threat is that one of the authors was the
coach, who may subconsciously have conveyed more
information to the VR group. We eliminated this by
restricting the coach to one written script so that all
participants had exactly the same information.
The ability to focus on the explanations may have
been impacted by disturbances such as people talk-
ing in the neighboring room. By randomly deciding
whether the next participant will be from the VR or
the control group and by coaching all participants in
the same lab we minimized this influence.
Our results are neither skewed by a lack of moti-
vation nor by fatigue: Half of the participants in both
groups “[strongly] agree” to be feeling focused during
the experiment; nobody was bored (Q.II.a,d).
Threats to the external validity are the selection of
the participants by recruiting them on the university
campus. This might result in an academic skew. Also,
using just one software system SmartPen and three
traces poses a threat. However, what strengthens the
validity is that it is a real-world productive system and
the traces illustrate non-toy use cases.
7 CONCLUSION
Understanding complex software systems requires
expressive visualization techniques that combine both
static information and dynamic tracing data. We de-
scribed and evaluated a software visualization sys-
tem in virtual reality that allows multi-user collabora-
tion. We extended the well-researched software city
metaphor to display tracing data, while reducing vi-
sual clutter by means of a pre-processing. Our system
offers intuitive navigation through space using state-
of-the-art techniques (natural walking and teleporta-
tion) and through time using a circular scroll pad.
We validated our system by means of a controlled
experiment and drew conclusions from the user re-
sponses. We discussed which features were useful
and how to improve others, and conclude that our pro-
posed visualization technique is a step towards next-
generation software visualization frameworks.
ACKNOWLEDGEMENTS
Supported by the Federal Ministry for Economic Af-
fairs and Energy on the basis of a decision by the Ger-
man Bundestag (ZF4110605LF8, ZF4580801LF8).
REFERENCES
Anslow, C., Marshall, S., Noble, J., and Biddle, R. (2013).
Sourcevis: Collaborative software visualization for co-
located environments. In VISSOFT’13: Proc. Working
Conf. Softw. Visualization, pages 1–10, Eindhoven, The
Netherlands.
Boletsis, C. (2017). The new era of virtual reality locomo-
tion: A systematic literature review of techniques and a
proposed typology. Multimodal Technologies and Inter-
action, 1(4):17pp.
Bozgeyikli, E., Raij, A., Katkoori, S., and Dubey, R. (2016).
Point & teleport locomotion technique for virtual reality.
In CHI PLAY’16: Proc. Annual Symp. Comp.-Human In-
teraction in Play, pages 205–216, Austin, TX.
Carlsson, C. and Hagsand, O. (1993). DIVE - a multi user
virtual reality system. In VRAIS’93: Proc. Virtual Reality
Annual Intl. Symp., pages 394–400, Seattle, WA.
Towards Collaborative and Dynamic Software Visualization in VR
155

Cherubini, M., de Oliveira, R., Oliver, N., and Ferran, C.
(2010). Gaze and gestures in telepresence: multimodal-
ity, embodiment, and roles of collaboration. Technical
Report arXiv:1001.3150v1, ArXiV.
Ciolkowski, M., Faber, S., and von Mammen, S. (2017). 3-
d visualization of dynamic runtime structures. In IWSM
Mensura’17: Proc. Intl. Workshop Softw. Measurement
and Intl. Conf. Softw. Process and Product Measurement,
pages 189–198, Gothenburg, Sweden.
Clark, H. H. (2003). Pointing and placing. In Kita, S.,
editor, Pointing: Where language, culture, and cognition
meet, chapter 10, pages 243–268. Lawrence Erlbaum As-
sociates Publishers, Mahwah, NJ.
Clark, H. H. and Brennan, S. E. (1991). Grounding in com-
munication. In Resnick, L., Levine, J., and Teasley, S.,
editors, Perspectives on socially shared cognition, chap-
ter 7, pages 127–149. American Psychological Associa-
tion, Washington, DC.
Donalek, C., Djorgovski, S. G., Cioc, A., Wang, A., Zhang,
J., Lawler, E., Yeh, S., Mahabal, A., Graham, M. J.,
Drake, A. J., Davidoff, S., Norris, J. S., and Longo, G.
(2014). Immersive and collaborative data visualization
using virtual reality platforms. In Big Data 2014: Proc.
Intl. Conf. Big Data, pages 609–614, Washington, DC.
Fittkau, F., Krause, A., and Hasselbring, W. (2015). Ex-
ploring software cities in virtual reality. In VISSOFT’15:
Proc. Working Conf. Softw. Visualization, pages 130–
134, Bremen, Germany.
Fittkau, F., Krause, A., and Hasselbring, W. (2017). Soft-
ware landscape and application visualization for system
comprehension with ExplorViz. Information and Softw.
Technology, 87(Jun.):259–277.
Fittkau, F., Waller, J., Wulf, C., and Hasselbring, W. (2013).
Live trace visualization for comprehending large soft-
ware landscapes: The ExplorViz approach. In VIS-
SOFT’13: Proc. Working Conf. Softw. Visualization,
pages 1–4, Eindhoven, The Netherlands.
Fraser, M., Glover, T., Vaghi, I., Benford, S., Greenhalgh,
C., Hindmarsh, J., and Heath, C. (2000). Revealing the
realities of collaborative virtual reality. In CVE’00: Proc.
Intl. Conf. Collaborative Virtual Environments, pages
29–37, San Francisco, CA.
Hahn, S., Trapp, M., Wuttke, N., and D
¨
ollner, J. (2015).
Thread city: Combined visualization of structure and ac-
tivity for the exploration of multi-threaded software sys-
tems. In IV’15: Proc. Intl. Conf. Information Visualisa-
tion, pages 101–106, Barcelona, Spain.
Herbst, I., Braun, A.-K., McCall, R., and Broll, W. (2008).
Timewarp: interactive time travel with a mobile mixed
reality game. In Proc. Conf. Human-Comp. Interaction
with Mobile Devices and Services, Mobile HCI, pages
235–244, Amsterdam, The Netherlands.
Jackson, R. L. and Fagan, E. (2000). Collaboration and
learning within immersive virtual reality. In CVE’00:
Proc. Intl. Conf. Collaborative Virtual Environments,
pages 83–92, San Francisco, CA.
Langbehn, E., Lubos, P., Bruder, G., and Steinicke, F.
(2017). Application of redirected walking in room-scale
VR. In VR’17: Proc. Virtual Reality, pages 449–450,
Los Angeles, CA.
Langbehn, E., Lubos, P., and Steinicke, F. (2018). Evalu-
ation of locomotion techniques for room-scale VR: Joy-
stick, teleportation, and redirected walking. In VRIC’18:
Proc. Virtual Reality Intl. Conf., pages 4:1–4:9, Laval,
France.
LaViola, J. J. (2000). A discussion of cybersickness in vir-
tual environments. SIGCHI Bulletin, 32(1):47–56.
Mayer, R. E., Bove, W., Bryman, A., Mars, R., and
Tapangco, L. (1996). When less is more: Meaning-
ful learning from visual and verbal summaries of sci-
ence textbook lessons. J. of Educational Psychology,
88(1):64–73.
Merino, L., Ghafari, M., Anslow, C., and Nierstrasz, O.
(2017). CityVR: Gameful software visualization. In IC-
SME’17: Proc. Intl. Conf. Softw. Maintenance and Evo-
lution, pages 633–637, Shanghai, China.
Nabiyouni, M., Saktheeswaran, A., Bowman, D. A., and
Karanth, A. (2015). Comparing the performance of natu-
ral, semi-natural, and non-natural locomotion techniques
in virtual reality. In Virtual Reality (VR), pages 243–244,
Arles, France.
Panas, T., Berrigan, R., and Grundy, J. C. (2003). A
3d metaphor for software production visualization. In
IV’03: Proc. Intl. Conf. Information Visualization, pages
314–319, London, UK.
Reiss, S. P. (1995). An engine for the 3d visualization of
program information. J. Vis. Lang. Comput., 6(3):299–
323.
Rekimoto, J. and Green, M. (1993). The information cube:
Using transparency in 3d information visualization. In
WITS’93: Proc. Annual Workshop Information Tech-
nologies & Sys., pages 125–132, Orlando, FL.
Schreiber, A., Nafeie, L., Baranowski, A., Seipel, P., and
Misiak, M. (2019). Visualization of software architec-
tures in virtual reality and augmented reality. In Proc.
Aerospace Conf., pages 1–12, Big Sky, MT.
Teyseyre, A. R. and Campo, M. R. (2009). An overview of
3d software visualization. Trans. Vis. Comput. Graph.,
15(1):87–105.
Wettel, R. and Lanza, M. (2007). Visualizing software sys-
tems as cities. In VISSOFT’07: Proc. Intl. Workshop Vi-
sualizing Softw. for Understanding and Analysis, pages
92–99, Banff, Alberta, Canada.
IVAPP 2020 - 11th International Conference on Information Visualization Theory and Applications
156
