
Analysis of the Relationship between Electrodermal Activity and
Heart Rate with Pain in Individuals with a Shoulder Pathology
M. Oliveira
1
, C. Quintão
1,2
, R. Vigário
1,2
, B. Mendes
3
, C. Caldeira
3
, F. Rodrigues
3
and C. Quaresma
1,2
1
Departamento de Física, Faculdade de Ciências e Tecnologias, Universidade Nova de Lisboa,
2829-516 Monte da Caparica, Portugal
2
Laboratório de Instrumentação, Engenharia Biomédica e Física da Radiação (LIBPhys-UNL), Departamento de Física,
Faculdade de Ciências e Tecnologia da Universidade Nova de Lisboa, Monte da Caparica, 2892-516, Caparica, Portugal
3
Área de Medicina Física e Reabilitação, Hospital Curry Cabral, Centro Hospitalar Lisboa Central, Portugal
Keywords: Electrodermic Signal, Heart Rate, Pain, Shoulder, Signal Processing.
Abstract: Currently, pain analysis in a clinical environment is not common and is at fault for being subjective and
always dependent on a personal response. Therefore, it is imperative to use physiological signals to quantify
pain and make diagnosis more objective. This article aims to study the relationship between pain, through its
analog scale, with the electrodermal and cardiac signals of individuals characterized by having a shoulder
pathology that gives rise to recurrent pain. This study was carried out on 21 patients from Hospital Curry
Cabral, who were part of the Occupational Therapy department’s care in the area of Physical Medicine and
Rehabilitation, and 18 individuals without any pathology, thus serving as a control group. All participants
followed an experimental protocol consisting in the measurement of electrodermal and cardiac signals and
pain level when performing two different movements. The results suggest that there is indeed a relationship
between the two measured signals and pain. The greater the pain experienced by the individual, the greater
the amplitude of the electrodermic signal and heart rate appears to be.
1 INTRODUCTION
Over the years, due to various technological
advances, a new ability to obtain and process
physiological signals has emerged. It is thanks to
these technological advances that it is possible to
deepen the knowledge on numerous pathologies and
consequently improve the clinical diagnosis. Several
innovations in technology are responsible for this
improvement, from new physiological signal
acquisition devices to new signal processing tools.
However, there are still many pathologies that lack
an easy and objective clinical diagnosis, as is the case
of orthopedic diseases. This is a consequence of the
diagnosis not being made by collecting and analyzing
physiological signals. Many of these pathologies can
originate in the way people live their daily lives, from
the physical activity performed to their job. Although
physical exercise has great benefits for both physical
and mental health (Warburton et al., 2006), excessive
or incorrectly performed physical activity can lead to
orthopedic injuries (Gabbett, 2016). Jobs that require
repetitive movements or high physical strain, such as
jobs in construction or factories using the assembly
line system, can lead to such pathologies, particularly
in the shoulder (Mitchell et al., 2005), having already
been a concern performing a rotation of workers in
different positions on the assembly lines, so as to vary
the type of movements made by them. It is the
difficulty in diagnosing these pathologies that
motivates the development of new techniques and
technologies in order to make the diagnosis easier
and more objective. These conditions often make a
healthy and pain-free life impossible, so it is
imperative that solutions be found for their correct
diagnosis. However, the quantification of pain is
subjective, since it uses analog scales and depends on
each individual's perception of pain. This leads to
subjective and inaccurate diagnoses (Kandel et al.,
2000). Thus, the correct quantification of pain, in a
non-subjective way and based on physiological signs,
becomes essential. The Nervous System of an
110
Oliveira, M., Quintão, C., Vigário, R., Mendes, B., Caldeira, C., Rodrigues, F. and Quaresma, C.
Analysis of the Relationship between Electrodermal Activity and Heart Rate with Pain in Individuals with a Shoulder Pathology.
DOI: 10.5220/0008945001100117
In Proceedings of the 13th International Joint Conference on Biomedical Engineering Systems and Technologies (BIOSTEC 2020) - Volume 1: BIODEVICES, pages 110-117
ISBN: 978-989-758-398-8; ISSN: 2184-4305
Copyright
c
2022 by SCITEPRESS – Science and Technology Publications, Lda. All rights reserved

individual after experiencing pain, namely the
Sympathetic Nervous System, produces a change in
sweat excretion and heart rate, and these changes are
translated into the electrodermal signal (EDA)
(Ströfer et al., 2015) and the electrocardiogram
(ECG) (Shaffer et al., 2014), respectively.
Thus, this study aims to collect these signals and
correlate them with an analog pain scale, always
aiming to make the quantification of pain more
objective.
2 MATERIALS AND METHODS
The study was approved by the Portuguese Ethics
Committee of Hospital Curry Cabral, in Portugal.
Each participating subject was informed about the
procedures and the objectives of the study, prior data
collection, and signed a consent form with this
information.
All data was collected, during 3 months, from a
cohort of patients, with a shoulder pathology that gives
rise to recurrent pain, attending the occupational
therapy department’s care in the area of Physical
Medicine and Rehabilitation in Hospital Curry Cabral.
This study was carried out on 21 patients and 18
individuals without any pathology, among the
student population of FCT-NOVA, and thus serving
as a control group.
Characterization of the Sample
The sample is easily divided in two different groups:
the patients group (P) and the healthy individuals
group (H). The P group is composed by 21 patients,
15 female and 6 male, with an average age of 64 ± 12
years old. The H group consists in 18 healthy
individuals, 11 male and 7 female, with an average
age of 24 ± 3 years old. Although the two groups have
different ages, as the data was processed separately
for the two samples, the authors consider that the
results remain valid.
2.1 Instruments
For data collection, the Biosignalsplux equipment, was
used. From the available sensors, an EDA sensor was
used to measure the electrodermal signal, an ACC
(accelerometer) sensor to assist in timing and an ECG
sensor for heart rate estimation. The ECG sensor has 3
channels and the EDA sensor has 2 where the
electrodes are attached after their fixation on the
individual. It is through these set channels / electrodes
that EDA and ECG are collected. Solid gel disposable
ECG electrodes with an easy contact with the skin
were used. The recording device collects the
physiological signals simultaneously, with a 16-bit
resolution and sampling frequencies of 1000 Hz. All
data is transmitted, via Bluetooth, from Biosignalsplux
to the computer for processing (Plux, 2019).
All signals were processed using program Matlab
R2017a.
2.2 Procedure
The team composed by biomedical engineers and
some occupational therapists at Hospital Curry
Cabral identified the movements as well as all the
steps to be performed during the protocol. The
experimental protocol always follows 3 sequential
steps: explanation of the experimental protocol;
electrode placement; acquisition of EDA, ACC and
ECG signals; signal analysis.
1) Explanation of the Experimental Protocol
Initially it is always explained to the participants the
purpose of the study and how data collection will be
performed in order to obtain the informed consent. If
the participant agrees to their collaboration in the
study, the informed consent is signed. After this first
step it is needed to fill out a short form designed to
characterize the individual (age, profession,
medication, etc.).
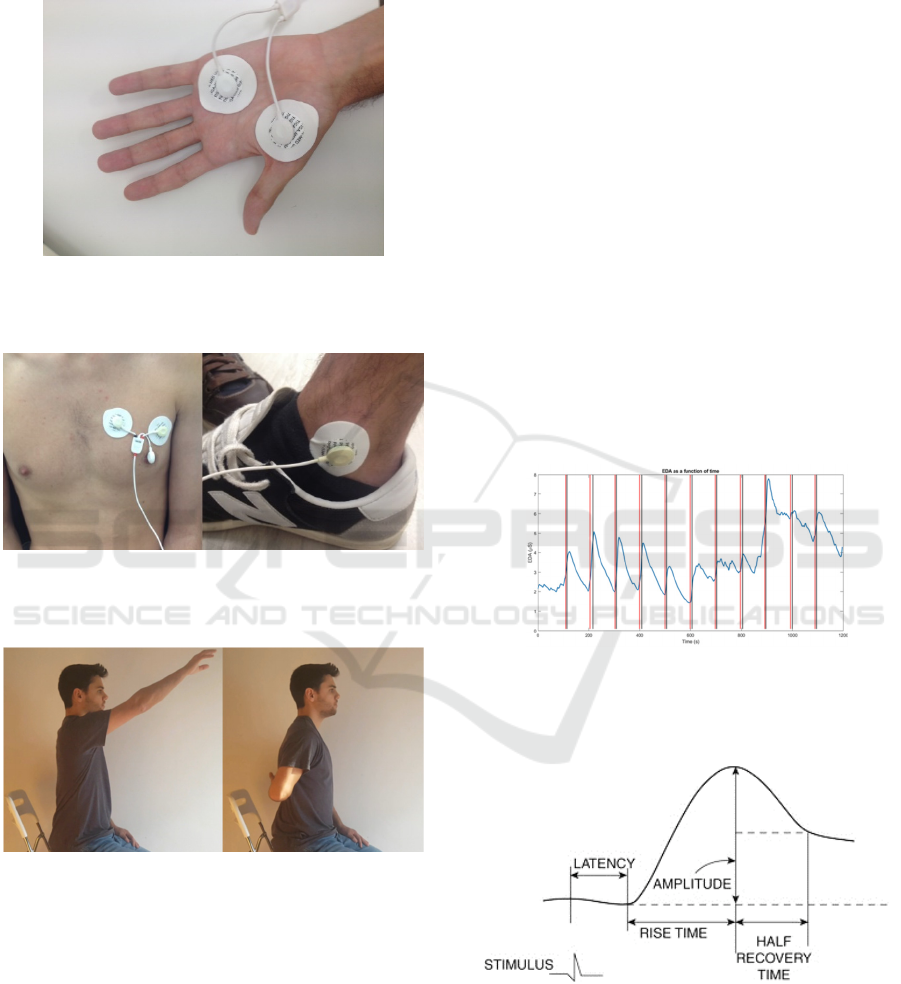
2) Electrode Placement
After filling in the form, follows the placement of the
electrodes. The two EDA sensor electrodes are
placed on the front of the hand, as shown in Figure 1.
The hand where the electrodes are placed will always
be the opposite of the arm that will make the
movements. Thus, the required movements do not
interfere with the measured signal, since the hand in
which it is recorded, was as static as possible. The 3
ECG electrodes are also placed, two on the chest and
one on the right foot next to the talus bone, as shown
in Figure 2. In the case of healthy individuals, the arm
that performs the movements always corresponds to
the dominant hand.
3) Acquisition of EDA, ACC and ECG Signals
A video with the exact duration of the collection was
created to assist in data acquisition. The video shows
which movements to perform and the moments in
which participants have to execute them. In the first
phase the participants are sitting at rest. After 1
minute and 30 seconds they perform the first
movement - shoulder flexion with elbow extension -
followed by a further period of 1 minute and 30
seconds at rest. After this second rest period the
Analysis of the Relationship between Electrodermal Activity and Heart Rate with Pain in Individuals with a Shoulder Pathology
111
participants perform the second movement - internal
rotation of the shoulder with elbow flexion. Both
movements are represented in Figure 3.
Figure 1 Example of placing the electrodes corresponding
to the EDA signal on the front side of a participant's hand
moments before a collection.
Figure 2: Example of placement of the electrodes
corresponding to the ECG signal on a participant's chest
and talus moments before a collection.
Figure 3: Representation of the two movements made
during data collection. On the left - shoulder flexion with
elbow extension, and on the right - internal shoulder
rotation with elbow flexion.
This process continues until there are 6 shoulder
flexions with elbow extension and 5 shoulder internal
rotations with elbow flexion, ending with a rest
period. After each movement, the participant is asked
the intensity of the pain they felt, using the Numerical
Pain Rating Scale (Hjermstad et al., 2011, and the
answer is added to the participant's form. This scale
is a subjective measure and consists of eleven equal
parts, numbered successively from 0 to 10
(Hjermstad et al., 2011). The patient is asked to make
the equivalence between the degree of pain and the
numerical score, with 0 corresponding to “no pain at
all” and 10 to “worst imaginable pain”.
Participants are also asked to exert a little more
effort on the last three movements to cause a slight
increase in pain. The timing of all the movements is
set by the ACC sensor. An up-down sensor rotation
indicates the beginning of a movement and a down-
up rotation indicates the end of a movement.
4) Signal Analysis
After collecting all data, the processing phase begins.
The first step is to smooth out the EDA signal as it
has some noise. For this purpose a sliding average
filter is applied. The window of this filter is 5 points
and the method used was the Savitzky-Golay
(Savitzky and Golay, 1964). The instants of the
beginning and ending of each movement are also
drawn in the same graph, using the values from the
ACC sensor. In Figure 4 is shown the result of this
processing.
Figure 4: Electrodermic signal (μS) of patient 03 and
moments of the beginning, marked in red, and the end,
marked in black, of the movements after the use of the
sliding average filter.
Figure 5: Representation of the features extracted from
EDA signal (Dawson et al., 2016).
The skin conductance responses were analyzed
using the following features: amplitude, rise time and
half recovery time. These features were extracted
through the determination of the maximum value of
BIODEVICES 2020 - 13th International Conference on Biomedical Electronics and Devices
112
the stimulus response and the baseline level (Figure
5). The maximum value of the stimulus response is
always the highest amplitude value measured after
the movement and the baseline is the upward facing
concavity point always found on the left of the
highest amplitude point. The amplitude is the
difference between the maximum response value and
the baseline value. Rise time is calculated as the
difference between the time indices of the maximum
amplitude points and the baseline. The half recovery
time requires more calculation as it is necessary to
calculate the amplitude point at half height. This
point will have an amplitude equal to the difference
between the maximum value and half the amplitude
of the stimulus response and is always on the right of
the stimulus response. The half-recovery time is then
calculated by making the difference in time indices
between this point now found and the point of
maximum amplitude.
In order to carry out a study of the average EDA
responses of all sample, it was necessary to normalize
the collected signals. For each individual, the
amplitude of each response was divided by the
highest amplitude recorded. Thus obtaining for all
individuals amplitudes between 0 and 1.
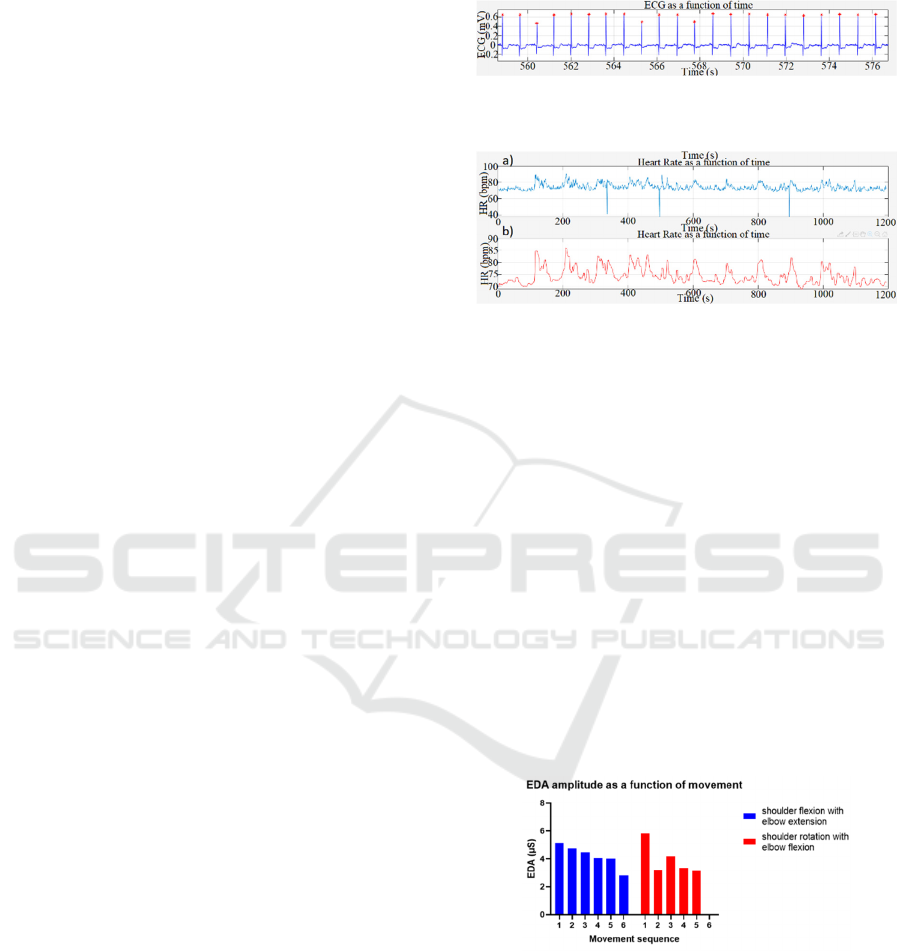
For processing the ECG signal R-waves were
detected to create a graph showing heart rate as a
function of time, since heart rate is the inverse of the
time interval between consecutive R waves. Figure 6
shows a portion of an electrocardiogram collected
during the performance of the protocol. These were
detected with the help of the Matlab findpeaks
function, using 20 points as the minimum peak
distance and 5 times the average of the prominence
of all peaks as minimum peak height options.
Following the creation of this graph and due to
misidentification of R waves, signal smoothing is
performed, thus eliminating false R waves. (see
Figure 7). This smoothing was performed with the
medfilt1 function, which applies a 10
th
order median
filter to the signal.
Following the creation of the latter graph, and
similar to what was done with the electrodermal
signal, the maximum value of the stimulus response
and the baseline values are extracted so that the
amplitude can be calculated. Since the start and end
times of all movements are the same on the HR graph
and EDA graph, it is easy to identify the heart
response to movement and do that to pain.
Regarding HR study, one is interested in the
difference between the peak value of HR response to
movement / pain and the basal value found
immediately before the response to movement (DIF
(HR)). Similarly to the EDA approach, also this
difference is normalized by the highest difference HR
obtain for each subject.
Figure 6: Electrocardiogram of patient 02 recorded during
data collection. R Waves are highlighted.
Figure 7: Heart rate as functions of time, a) original and b)
smoothed. Graphs relative to patient 02.
3 RESULTS AND DISCUSSION
The results obtained in this study are divided into two
parts. The first one is about the healthy individuals
group and the second one about the patients group.
3.1 Healthy Group
The first important idea to mention is that even
without causing pain, movements performed during
the experimental protocol cause an increase in the
EDA signal, as expected. Figure 8 shows a column
chart for one healthy participant, showing the
amplitude of the EDA along the sequence of
movements.
Figure 8: Electrodermic signal amplitude of healthy
individual 01 along the sequence of movements.
It is apparent that the amplitude of the
electrodermic signal is higher in the first movements
and then gradually decreases. This response behavior
is thought to be related to some subjective factors.
Namely, the stress / surprise caused by starting a new
task This behavior is observed in about one third of
healthy participants, with the rest showing similar
Analysis of the Relationship between Electrodermal Activity and Heart Rate with Pain in Individuals with a Shoulder Pathology
113
amplitude throughout the protocol or, in rare cases,
sporadic increases. The latter may be due to factors
outside the experimental protocol (room temperature
and involuntary auditory stimuli, for example).
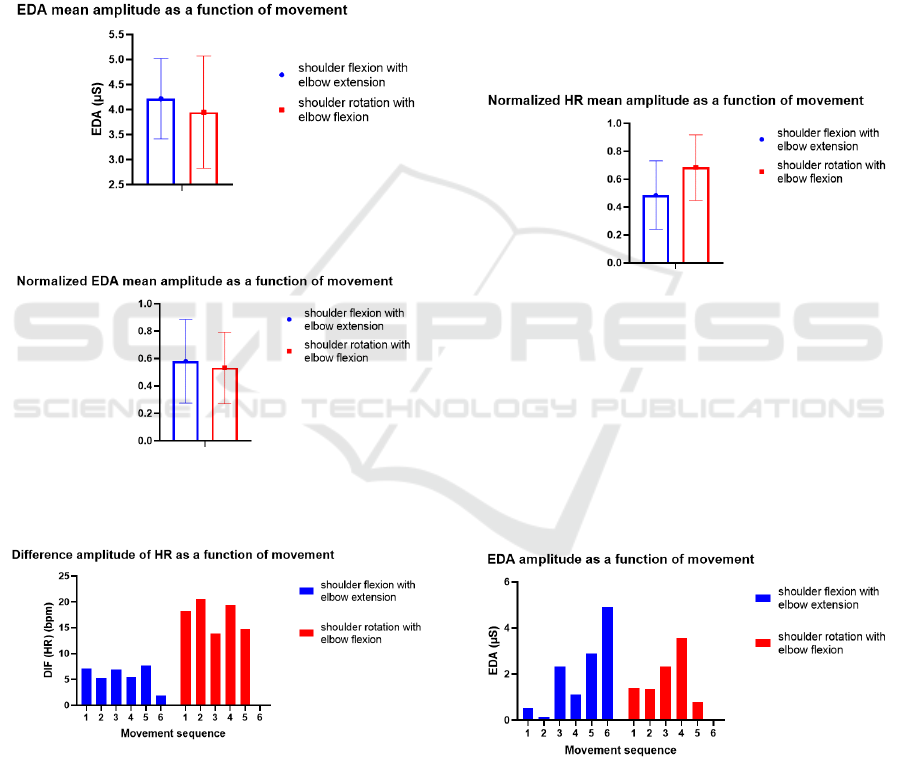
Due to the gradual decrease mentioned above and
considering that the protocol starts with shoulder
flexion and elbow extension, the average response
amplitude is expected to be greater in this movement
(see Figure 9). Taking that into consideration, it is
also relevant to note that the amplitude of the
stimulus response is not movement dependent, in the
heathy group.
Figure 9: Mean amplitude of the electrodermic signal of
healthy patient 01 for both movements.
Figure 10: Normalized mean amplitude of the
electrodermic signal of all healthy participants for the two
movements performed.
Figure 11: Heart rate amplitude of healthy individual 17 for
both movements.
This idea is also corroborated by the graph shown
in Figure 10, where the mean and standard deviation
of the normalized signals for each movement were
shown.
Similar to the EDA signal, heart rate also
increases after a movement. Figure 11 depicts the
heart rate column graph along the sequence of
movements in one subject with typical behavior.
In Figure 11 it is evident that there is a clear
difference in HR amplitude relative to both
movements. It is an effect manifested in more than
half of participants without pathology. The others
have an average difference in HR amplitude similar
between the two movements. Thus, when all these
differences for all individuals without pathology are
normalized, the shoulder rotation movement with
elbow flexion presents an arithmetic average superior
to the shoulder flexion movement with elbow
extension (see Figure 12). A possible explanation for
this effect could be that the shoulder rotation
movement with elbow flexion requires more physical
effort.
Figure 12: Normalized HR mean amplitude of all healthy
participants for both movements performed.
3.2 Patients Group
For the patient group, an analysis similar to the
previously presented one, the non-pathological
group, was performed. In addition, the patient group
included information regarding the pain score.
Figure 13 shows the amplitude of the EDA along
the sequence of movements, for patient 20.
Figure 13: Amplitude of the electrodermic signal of patient
20 along the sequence of movements.
In Figure 13 it is clear that the amplitude of the
EDA does not remain constant and does not gradually
increase or decrease along the sequence of
movements, as it was observed in the healthy group.
This effect is present in 90% of participants with
BIODEVICES 2020 - 13th International Conference on Biomedical Electronics and Devices
114
pathology. This difference from what happens to
individuals without pathology could be explained by
the pain felt when performing the movements.
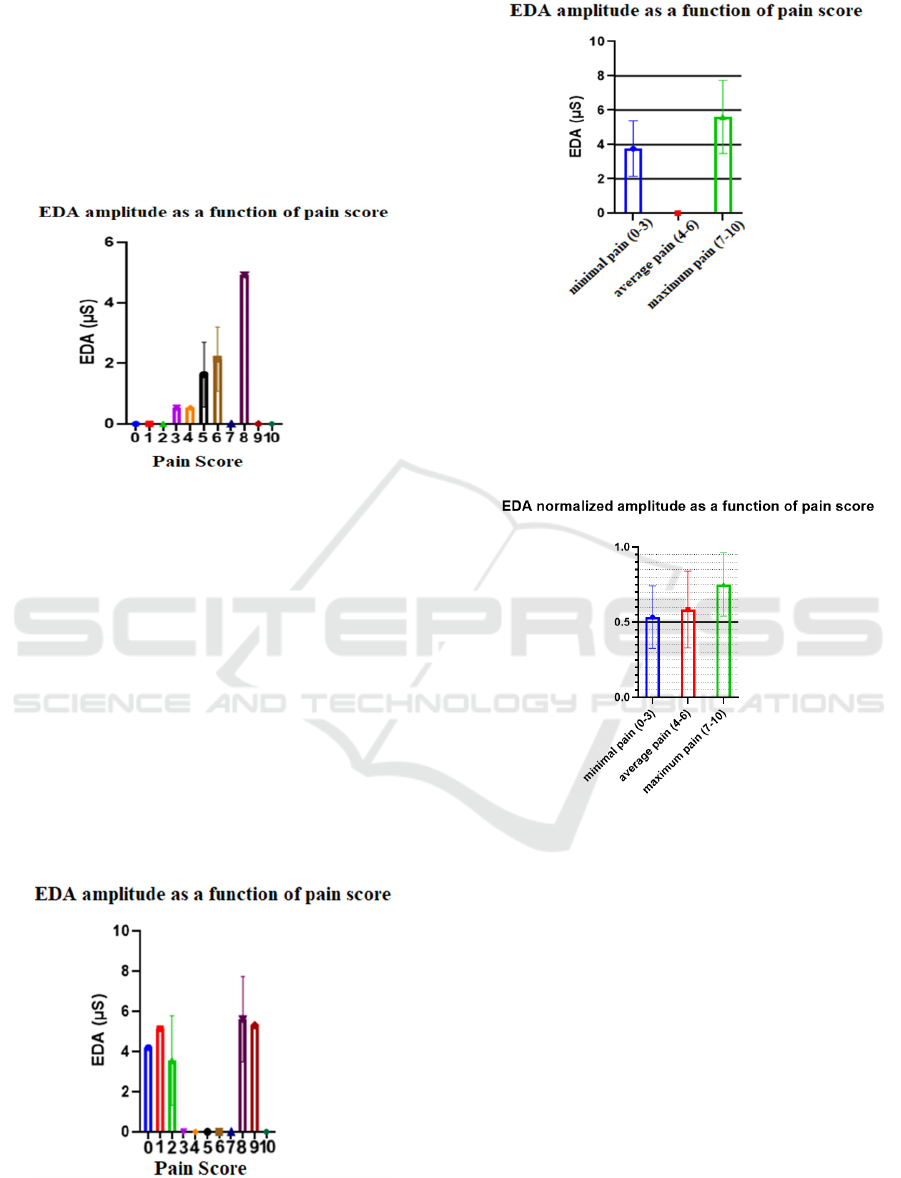
In order to understand how pain influences the
electrodermal signal, graphs of the amplitude of the
EDA as a function of pain score were created for all
individuals with pathology (see Figure 14 for) patient
20.
Figure 14: Electrodermic signal amplitude of patient 20 as
a function of pain score.
In Figure 14 it is evidenced that higher pain levels
correspond to higher EDA amplitudes. However, we
observed that in the case of patient 12, among others,
this effect is not so easily visible (see Figure 15).
Since the difference between consecutive pain levels
is very difficult to distinguish, it was decided to
divide the pain scale into three classes: minimal pain
(pain levels 0, 1, 2 and 3), average pain (pain levels
4, 5 and 6) and maximum pain (pain levels 7, 8, 9 and
10). Thus it becomes even more evident that when
the pain experienced is greater, the amplitude of the
EDA signal is also greater. Figure 16 show the graphs
of the amplitude of the EDA as a function of pain
score for patient 12, after the pain scale division.
Figure 15: Electrodermic signal amplitude of patient 12 as
a function of pain score.
Figure 16: Electrodermal signal amplitude of patient 12 as
a function of grouped pain score.
Taking into account all individuals with
pathology, a graph of the mean normalized
amplitudes was created as a function of the grouped
pain scores (see Figure 17).
Figure 17: Normalized mean amplitude of the
electrodermic signal of all participants with pathology as a
function of the grouped pain score.
Concerning all participants with pathology, in
only two the amplitude of the EDA as a function of
the grouped pain score shown a different behavior
than the one observed in Figure 17. It should be notes
that although the graph in figure 17 contains
information from these two patients and also from
patients who did not experience pain levels in the full
spectrum of the scale, the "greater pain - greater
amplitude" ratio of EDA is still clearly visible.
Regarding heart rate, an analysis very similar to
that of the electrodermal signal was performed.
Figure 18 shows the HR data along the sequence of
movements for patient 19. It is apparent that the
differentiation of HR data from the two movements
is no longer evident as it was for individuals without
Analysis of the Relationship between Electrodermal Activity and Heart Rate with Pain in Individuals with a Shoulder Pathology
115
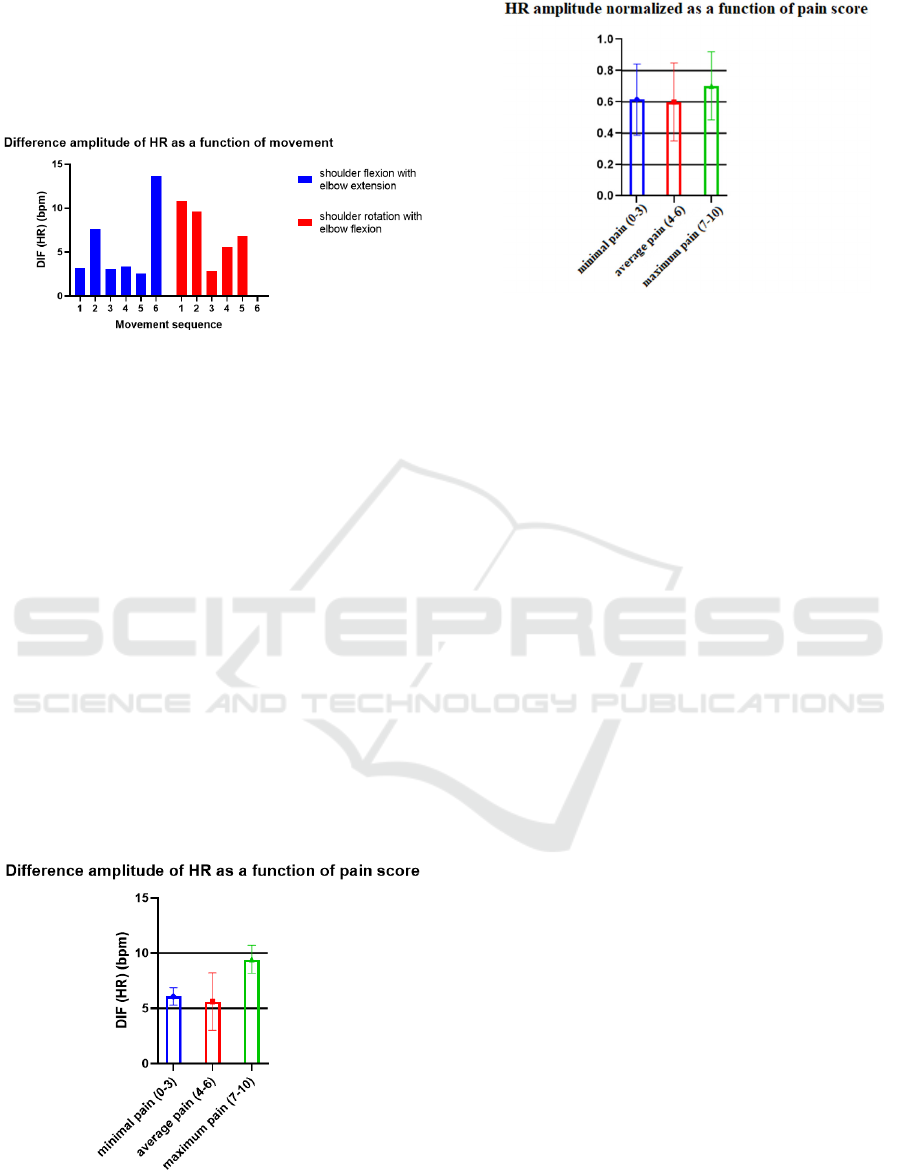
pathology. This is true for all patients and can also be
explained by the existence of pain when performing
the movements. This means that the effect of pain
overlaps the effect of physical effort observed in the
control group.
Figure 18: Heart rate amplitude of patient 19 for both
movements.
Similarly to what was performed for the EDA, the
pain scale was divided into three parts and the HR
amplitude graphs were created as a function of the
grouped pain scores (for example, see Figure 19
related to patient 16.
As with the electrodermal signal, heart rate also
increases as pain experienced by patients increases,
however, this relationship is not as linear as that
which appears to be present in the EDA signal. This
is shown in Figure 20, which has the pain-related HR
information for all individuals with pathology.
Again, it was necessary to normalize all amplitudes
for all subjects individually, as before, and to do the
arithmetic mean and standard deviation for each
group of pain levels. As could be observed, the
maximum pain also corresponds to maximum heart
rate, but the amplitude corresponding to the
minimum pain is slightly greater than that
corresponding to the average pain.
Figure 19: Heart rate amplitude of patient 16 as a function
of grouped pain score.
Figure 20: Normalized mean amplitude of the heart rate of
all participants with pathology as a function of the grouped
pain score.
4 CONCLUSIONS
Through the analysis of the obtained data it can be
concluded that there is a pain-EDA as well as a pain-
HR relationship. For both EDA and HR, the greater
the pain experienced by the individual, the greater the
amplitude of the respective signal. This is a clearly
observable relationship when comparing only low
and high pain scores.
In the future, it will be important to have a larger
and more homogeneous sample, in terms of age as
well as in pain scores. It would be, also, interesting to
conduct a similar study in individuals with
pathologies located elsewhere, for example in the leg,
or even of a different pathologies, for example,
neurological disorders.
Thus, it is important to continue the study of the
relationship between pain and physiological signs in
order to achieve stronger conclusions. Once
stablished a clear relationship between pain scores
and physiological signals, the clinicians will be able
to access an objective tool of diagnosis and
intervention.
ACKNOWLEDGEMENTS
The authors would like to thank all the patients who
participated in this study and all the staff of Hospital
Curry Cabral, specifically those who work in the
Occupational Therapy department in the area of
Physical Medicine and Rehabilitation, since without
them this study would not have been conducted.
BIODEVICES 2020 - 13th International Conference on Biomedical Electronics and Devices
116

REFERENCES
Dawson, M., Schell, A., & Filion, D. (2016). The
Electrodermal System. In J. Cacioppo, L. Tassinary, &
G. Berntson (Eds.), Handbook of Psychophysiology
(Cambridge Handbooks in Psychology, pp. 217-243).
Cambridge: Cambridge University Press.
Warburton D. E. R., Nicol C. W., Bredin S. S. D., “Health
benefits of physical activity: the evidence,” CMAJ,
2006.
Gabbett T. J., “The training-injury prevention paradox:
should athletes be training smarter and harder?,” Br. J.
Sports Med., 2016.
Hjermstad M. J., Fayers P. M., Haugen D. F., Caraceni A.,
Hanks G. W., Loge J. H., Fainsinger R., Aass N.,
Kaasa. S., European Palliative Care Research
Collaborative (EPCRC). “Studies comparing
numerical rating scales, verbal rating scales, and visual
analogue scales for assessment of pain intensity in
adults: a systematic literature review”. Journal of Pain
and Symptom Management 41 (6) June 2011
Mitchell C., Adebajo A., Hay E., Carr A., “Shoulder pain:
diagnosis and management in primary care,” BMJ,
2005.
Savitzky, A., Golay, M. J. E. "Smoothing and
Differentiation of Data by Simplified Least Squares
Procedures". Analytical Chemistry. 36 (8): 1627–39.
1964
Ströfer S., Noordzij M. L., Ufkes E. G., Giebels E.,
“Deceptive Intentions: Can Cues to Deception Be
Measured before a Lie Is Even Stated?,” PLoS One,
2015.
Shaffer F., McCraty R., Zerr C. L., “A healthy heart is not
a metronome: an integrative review of the heart‟s
anatomy and heart rate variability,” Front. Psychol.,
2014.
Plux, “Research Kits - Professional.” [Online]. Available:
http://biosignalsplux.com/en/pro. [Accessed: 21-Jan
2019].
Kandel E. R., Schwartz J. H., Jessell T. M. “Principles of
Neural Science”, 4º edição, McGraw-Hill, 2000
Analysis of the Relationship between Electrodermal Activity and Heart Rate with Pain in Individuals with a Shoulder Pathology
117
