
Development of a Continuous Blood Pressure Monitoring System
based on Pulse Transit Time and Hemodynamic Covariates
Yiming Zhang
1
, Congcong Zhou
1
, Zhongyi Huang
1
and Xuesong Ye
1,2
1
Department of Biomedical Engineering, Key Laboratory for Biomedical Engineering of Education Ministry,
Zhejiang University, Hangzhou 310027, China
2
Cyrus Tang Center for Sensor Materials and Applications, Zhejiang University, Hangzhou 310058, P.R. China
Keywords: Blood Pressure, Non-invasive, Pulse Transit Time, Synchronization, Wearable.
Abstract: There were many studies showing the relation between pulse transit time (PTT) and blood pressure (BP).
Besides, hemodynamic covariates may also contribute to BP values. Our previous study has proposed a BP
model based on PTT, HR, stiffness index (SIx) and descent time (DT), which has been validated on the Multi-
parameter Intelligent Monitoring for Intensive Care (MIMIC) database. In this article, we present a prototype
cuff-less monitoring device for non-invasive estimation of BP, which can obtain both electrocardiogram
(ECG) and finger plethysmograph (PPG) signals synchronously. The model proposed above has been
validated by using ECG and PPG records from 22 healthy subjects with no cardiovascular disease and
hypertension, and the error of BP estimation was 0.002±8.544 mmHg for SBP, 0.005±6.690 mmHg for
DBP. The reliability of this method in long-term BP monitoring was further verified by studying the data of
one individual for 28 days, while the error was 5.204±5.462 mmHg for SBP, 2.714±4.756 mmHg for DBP
without calibration. The results show that the model could estimate the BP value within the acceptable error
range based on this study, which is extremely close to AAMI's standard (5±8mmHg) and consistent with the
cuff-method. The proposed ultra-low power, wearable, time-synchronized prototype monitoring device with
an embedded hemodynamic covariate model, can measure SBP and DBP values accurately, which is expected
to estimate continuous blood pressure better.
1 INTRODUCTION
Blood pressure (BP) is the lateral pressure on the
vessel wall during blood flow. BP varies continuously
due to different factors such as emotion variation,
physical activities, medication, and disease. Many
studies have shown a significant correlation between
BP variability and cardiovascular mortality (Kikuya
et al., 2000). Continuous measurement of blood
pressure (BP) can dynamically monitor blood
pressure fluctuation, which has very important
practical significance and clinical value.
Although continuous BP can be accurately
measured by invasive methods (e.g. insertion of an
intra-arterial catheter), it could introduce risks to the
patient and workload for physicians (Fung, Dumont,
Ries, Mott, & Ansermino, 2005). Therefore, there is
an urgent requirement for non-invasive BP
measurement. Auscultation and oscillometry are the
two most widely used cuff-based ways to measure BP
noninvasively (Mukkamala et al., 2015). However,
they can provide only intermittent BP readings with
periodic cuff inflation and deflation. In particular,
cuffs are cumbersome, occlusive and time-consuming
to use, disruptive during ambulatory monitoring
(Josep et al., 2013; Peter, Noury, & Cerny, 2014).
Volume clamping and tonometry provide continuous
beat-to-beat BP monitoring. While they both require
relatively complex mechanical structures and are
highly sensitive to the sensor's position and precision
(Imholz, Wieling, van Montfrans, & Wesseling,
1998; Sato, Nishinaga, Kawamoto, Ozawa, &
Takatsuji, 1993).
According to the limitations, the estimation of BP
in successive cardiac cycles via pulse wave velocity
(PWV) or pulse transit time (PTT) has been
extensively proposed(Ding, Zhang, Liu, Dai, &
Tsang, 2016; Jernstedt & Newcomer, 1974; Mase,
Mattei, Cucino, Faes, & Nollo, 2011; Obrist et al.,
1978). The PTT is defined as the period spent by the
arterial pulse propagating from the heart to a
peripheral circulation and is indeed expected to be in
inverse relation with BP (Huynh, Jafari, & Chung,
2019; Josep et al., 2013; Mase et al., 2011).
Zhang, Y., Zhou, C., Huang, Z. and Ye, X.
Development of a Continuous Blood Pressure Monitoring System based on Pulse Transit Time and Hemodynamic Covariates.
DOI: 10.5220/0008944800330039
In Proceedings of the 13th International Joint Conference on Biomedical Engineering Systems and Technologies (BIOSTEC 2020) - Volume 1: BIODEVICES, pages 33-39
ISBN: 978-989-758-398-8; ISSN: 2184-4305
Copyright
c
2022 by SCITEPRESS – Science and Technology Publications, Lda. All rights reserved
33
Furthermore, many methods with additional
covariates (e.g. heart rate, pulse wave characteristic
parameters) have been recommended to improve the
precision of predicted BP (Cattivelli & Garudadri,
2009; Jadooei, Zaderykhin, & Shulgin, 2013; Lin et
al., 2015).
In our previous study, we proposed a BP model
based on PTT and other hemodynamic covariates
(Feng, Huang, Zhou, & Ye, 2018). We derived the
relationship between BP and PTT and presented an
improved method utilizing PTT, HR, stiffness index
(SIx) and descent time (DT) to prompt a better BP
estimation based on MIMIC database. The results
demonstrated that this method had the potential to
continuously track BP with higher accuracy and less
calibration frequency. While the limitation is that
model-based data mainly focus on the patient in the
intensive care unit, lacked the verification of healthy
individuals in the normal living and working
conditions.
In this paper, we introduced a reliable hardware
system to validate the blood pressure estimation
algorithms and models proposed in previous studies
from multiple data sets of healthy individuals. The
system was intended to detect both ECG and PPG
signals synchronously, which enabled continuous
cuff-less blood pressure evaluation. We established a
common model and studied the universal
applicability, expected to achieve a general
estimation of population blood pressure by only
changing the individual parameters of the model. In
particular, we investigated the accuracy and
reliability of long-term BP monitoring without
calibration by collecting data of a specific individual
for 28 days. Subsequently, we validated our approach
according to the AAMI standard.
2 MATERIALS AND METHODS
2.1 System Overview
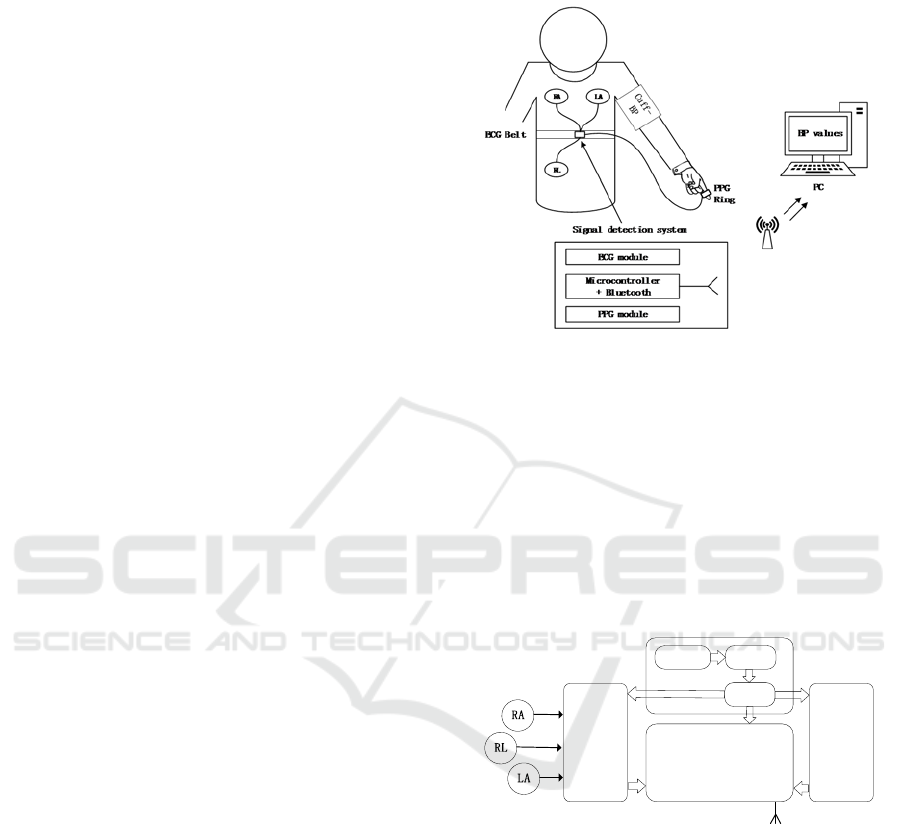
Figure 1 depicts a schematic view of the system
developed, including a wireless signal detection
system, a cuff blood pressure reference instrument
and a host computer (PC).
The signal detection system acts as a slave device
to synchronously collect ECG and PPG signals and
transmit data via Bluetooth; the PC acts as a host for
receiving data, performing signal processing and BP
calculations. To evaluate and calibrate our results, the
Omron-8713 electronic sphygmomanometer was
used to measure cuff blood pressure as a reference.
The developed device is about 4 cm long and 3.5 cm
wide, which was smaller than a typical prototype
(Austad et al., 2016; Kim et al., 2013).
Figure 1: System overview.
Figure 2 describes the block diagram of the signal
detection system, which involves an ECG module
(AD8232), a PPG module (MAX30102), a
microcontroller with Bluetooth combined (NRF52832)
and power management unit. The controller collects
the ECG data of the AD8232 at a sampling frequency
of 200 Hz and reads the PPG data of the IIC interface
at the same rate to guarantee time synchronization.
Figure 2: The block diagram of signal detection system.
The ECG module obtains the lead I configuration
ECG signal from the three electrodes (RA, LA, and
RL), and the electrode feeds the original signal into
the ECG analog acquisition front end through the lead
wire. A reflective optoelectronic sensor with
embedded red and infrared emitters and
phototransistors is used to acquire the PPG signal at
the fingertips. The microcontroller pre-processes and
transmits the two signals, and then the PC performs
filtering, feature extraction, and calculation of SBP
and DBP. In this study, PTT was calculated from the
peak of each R-wave in the ECG to the maximum
value of the PPG.
NRF52832
ADC
AD8232
IO
Electrode
MAX30102
IIC
IIC
Power management unit
Battery TPS737
3.3V
BIODEVICES 2020 - 13th International Conference on Biomedical Electronics and Devices
34
In our previous research, we found that discrete
systems bring some uncontrollable delays(Espina,
Falck, Muehlsteff, & Aubert, 2006). Since PTT is a
time-sensitive parameter, the delay will cause a
deviation in the blood pressure estimation. We use the
same one microcontroller to pick up ECG and PPG
signals (with Bluetooth device integrated inside the
microcontroller), which ensured synchronization.
2.2 BP Model Description
Our previous study has attempted to derive the
relationship between BP and PTT. This method has
been verified to perform better on the MIMIC
database than the two representative studies (Chen,
Kobayashi, Ichikawa, Takeuchi, & Togawa, 2000;
Poon & Zhang, 2005).
In addition to pulse wave transit time (PTT), the
BP model proposed in our previous studies introduces
some other hemodynamic parameters. Among
them, the heart rate (HR) is affected by the regulation
of baroreflex, the latter can adjust the short-term
regulation of BP and prevent wide fluctuations; the
stiffness index (SIx) exhibits the time interval from
the main wave peak to a later diastolic peak, indicates
the arterial stiffness; the descent time (DT) is
interpreted as the duration from the onset of the
dicrotic notch to the end of the diastole,which is
associated to the ventricular diastolic phase.
Figure 3: The BP modelling process.
The basic process of blood pressure modelling is
shown in Figure 3. We perform correlation analysis on
the standardized characteristic parameters and select
features according to the degree of relevance.
Afterward, features with high partial correlation were
selected for multiple linear regression to obtain the BP
model. Then, we established a regression equation
(Eqs.1 and Eqs.2) for SBP and DBP (Feng et al., 2018).
SBP
1
(1)
DBP
1
(2)
where a, b, c, and d are coefficients.
2.3 Experimental Protocols
A total of 22 healthy subjects (15 males and 7 females)
were recruited for a 4-week experiment, and data were
collected 1 to 3 times per day for each subject. The
subjects all aged between 22 and 50, with an average
age of 24. Participants were requested not to drink
alcoholic and caffeinated drinks for at least 4 hours
before the test. Measurements were carried out under
certain temperature (24 ℃ ~27 ℃ ) and humidity
conditions (50%~60%) compensated by air condition.
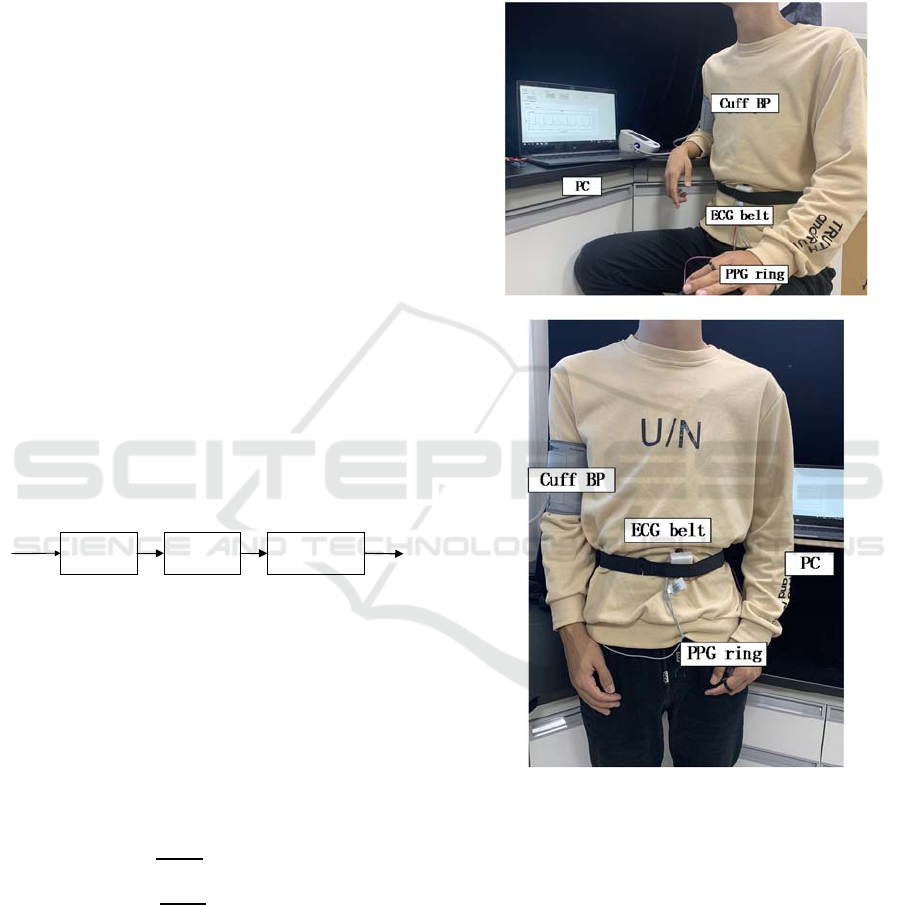
(a)
(b)
Figure 4: experimental set-up: sit position (a), stand
position (b).
The protocol involved tests in two postures:
sitting and standing; each data acquisition session
took 5 minutes. Specific steps of the protocol are
shown in Figure 4. Before starting the test, the
subjects were requested to rest for 5 minutes, and the
initial SBP1, DBP1, and HR1 were measured with an
Omron sphygmomanometer. Then, the ECG and PPG
signals were collected simultaneously for 2 minutes
using the developed monitoring system, and then
SBP2, DBP2, and HR2 were measured. The average
Correlat ion
analysis
Filter
features
Multiplelinear
regression
Features BPmo del
Development of a Continuous Blood Pressure Monitoring System based on Pulse Transit Time and Hemodynamic Covariates
35

of the two indications measured by Omron was taken
as the average blood pressure reference value within
2 minutes. After five minutes of rest, the above steps
were repeated in a standing position to obtain a 2
minute ECG, PPG signal and reference SBP, DBP,
HR. When measuring BP with Omron
sphygmomanometer, we ensure that the cuff is
always at the same level as the heart. If the current
two blood pressure values differ by >5 mmHg, the
blood pressure values are repeatedly measured after 2
minutes and the average of three measurements is
taken. Figure 5 shows the process.
Figure 5: experimental protocols.
2.4 Data Analysis
2.4.1 Preprocessing
To enhance processing efficiency, we separated the
raw signal into 30s segments. Since the original signal
has been preprocessed by the hardware system, we
used the wavelet transform to eliminate the residual
baseline drift and artifact on PC. It has been pointed
out that discrete wavelet decomposition provides
better phase response and computational
efficiency(Kachuee, Kiani, Mohammadzade, &
Shabany, 2017). The ECG and PPG segments were
decomposed into eight levels by the Daubechies db5
wavelet function, the fifth-order contour component
was removed from the ECG signal, while the seventh-
order contour component was removed from the PPG
signal, thereby selecting a suitable approximation
layer to reconstruct the signal.
2.4.2 Feature Extraction
Based on our previous research, we extracted the
parameters required for blood pressure modelling and
validated the proposed model. For the ECG signal, we
extract the R-peak of each cardiac cycle through the
sliding window and the dynamic adaptive threshold
and then calculated the HR from the adjacent R–R
interval.
The maximum value of the PPG waveform was
extracted as the pulse onset point in the same cardiac
cycle. Hence, PTT can be obtained by calculating the
time interval between the R peak of the ECG signal
and the corresponding feature point of the PPG signal.
Furthermore, we also extracted several
morphological parameters mentioned above and
normalized all features.
3 RESULTS
Based on the relationship among BP, PTT and
hemodynamic covariates obtained in our previous
studies, we have established systolic and diastolic
blood pressure models, respectively. We verified the
accuracy of the proposed BP model by comparing the
mean error and root-mean-square error between the
estimated BP value and the reference value of the
Omron sphygmomanometer. Ultimately, we assessed
the consistency of the two methods by Bland-Altman
analysis.
According to our experimental protocol, the
population universal model and the individual long-
term model were studied separately.
3.1 Universal BP Model
Data were collected for each individual for 1~3 times,
a total of 248 segments of data. During the experiment,
a total of 20 valid subjects and 180 data segments were
analyzed, while the signals of two subjects were
screened out for the low signal to noise ratio in the PPG
signals for a good estimation of PTT. Table 1
summarized the basic information about the subject.
Table 1: Subject statistics.
Subjects details
N
umber 22
Data sets 180 segments
Sex(m/f) 15/7
Age
Range: 22-50
mean+SD: 27.96+7.12
DBP mean+SD: 74.42+9.87
SBP mean+SD: 112.49+12.23
All valid data sets were divided into 10 parts by
using the method of 10-fold cross-validation, nine of
which were taken in turn as training data to establish
a BP model, and one was used as test data to estimate
the BP value. Then compared the value with reference
values measured by the Omron sphygmomanometer
to calculate errors. Table 2 shows the mean error and
root-mean-square of the results of the 10-fold cross-
validation. The average error was 0.002±8.544
mmHg for SBP, 0.005±6.690 mmHg for DBP, which
extremely approached the standard of AAMI (5±8
mmHg).
Start
Rest
Cuff
BP1
Stop
5min 1min
2min 1min 5min
1min
2min 1min
ECG,PPG-sit
(our system)
Cuff
BP2
Rest
Cuff
BP1
ECG,PPG-stand
(our system)
Cuff
BP2
Test1
Test2
BIODEVICES 2020 - 13th International Conference on Biomedical Electronics and Devices
36
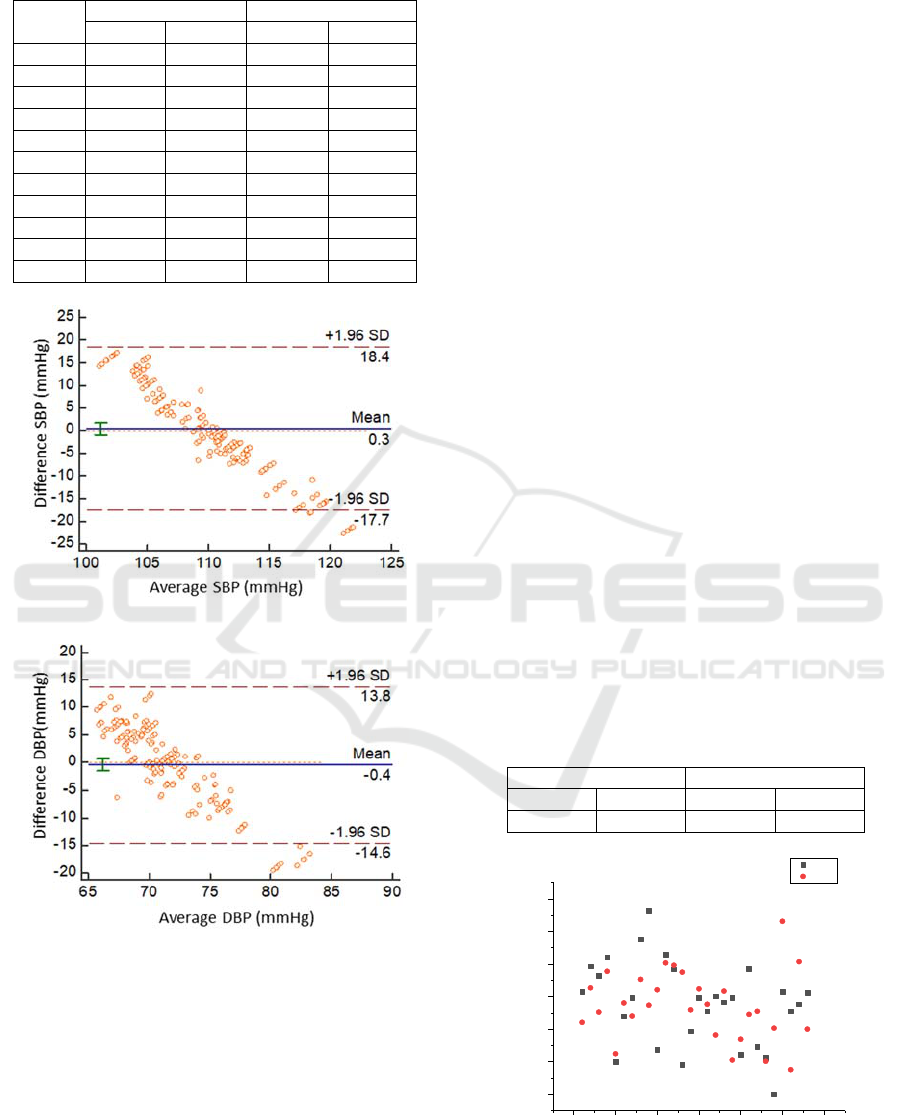
Table 2: The results of 10-fold cross-validation.
SBP (mmHg) DBP (mmHg)
mean std mean std
1 0.0397 8.6899 0.0184 6.8063
2 -0.0133 8.5496 0.0366 6.6011
3 -0.0124 8.4692 -0.0054 6.6397
4 0.0216 8.7775 -0.0118 6.8001
5 -0.0252 8.3874 -0.0110 6.6463
6 -0.0389 8.4475 -0.0215 6.6103
7 0.0223 8.4548 0.0180 6.5604
8 0.0012 8.5908 -0.0095 6.8713
9 -0.0021 8.4272 -0.0008 6.5995
10 0.0274 8.6498 0.0421 6.7686
Mean 0.0020 8.5444 0.0055 6.6904
(a)
(b)
Figure 6: Bland-Altman analysis of SBP(a), DBP(b)
estimation for universal BP model.
The Bland-Altman plot of the SBP and DBP
estimation for our proposed method versus Omron
sphygmomanometer are given in Fig. 6. The x-axis
presents the average of the two methods, while the y-
axis shows the difference between them.
We observed that a total of 97.8% of the SBP, and
95% of the DBP measurements lie in the limits of
agreement (1.96 SD), indicating that the estimated
BP with the proposed method is in close agreement
with the Omron sphygmomanometer.
3.2 Individual Long-term BP Model
To investigate the validity of the evaluation of a
particular subject's BP model over several
consecutive days, further studies were performed on
a selected subject. Regression models related to PTT,
hemodynamic parameters, and BP values (SBP, DBP)
were constructed by collecting data throughout one
day at various time intervals during the subject's
regular working hours. To demonstrate the accuracy
and reliability of the model in long-term continuous
monitoring scenarios, we compared the estimated BP
values with the Omron sphygmomanometer.
Measurements were performed at three different
times of the day (10:00 am, 3:00 pm, 7:00 pm) based
on fluctuations in blood pressure, and the experiment
lasted for one month(29 days).
A total of 683 segments of data were collected for
the same individual, excluding invalid data caused by
collection failure. The individual BP model was
created using 24 data sets on the first day, and the
remaining 27 days of data were used to test the model
to verify its long-term effectiveness. Similarly, we
compared the estimated 28-day blood pressure with
the Omron sphygmomanometer, and the mean and
RMS of the statistical errors were shown in Table 3.
The average error was 5.204±5.462 mmHg for SBP,
2.714 ± 4.756 mmHg for DBP, which extremely
approached the standard of AAMI (5±8 mmHg).
Table 3: Individual model error analysis.
SBP (mmHg) DBP (mmHg)
mean std mean std
5.2043 5.4624 2.7141 4.7561
Figure 7: RMSE of BP estimated with the proposed
measurement system with the reference system over 28
days for a subject.
0 5 10 15 20 25 30
1
2
3
4
5
6
7
DBP
SBP
RMSE(mmHg)
Day
Development of a Continuous Blood Pressure Monitoring System based on Pulse Transit Time and Hemodynamic Covariates
37
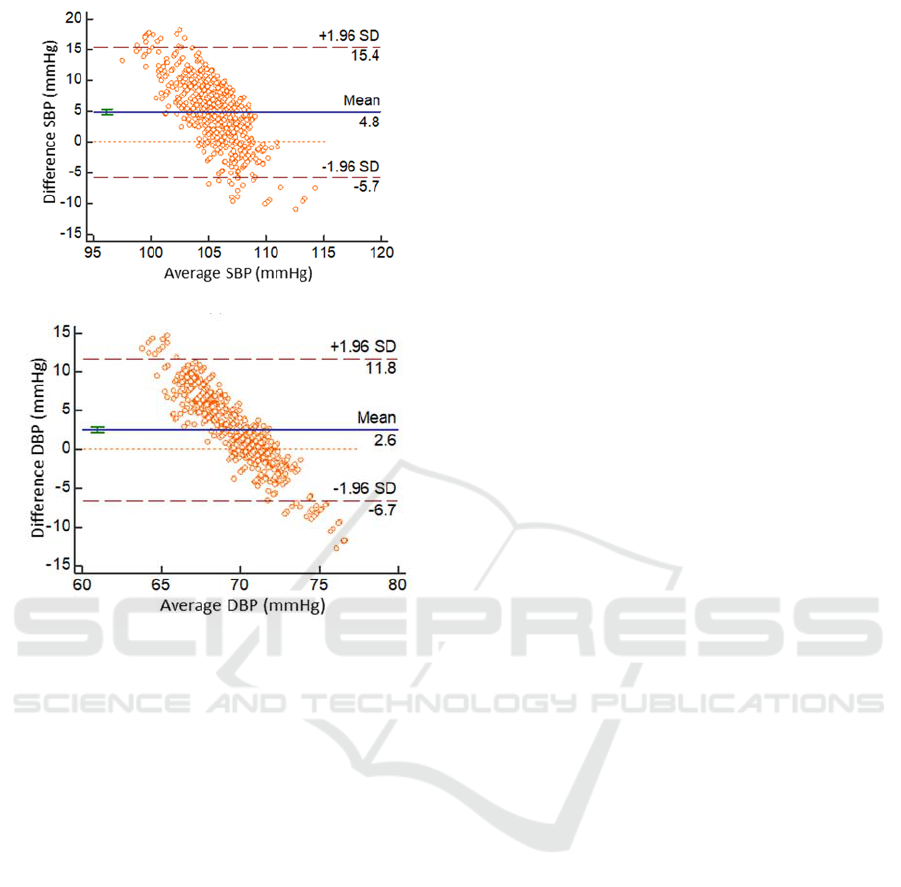
(a)
(b)
Figure 8: Bland-Altman analysis of SBP(a), DBP(b)
estimation for individual long-term BP model.
Figure 7 illustrates the observed trend of the
estimated RMSE of estimated versus reference BP
value. The proposed method can track BP values with
lower RMSE values in 28 days with an error within
an acceptable range. The Bland-Altman plot of the
SBP and DBP estimation for the individual long-term
model we proposed versus the Omron
sphygmomanometer are given in Figure 8, which
indicates that the two methods are in close agreement.
4 DISCUSSION
This study introduced a reliable hardware system to
verify the proposed models on normal subjects. The
system guarantees high quality and strict time
synchronization of the original signal, thus
eliminating errors caused by noise and uncontrolled
delays. Moreover, high-quality signals can improve
the accuracy of feature extraction, which in turn
contributes to the estimation of blood pressure models.
However, there are some limitations to our study.
First, we recruited healthy young and middle-aged
people who were at higher risk of cardiovascular
disease due to high mental stress and daily work
intensity. Despite this, we still need data from older
people or patients with cardiovascular disease to
support the model. Second, the range of BP
fluctuations in the experimental protocol is not
obvious enough. Different BP perturbations must be
applied to rigorously evaluate the validity of the
proposed model, such as exercise test, cold pressor
test.
5 CONCLUSIONS
In this paper, we proposed a wearable signal detection
system that can simultaneously acquire ECG and PPG
signals, ensuring signal integrity and reliability.
Subsequently, we built a generic BP model and an
individual long-term BP model to calculate SBP and
DBP values, then compared the two values with the
Omron sphygmomanometer, which showed a good
agreement. Further, the errors between Omron and
our system of the two models (generic SBP: 0.002±
8.544 mmHg, DBP: 0.005±6.690 mmHg; individual
SBP: 5.204 ± 5.462 mmHg, DBP: 2.714 ± 4.756
mmHg) are close to the AAMI standard(5±8 mmHg).
The results indicate that our system has the potential
to continuously track BP for a long time without
calibration. Nonetheless, more validation in various
subjects and situations should be conducted with the
system.
ACKNOWLEDGEMENTS
This work was supported by the National Key R&D
Program of China (No.2017YFF0210803), this
research was also funded by China Postdoctoral
Science Foundation (No.2018M632456) and the
Fundamental Research Funds for the Central
Universities (No.2019FZA5015).
REFERENCES
Austad, H. O., Vedum, J., Røed, M. H., Dalgard, S., et al.
(2016). An Unobtrusive Wearable Device for
Ambulatory Monitoring of Pulse Transit Time to
Estimate Central Blood Pressure. International Joint
Conference on Biomedical Engineering Systems and
Technologies, BIOSTEC 2016, 179-186.
BIODEVICES 2020 - 13th International Conference on Biomedical Electronics and Devices
38

Cattivelli, F. S., & Garudadri, H. (2009). Noninvasive
Cuffless Estimation of Blood Pressure from Pulse
Arrival Time and Heart Rate with Adaptive Calibration.
2009 Sixth International Workshop on Wearable and
Implantable Body Sensor Networks, 114-119.
Chen, W., Kobayashi, T., Ichikawa, S., Takeuchi, Y., &
Togawa, T. (2000). Continuous estimation of systolic
blood pressure using the pulse arrival time and
intermittent calibration. Medical & Biological
Engineering & Computing, 38(5), 569-574.
Ding, X. R., Zhang, Y. T., Liu, J., Dai, W. X., & Tsang, H.
K. (2016). Continuous Cuffless Blood Pressure
Estimation Using Pulse Transit Time and
Photoplethysmogram Intensity Ratio. IEEE Trans
Biomed Eng, 63(5), 964-972.
Espina, J., Falck, T., Muehlsteff, J., & Aubert, X. (2006).
Wireless Body Sensor Network for Continuous Cuff-
less Blood Pressure Monitoring. IEEE/EMBS
International Summer School on Medical Devices &
Biosensors.
Feng, J., Huang, Z., Zhou, C., & Ye, X. (2018). Study of
continuous blood pressure estimation based on pulse
transit time, heart rate and photoplethysmography-
derived hemodynamic covariates. Australas Phys Eng
Sci Med, 41(2), 403-413.
Fung, P., Dumont, G., Ries, C., Mott, C., & Ansermino, M.
(2005). Continuous noninvasive blood pressure
measurement by pulse transit time. International
Conference of the IEEE Engineering in Medicine &
Biology Society.
Huynh, T. H., Jafari, R., & Chung, W. Y. (2019).
Noninvasive Cuffless Blood Pressure Estimation Using
Pulse Transit Time and Impedance Plethysmography.
IEEE TRANSACTIONS ON BIOMEDICAL
ENGINEERING, 66(4), 967-976.
Imholz, B. P., Wieling, W., van Montfrans, G. A., &
Wesseling, K. H. (1998). Fifteen years experience with
finger arterial pressure monitoring: assessment of the
technology. Cardiovasc Res, 38(3), 605-616.
Jadooei, A., Zaderykhin, O., & Shulgin, V. I. (2013).
Adaptive algorithm for continuous monitoring of blood
pressure using a pulse transit time. Electronics &
Nanotechnology.
Jernstedt, G. C., & Newcomer, J. P. (1974). Blood-Pressure
and Pulse-Wave Velocity-Measurement for Operant-
Conditioning of Autonomic Responding. Behavior
Research Methods & Instrumentation, 6(4), 393-397.
Josep, S., Martin, P. A., Damien, F., Jacques-André, P., et
al. (2013). Noninvasive and Nonocclusive Blood
Pressure Estimation Via a Chest Sensor. 60(12), 3505-
3513.
Kachuee, M., Kiani, M. M., Mohammadzade, H., &
Shabany, M. (2017). Cuffless Blood Pressure
Estimation Algorithms for Continuous Health-Care
Monitoring. IEEE Trans Biomed Eng, 64(4), 859-869.
Kikuya, M., Hozawa, A., Ohokubo, T., Tsuji, I., et al.
(2000). Prognostic significance of blood pressure and
heart rate variabilities: the Ohasama study.
Hypertension, 36(5), 901-906.
Kim, H., Lee, H., Baek, H., Lee, W., et al. (2013). A
preliminary study of non-intrusive blood pressure
monitoring using portable device. International
Conference on Biomedical Electronics and Devices,
BIODEVICES 2013, 163-167.
Lin, H., Xu, W. Y., Guan, N., Ji, D., et al. (2015).
Noninvasive and Continuous Blood Pressure
Monitoring Using Wearable Body Sensor Networks.
IEEE Intelligent Systems, 30(6), 38-48.
Mase, M., Mattei, W., Cucino, R., Faes, L., & Nollo, G.
(2011). Feasibility of cuff-free measurement of systolic
and diastolic arterial blood pressure. J Electrocardiol,
44(2), 201-207.
Mukkamala, R., Hahn, J. O., Inan, O., Mestha, L., et al.
(2015). Towards Ubiquitous Blood Pressure
Monitoring via Pulse Transit Time: Theory and
Practice. 62(8), 1879-1901.
Obrist, P. A., Light, K. C., Mccubbin, J. A., Hutcheson, J.
S., et al. (1978). Pulse transit time: Relationship to
blood pressure. 10(5), 623-626.
Peter, L., Noury, N., & Cerny, M. (2014). A review of
methods for non-invasive and continuous blood
pressure monitoring: Pulse transit time method is
promising? IRBM, 35(5), 271-282.
Poon, C. C., & Zhang, Y. T. (2005). Cuff-less and
noninvasive measurements of arterial blood pressure by
pulse transit time. Conf Proc IEEE Eng Med Biol Soc,
6, 5877-5880.
Sato, T., Nishinaga, M., Kawamoto, A., Ozawa, T., &
Takatsuji, H. (1993). Accuracy of a continuous blood
pressure monitor based on arterial tonometry.
Hypertension, 21(6 Pt 1), 866-874.
Development of a Continuous Blood Pressure Monitoring System based on Pulse Transit Time and Hemodynamic Covariates
39
