
Robustness Improvement in Optical Deformation Analysis by
Matching a Motion Field to Stress Imposed on a Surface
Jun Takada
*
and Masahiko Ohta
*
NEC Corporation, 1753, Shimonumabe, Nakahara-ku, Kawasaki-shi, Kanagawa 211-8666, Japan
Keywords: Motion Field, Deformation Analysis, Non-destructive Testing, Crack Opening Displacement.
Abstract: A denoizing and compression method for motion field data is proposed to improve the robustness and
efficiency of optical deformation analysis. The proposed method estimates stress change over time imposed
on a captured surface based on displacements and strains derived from motion fields obtained by optical flow.
The method then finds the best least squares approximation of the motion components due to the stress time
series from the motion time series at each coordinate. This process decomposes motion fields into stress and
response vectors while removing disturbances. Experimental results confirm that the proposed method
significantly reduces noise in visualizing crack opening displacements on a bridge beam under traffic loads,
as well as the size of the motion field data.
1 INTRODUCTION
In recent decades, ensuring safety of aging civil
structures in many developed countries has become
an important global issue. However, performing
frequent contact inspections of such structures is
difficult; therefore, various technologies have been
developed to support remote and automatic
inspection and assessment. There are many types of
structural properties that can be evaluated remotely,
such as surface crack densities, temperatures, and
dynamic behaviors (e.g., bridge deflections). Fatigue
crack density is one of the most popular statistics used
to assess concrete structures. Generally, fatigue
cracks form and propagate owing to repeated cyclic
loading on structures. Once the fatigue cracks reach
steel wires inside the reinforced concrete, moisture
penetration induces steel wire corrosion, which
decreases structural strength significantly. Therefore,
the early detection and limited repair of such cracks
are important for safety and economic reasons.
Traditionally, many automatic crack detection
methods involving high-resolution digital imaging
have been developed for this purpose. However,
many of these methods attempt to detect cracks from
a single image; thus, they cannot instantly determine
whether a crack is propagating, and they cannot
suggest information about a crack’s depth.
*
https://www.nec.com/
Therefore, approaches based on video analysis
have emerged recently. Video analysis-based
methods measure and visualize the dynamic behavior
of cracks. In the material and structural mechanics
field propagating cracks demonstrate an opening and
closing motion under dynamic loading on structures,
and deeper cracks show larger motions. These video-
based methods attempt to measure such minute crack
motions using video analysis techniques to produce
information about crack progression risks.
Nevertheless, many of those are only used in indoor
experiments and suffer robustness difficulties in real
outdoor environments. In addition, video data of the
entire structure are too large to handle at reasonable
cost.
Therefore, in this paper, we propose an efficient
denoizing and compression method for the motion
field of stress-imposed structure surfaces so that
motion-based crack severity assessment methods can
be used to evaluate real outdoor structures.
2 RELATED WORK
2.1 Still Image-based Approaches
Many conventional crack assessment methods that
attempt to find cracks from a single image based on
Takada, J. and Ohta, M.
Robustness Improvement in Optical Deformation Analysis by Matching a Motion Field to Stress Imposed on a Surface.
DOI: 10.5220/0008944007670774
In Proceedings of the 15th International Joint Conference on Computer Vision, Imaging and Computer Graphics Theory and Applications (VISIGRAPP 2020) - Volume 4: VISAPP, pages
767-774
ISBN: 978-989-758-402-2; ISSN: 2184-4321
Copyright
c
2022 by SCITEPRESS – Science and Technology Publications, Lda. All rights reserved
767

the characteristic texture appearance along cracks
have been described in literature. A survey on the
recent image-based crack assessment methods for
concrete- and asphalt-based civil infrastructure (Koch
et al., 2015) has introduced various methods for this
approach, e.g., wavelet-based (P. Kohut, 2012) and
SVM classifier-based (Liu et al., 2002) methods.
This approach generally assumes that all cracks
are visible in a single image and attempts to assess
crack severity using static information, e.g., crack
length, width, and density. However, depending on
illumination or imposed stress conditions, cracks are
often invisible in the early stage of propagation. In
addition, crack propagating risks often appear in
dynamic behaviors. For example, crack opening
motions imply stress transmission to the crack, which
relates to future propagating risk. The expansion of
opening motion implies deeper crack propagation,
which causes damage risks to steel wires. Therefore,
still image-based methods can miss risk information
about crack indication and propagation.
2.2 Motion-based Approaches
Video-based methods have emerged to compensate
the shortcomings of the still image-based approach.
The basic idea is to use the motion field around cracks
as additional information for assessment. Digital
image correlation (DIC) and optical flow are often
used to obtain the motion field. Most structure
surfaces, e.g., concrete, have natural textures; thus, a
pixel-wise motion field can be acquired easily using
such image tracking methods.
For example, a defect classification method based
on surface motion patterns has been proposed (Imai,
2016). First, this method estimates out-of-plane
global motions from the motion field, and then it
extracts in-plane stress field information from the
motion field by subtracting an apparent motion vector
component due to global motion. Experimental
results obtained on stress-imposed soft materials
demonstrate the possibilities of classifying internal
defects (e.g., cracks, peeling, and cavities) from stress
field patterns.
Another experimental study applied this type of
method to real outdoor bridges (Imai, 2017). To
evaluate accuracy, crack opening displacements by
DIC were compared using a clip-on gauge sensor.
The results indicate they have similar variation ranges
but different graph shapes in displacement time
series.
Pixel-wise motion vectors tend to be less accurate
than pixel intensities; thus, many postprocessing
methods have been developed. For example, a spatial-
temporal nonlinear filtering method combined with
conditional random fields has been proposed
(Chaudhury, 2017). The results of indoor experiments
with concrete material demonstrate improved crack
detection accuracy, particularly in the early stages
where cracks are not yet visible without imposed
stress.
Motion-based methods have high potential to
provide additional information about crack severity
compared to still image-based methods. However,
many such motion-based methods remain limited to
laboratory investigations and are not yet feasible for
real outdoor environments, primarily due to their
insufficient accuracy. The difficulties in measuring
real outdoor structure motions compared to indoor
experiments are assumed to be smaller material
deformation due to its solidity, smaller apparent
displacements due to far shooting distance, and
undesired apparent displacements caused by heat
haze.
In addition, the data size problem will arise in
practical applications. For example, 4K (3840x2160)
video at 60 fps with an 8-bit pixel value consumes 498
MB/s of bandwidth and storage. In addition, video
compression techniques, e.g., H.265/HEVC, cause
compression noise, which reduces motion accuracy;
thus, this trade-off should be considered carefully.
Note that the size of motion field data will become
even larger. If in-plane displacements are represented
as two 32-bit values, the output data bandwidth
increases to 3981 MB/s. Most video compression
formats do not support such pixel formats, e.g., 32-bit
floating point; thus, efficient compression will
become even more difficult. Simply scaling down the
spatial resolutions of the result vectors can be a
solution; however, even with 16 × 16 downscaling,
15.6 MB/s of data will be produced, which is still
impractical for outdoor use.
2.3 Thermographic Approach
A thermoelastic stress analysis method has been
proposed to detect and assess cracks remotely. Here,
the basic idea is to capture minute temperature shifts
induced by stress using an infrared thermography
video camera. Such temperature shifts occur around
crack tips; thus, this method is expected to be suitable
for detecting micro cracks in the early initiation
stages or those with future propagating risks.
However, the temperature shift induced by stress
is generally too small to be identified clearly in
thermal images, particularly in outdoor
environments. To reduce noises in thermal images,
VISAPP 2020 - 15th International Conference on Computer Vision Theory and Applications
768
the self-reference lock-in thermography technique
has been developed (Sakagami, 2016).
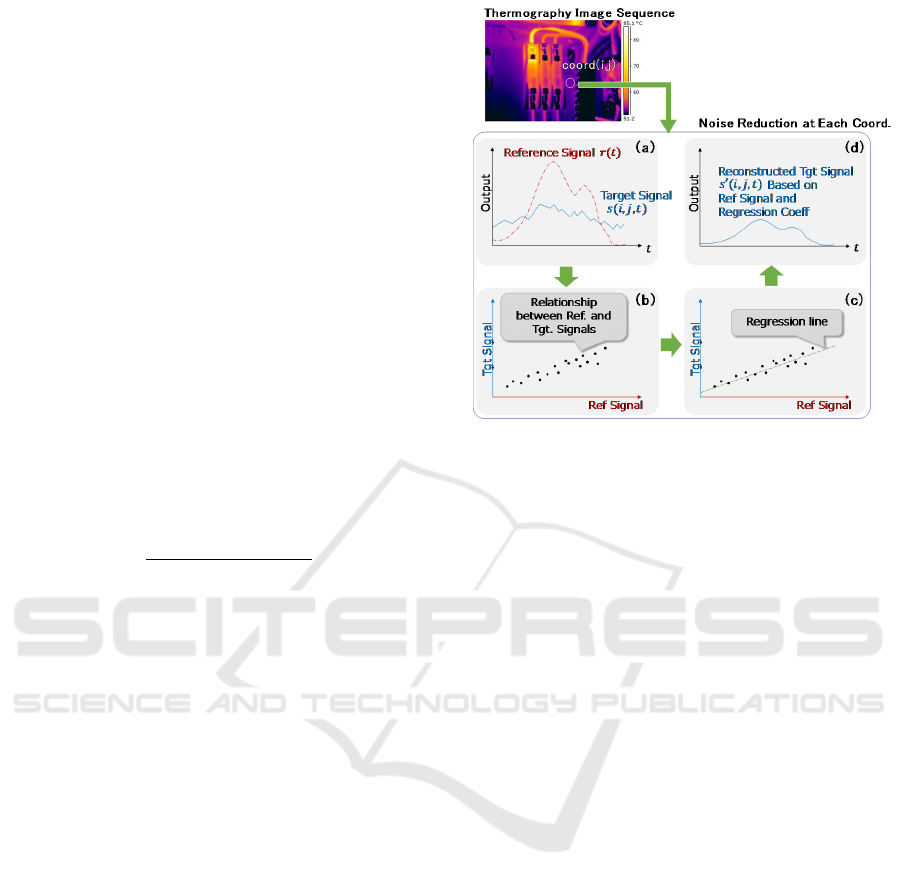
Figure 1 shows an outline of the self-reference
lock-in thermography method. In this case, we show
the noise reduction process for input signals
,,
based on predetermined reference signals
, where
and are the spatial coordinates in the image, and
is a frame number.
a) Reference signal time series
are selected out
of
,,
at an arbitrary position that gives
relatively large temperature change caused by
stress, e.g., near crack tips. The method then
extracts
,,
for each spatial coordinate
,
.
b) The method forms the relationship between
and
,,
at the coordinate.
c) The method uses the regression model
,,
,
∙
, at each
coordinate
,
. Here,
represents
,
represents
,,
, and f represents the number
of data for convenience. Then, regression
coefficient
,
is expressed as follows.
,
∑
∑
∑
∑
∑
(1
)
d) Finally, the method derives the denoized signal
time series
,,
at the coordinate as follows.
′
,
,
,
∙
(2
)
By applying the above process to each coordinate,
components that correlate with
are extracted
from
,,
, and uncorrelated components are
removed as noise. This method is suitable for real
structures, e.g., bridges, because the process works
without additional information for shaping signals. In
contrast, traditional lock-in methods require a known
reference signal pattern, e.g., periodical thermal
emission. The experimental results in the literature
demonstrate that self-reference lock-in thermography
method can clearly visualize temperature shift at
crack tips on real steel bridges under load.
However, this method faces some difficulties
relative to wide-scale deployment. For example, it
requires costly equipment, such as cooled
thermography cameras, and manual specification of
the reference point. In many cases, we cannot know
the crack tip position in advance; thus, manually
selecting an appropriate position is unrealistic in
practical applications.
Figure 1: Self-reference lock-in thermography method.
3 PROPOSED METHOD
3.1 Noise Reduction
Inspired by self-reference lock-in thermography, we
have developed a new denoizing method for a motion
field (Figure 2). First, the proposed method estimates
the stress change imposed on the captured plane for
each frame based on the global 3D motion and 2D
deformation motion of the plane. Then, the proposed
method applies a lock-in calculation to the
deformation vector for each coordinate using the
stress change time series as reference signals.
To estimate the stress change from motion
vectors, we propose two derivation methods. Unlike
self-reference lock-in thermography, deformation
vector time series at one representative coordinate
will not correspond directly to the imposed stress. The
simplest way to estimate stress on the surface is to
reference a global motion component for the normal
direction of the plane. In a bridge application,
essentially, the motion of deflection is assumed to be
proportional to the amount of external force imposed.
However, this component does not always accurately
match the surface stress due to various factors, e.g.,
structural mechanics and camera self-vibration.
Therefore, we also propose to derive the imposed
stress based on the surface strain. Figure 3 shows the
derivation process.
Robustness Improvement in Optical Deformation Analysis by Matching a Motion Field to Stress Imposed on a Surface
769
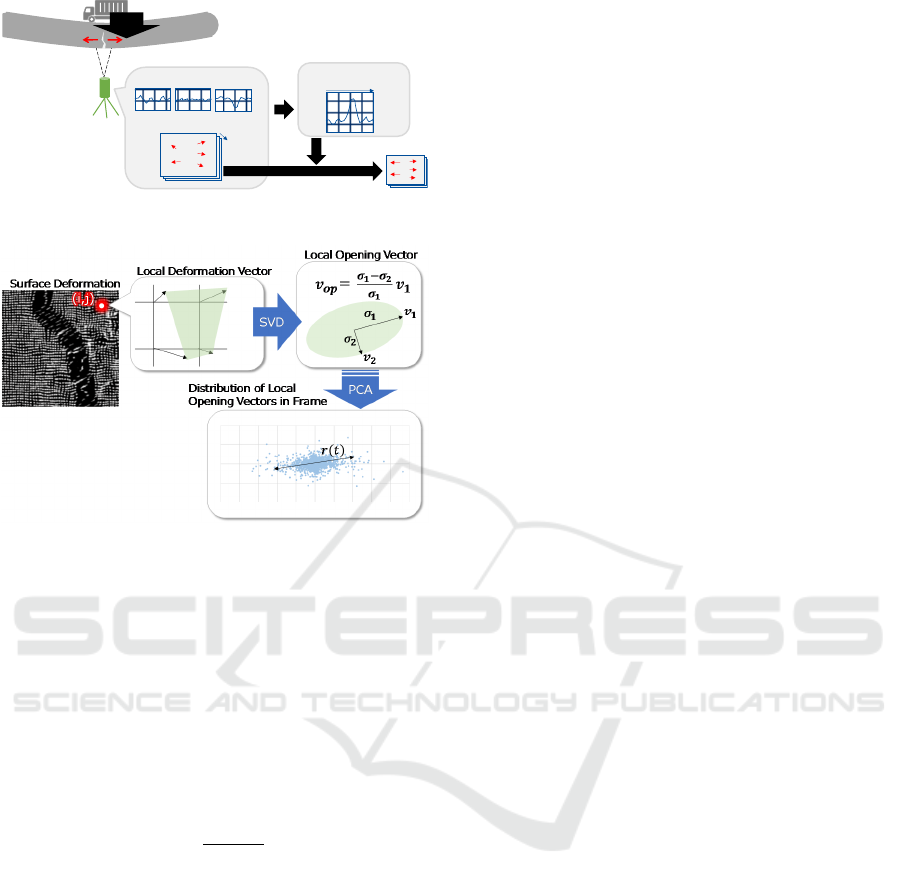
Figure 2: Outline of the proposed method.
Figure 3: Reference signal generation by strain.
1. The process first extracts local deformation
vectors for each coordinate, which are
calculated as the differences of adjacent vectors.
2. The process then applies singular value
decomposition to the local deformation vectors
and derives singular values (
,
:
) and
singular vector
|
|
1 , which
corresponds to
. With the values
,
, and
, the local opening vectors
,, are
derived as follows.
,
,
(3)
3. Finally, the process applies principal component
analysis to the local opening vectors
,,
in frame to acquire reference signal
as the
square root of the eigenvalue of the first main
component. When greater stress is imposed, the
opening vectors will vary along one direction
(e.g., the beam tensile direction); thus, the stress
reflects the reference signal
.
3.2 Compression
With the proposed method, all denoized motion
vectors
,,
can be reconstructed from
,
and
, as shown in Equation (2). This means that
motion field ′ can be decomposed into the
regression coefficients and reference signal time
series , as shown in Equation (4), where is the
number of pixels in each frame, and is the number
of frames.
′
′
′
⋯′
⋮⋱⋮
′
⋯′
,
⋯
,
⋯
(4)
This decomposition process drastically reduces
the number of coefficients to be handled. Here, is
derived for the x- and y-axes, each coefficient is
represented as a 32-bit floating-point value, and the
data are coded using (6432) bits, which means
that motion fields for a 4K resolution video sequence
can be coded with 66 MB of data. With downscaling
to 16 × 16, the data are compressed to 259 kB, which
is sufficient for practical outdoor application.
In addition, if further compression is required,
image and audio compression formats that support
floating-point values, e.g., JPEG-XR and MPEG4-
ALS, can be applied.
4 EVALUATION
4.1 Implementation
We implemented the motion estimation process
shown in Figure 4. First, users are requested to set up
optical parameters, such as shooting distance, lens
focal length, sensor resolution, pixel pitch on sensor,
and frame rate. Then, the system captures the target
surface and estimates the global 3D motion of the
plane against a predetermined reference frame in the
sequence. The estimated global motion is converted
to a physical scale based on the optical parameters.
The system also estimates the pixel-wise motion from
the captured video. By subtracting the apparent vector
components due to the global motion from the pixel-
wise motion, the system finally acquires 2D in-plane
displacements, which represent surface deformation.
Incidentally, minute self-motions of the camera are
removed in the final process.
We implemented a region-based matching
algorithm (Shimizu, 2004) for global 3D motion
estimation and dense optical flow (Brox, 2004) for
pixel-wise motion estimation with exhaustive
optimization for both Intel and nVidia architectures.
Typical processing times for a 4112x3008 pixel frame
are shown in Table 1.
In-plane 2D Motion
3D Motion of Whole Plane
Stress Change
on Surface
Est.
Lock-in
t
Load
Monocular
Videocam
t
Img based Motion Retrieval
VISAPP 2020 - 15th International Conference on Computer Vision Theory and Applications
770
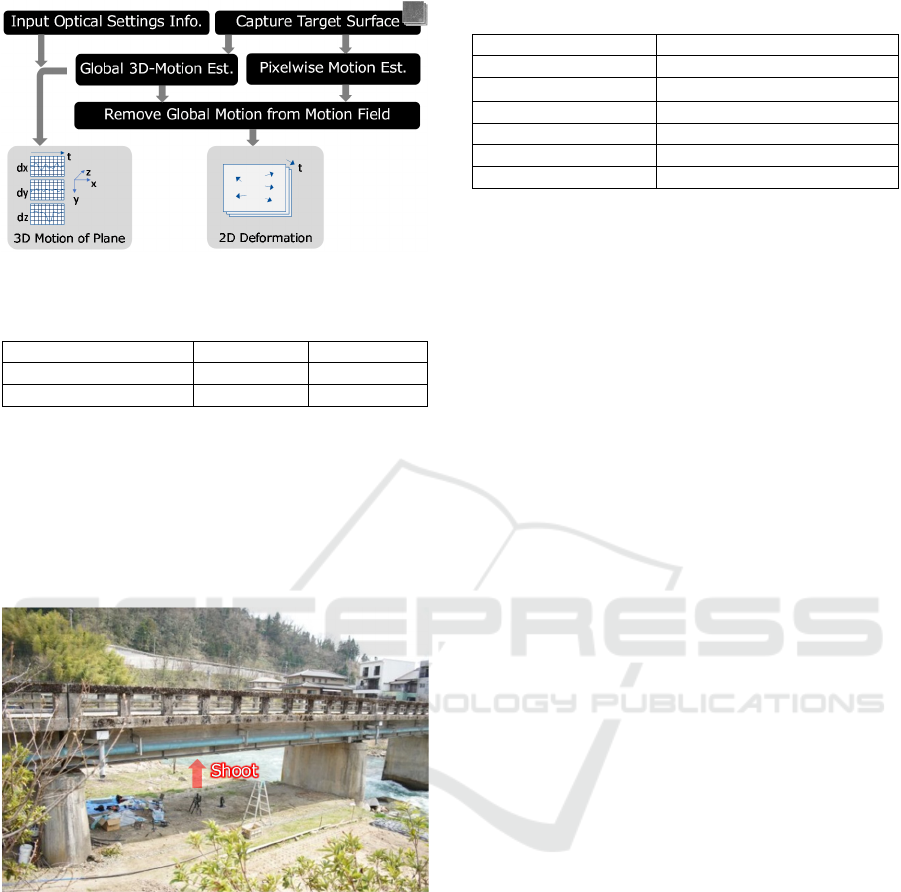
Figure 4: Outline of motion estimation process.
Table 1: Typical processing time per frame [ms].
i7-8086k GTX1080ti
Global 3D motion 20 6
Pixel-wise motion 120 9
4.2 Experimental Setup
To evaluate crack opening displacement accuracy, we
conducted a dynamic loading test with a heavy
vehicle on a real bridge with reinforced concrete (RC)
beams in Japan (Figure 5) using a contact type crack
gauge sensor for reference.
Figure 5: Overview of experimental field.
Table 2 summarizes the experimental
configuration. The crack gauge was installed
beforehand at a known crack on the bottom side of the
RC beam. The monocular camera was fixed to a
tripod on the ground just below the crack to shoot the
surface perpendicularly. Here, we used two lenses
(i.e., 75 and 180 mm) to examine reproducibility. The
gauge and camera could not be synchronized
electrically; thus, we performed manual adjustments
based on the maximum value of each measurement.
We also measured the deflection of the beam using a
laser range finder with 0.5-mm repeatability for
reference.
Table 2: Experimental configuration.
Camera MC124MG-SY (+Tripod)
Pixel Resolution 4112 x 3008
Pixel Pitch on Sensor
3.45
μm
Lens Focal Length 75mm / 180mm
Shooting Speed 25fps
Shooting Distance 2.70m
Loading Weight 20t (178kN)
The crack opening displacements were measured
by the motion difference between two reference
points located across the crack. For performance
comparison, four motion denoizing methods were
tested. For each method, we visualized strain maps,
which show the local strain on each coordinate
derived as the larger singular value decomposed from
the local deformation.
4.3 Results
Figure 6 shows a 75-mm shot image with the ground
truth crack position and global 3D motion time series
estimated by image. We performed motion estimation
for the region in the rectangle (Figure 7) to exclude
objects other than the concrete surface. The crack
gauge sensor was set to measure the crack on the right
side of the image, and the two reference points for the
image-based crack opening measurement were set to
A and B.
The global motion graphs show deflection (depth
in the image), bridge axial motion (horizontal in the
image), and bridge-axis perpendicular motion
(vertical in the image). The deflection graph shows
the time series of the bridge beam bending while the
vehicle passed, with a maximum deflection of
approximately 800 μm.
Figure 7 shows the time series of the crack
opening displacement and strain maps for a 75-mm
shot with each denoizing method. From top to
bottom, measured time series compared with the
crack gauge sensor, strain map at the time-stamp of
0.0, 4.5, 5.0, 5.8, and 7.0 s in the video sequence.
From left to right, no lock-in, lock-in with horizontal
displacement at reference point A, lock-in with strain,
and lock-in with deflection are shown.
The results of strain and deflection-based lock-in
demonstrate significant improvements in graph shape
and crack visibilities compared to the other methods.
The graph of deflection-based lock-in shows slightly
better matches with the crack gauge sensor than the
strain-based one. The raw result appears noisy, and
locking-in with the motion near crack does not look
effective to improve graph shape nor crack visibility.
Robustness Improvement in Optical Deformation Analysis by Matching a Motion Field to Stress Imposed on a Surface
771
Figure 6: 75-mm shot image and global motion estimation results by region-based matching.
Figure 7: Crack opening displacements and strains measured and visualized by each method for 75-mm shot.
Figure 8 shows a 180-mm shot image with the
ground truth crack position and global 3D motion
time series estimated by image. Figure 9 shows the
time series of the crack opening displacement and
strain maps for the 180-mm shot with each denoizing
method. Compared to the 75-mm shot, the
implications of the results are similar, with slight
improvement in most of the graph shapes and strain
images, which is likely due to the substantially higher
resolution of the input images. Nevertheless, the raw
results still contain noise, which implies that simply
upscaling image resolution cannot solve the outdoor
noise problem.
Table 3 shows quantitative evaluation results
comparing the value of the crack gauge sensor and
image-based measurement of each method in root
mean square error (RMSE). As can be seen,
deflection-based lock-in demonstrates the best
performance among the tested algorithms. Strain-
based lock-in gives a value that is close to that
obtained by the deflection-based method; thus, the
strain-based method can be an alternative if deflection
‐1000
‐800
‐600
‐400
‐200
0
200
0510
‐100
‐50
0
50
100
150
200
0510
BridgeAxis
MotionAnalysisArea
CrackGauge
Crack
A
B
374mm
511mm
[μm]
[s]
Bridge-axis perpendicular
Deflection
Bridge-axial
[μm]
Laser range finder
[s]
VISAPP 2020 - 15th International Conference on Computer Vision Theory and Applications
772
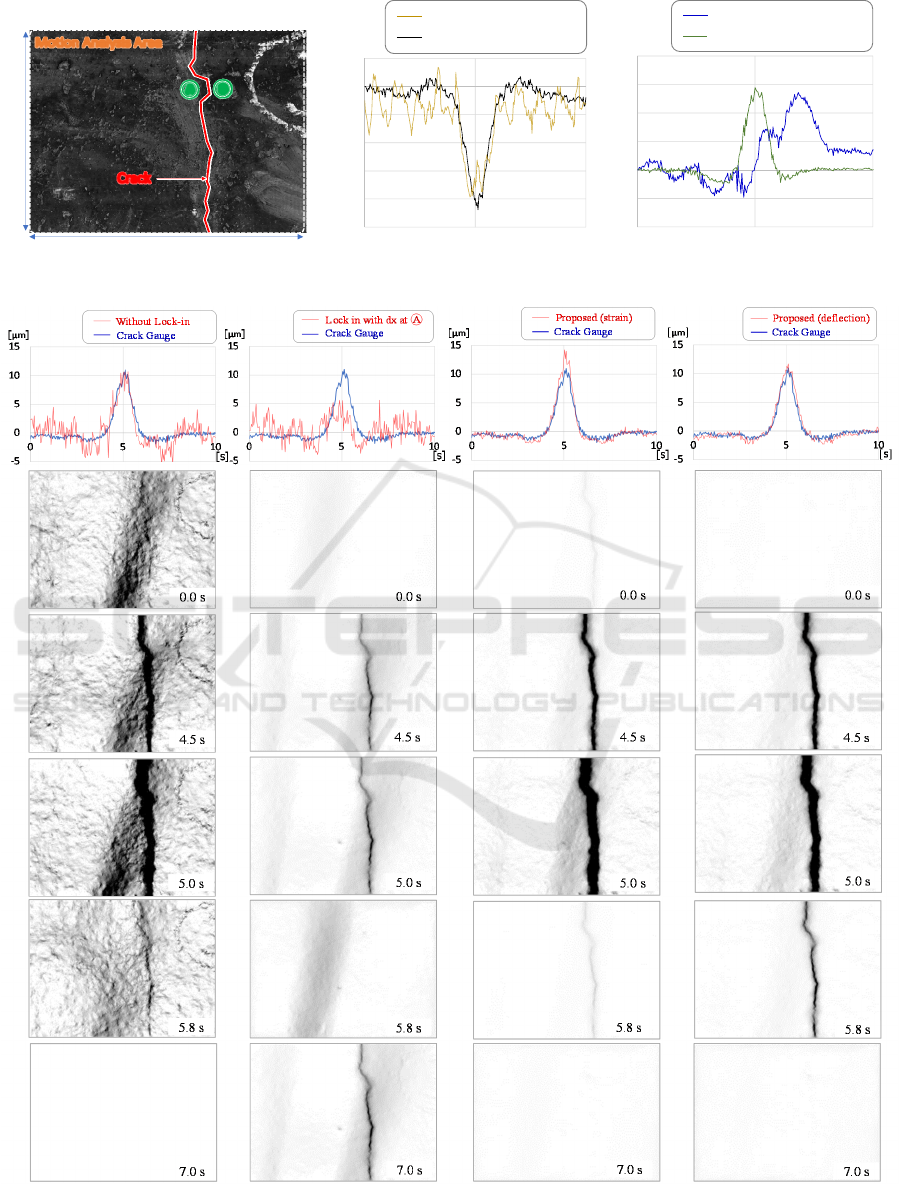
Figure 8: 180-mm shot image and global motion estimation results by region-based matching.
Figure 9: Crack opening displacements and strains measured and visualized by each method for 180-mm shot.
‐1000
‐800
‐600
‐400
‐200
0
200
0510
‐100
‐50
0
50
100
150
200
0510
MotionAnalysisArea
Crack
A
B
156mm
213mm
BridgeAxis
[μm]
[s]
[s]
Bridge-axis perpendicular
Deflection
Bridge-axial
[μm]
Laser range finder
Robustness Improvement in Optical Deformation Analysis by Matching a Motion Field to Stress Imposed on a Surface
773

is unreliable as a stress index due to structural or
shooting conditions.
Finally, with lock-in applied, the data size of the
motion fields at one shot area was reduced to 446 kB
for the 4112x3008 pixel frame with 16 × 16
downscaling, including various metadata, e.g.,
shooting conditions.
Table 3: RMSE between crack gauge values and crack
opening displacements measured by each method for 75-
mm and 180-mm shots.
Method 75mm 180mm
Raw output (without lock-in) 1.87 1.78
Lock-in with motion near crack 2.88 2.64
Lock-in with strain 1.01 0.82
Lock-in with deflection 0.58 0.69
5 CONCLUSIONS
We have proposed a denoizing and compression
method for the motion field of stress-imposed
surfaces. Experimental results confirmed that the
proposed method significantly reduces the noise and
data size of a motion field acquired in outdoor
environments. This method decomposes the motion
field into a stress time series and response map under
certain stress on the surface while removing
disturbances. Related studies have demonstrated the
possibility of classifying internal defects using stress
field patterns; thus, this response map will help
identify internal defects. Furthermore, this
representation reduces dataset dimensionality;
therefore, it will facilitate the application of learning-
based pattern recognition methods to defect
classification. In future, we plan to further extend
motion-based structure assessment based on the
proposed method.
ACKNOWLEDGMENTS
We are grateful to Research Association for
Infrastructure Monitoring System
1
for sharing the
concrete crack dataset. This work was partly
supported by Strategic Innovation Promotion
Program (SIP), a Japanese project led by the Cabinet
Office’s Council for Science, Technology and
Innovation.
1
http://www.raims.or.jp/en/
REFERENCES
C. Koch, K. Georgieva, V. Kasireddy, B. Akinci, and P.
Fieguth, 2015. A review on computer vision based
defect detection and condition assessment of concrete
and asphalt civil infrastructure. Advanced Engineering
Informatics, 29(2):196–210.
P. Kohut, K. Holak and T. Uhl, 2012. Monitoring of civil
engineering structures supported by vision system,
European Workshop on Structural health monitoring,
1575-1582.
Z. Liu, S. Azmin, T. Ohashi and T. Ejima, 2002. Tunnel
crack detection and classification systems based on
image processing, Society of Photo-Optical
Instrumentation Engineers (SPIE) Conference Series,
4664, 145–152.
M. Imai, M. Ohta, K. Tsuyuki, H. Imai, S. Miura, K. Murata
and J. Takada, 2017. Video image-based dynamic
behavior analysis of concrete structures by using digital
image correlation method, JofJSCE 2017, 5(1), 246-
251.
S. Chaudhury, G. Nakano, J. Takada and A. Iketani, 2017.
Spatial-temporal motion field analysis for pixelwise
crack detection on concrete surfaces, WACV 2017.
336-344.
H. Imai, M. Ohta and K. Murata, 2016. Structural internal
deterioration detection with motion vector field image
analysis using monocular camera, EI 2016, 3DIPM-
410.
T. Sakagami, Y. Izumi, D. Shiozawa, T. Fujimoto, Y.
Mizokami and T. Hanai, 2016. Nondestructive
Evaluation of Fatigue Cracks in Steel Bridges Based on
Thermoelastic Stress Measurement, Procedia Structural
Integrity Vol.2, pp. 2132-2139.
M. Shimizu, T. Yano and M. Okutomi, 2004, Precise
simultaneous estimation of image deformation
parameters, CVPR 2004, 2, 954-961.
T. Brox, A. Bruhn, N. Papenberg and J. Weickert, 2004.
High-accuracy optical flow estimation based on a
theory for warping, ECCV 2004. LNCS, 3021, 25-36,
Springer, Heidelberg (2004).
VISAPP 2020 - 15th International Conference on Computer Vision Theory and Applications
774
