
Supervised Machine Learning and Feature Selection for a Document
Analysis Application
James Pope
1 a
, Daniel Powers
1
, J. A. (Jim) Connell
1
, Milad Jasemi
1
, David Taylor
2
and Xenofon Fafoutis
3
1
Stephens College of Business, University of Montevallo, U.S.A.
2
University of Memphis, U.S.A.
3
DTU Compute, Technical University of Denmark, Denmark
Keywords:
Document Analysis, Supervised Machine Learning, Feature Selection, Optical Character Recognition.
Abstract:
Over the past three decades large amounts of information have been converted to image formats from paper
documents. Though in digital form, extracting the information, usually textual, from these documents requires
complex image processing and optical character recognition techniques. The processing pipeline from the
image to information typically includes an orientation correction task, document identification task, and text
analysis task. When there are many document variants the tasks become difficult requiring complex sub-
analysis for each variant and quickly exceeds human capability. In this work, we demonstrate a document
analysis application with the orientation correction and document identification task carried out by supervised
machine learning techniques for a large, international airline. The documents have been amassed over forty
years with numerous variants and are mostly black and white, typically consist of text and lines, and some
have extensive noise. Low level symbols are extracted from the raw images and separated into partitions. The
partitions are used to generate statistical features which are then used to train the classifiers. We compare the
classifiers for each task (e.g. decision tree, support vector machine, and random forest) to choose the most
appropriate. We also perform feature selection to reduce the complexity of the document type classifiers.
These parsimonious models result in comparable accuracy with 80% or fewer features.
1 INTRODUCTION
Automatically identifying text in images has enabled
the extraction of knowledge from vast amounts of ex-
isting data. Optical Character Recognition (OCR) en-
gines, trained for different languages, routinely recog-
nise text in provided image files with remarkable ac-
curacy (Ye and Doermann, 2015). However, these
OCR engines typically assume the images to have
low noise, correctly oriented, and minimal skew. Re-
search continues to ensure the highest accuracy in ex-
tracting text from images, specifically in image pre-
processing techniques.
In this paper we examine a specific text min-
ing application for a large, international airline com-
pany that has amassed hundreds of thousands of
maintenance work order documents since the 1980’s.
Internally the airline currently maintains electronic
records, however, many maintenance tasks are car-
a
https://orcid.org/0000-0003-2656-363X
ried out by various suppliers and original component
manufacturers. There are efforts to standardise elec-
tronic exchange between airlines and suppliers, how-
ever, many still use physical documents to inform the
airline of the maintenance performed on the compo-
nent. These physical documents have been converted
to electronic images using less than optimal scanners.
Even as suppliers upgrade to electronic exchange, a
vast amount of the maintenance history of the compo-
nents in operational planes remains electronically in-
accessible requiring tedious manual labour to acquire.
The airline’s goal is to automatically extract as
much information as possible from the work orders,
where each work order consists of numerous docu-
ments. Correctly orienting and identifying the docu-
ment’s type are critical for achieving this goal. Figure
1 depicts the pipeline highlighting the document anal-
ysis process. Unfortunately there are numerous prob-
lems. Each scanned work order contains anywhere
from 3-25 images. The images have noise, signif-
icant scan lines, and are arbitrarily oriented. Once
Pope, J., Powers, D., Connell, J., Jasemi, M., Taylor, D. and Fafoutis, X.
Supervised Machine Learning and Feature Selection for a Document Analysis Application.
DOI: 10.5220/0008925104150424
In Proceedings of the 9th International Conference on Pattern Recognition Applications and Methods (ICPRAM 2020), pages 415-424
ISBN: 978-989-758-397-1; ISSN: 2184-4313
Copyright
c
2022 by SCITEPRESS – Science and Technology Publications, Lda. All rights reserved
415

Figure 1: Document Analysis Process.
(a) north (b) east
(c) north (d) south
Figure 2: Example Form Variants.
oriented and identified correctly, each document will
require further processing including text area identi-
fication, optical character recognition, and text anal-
ysis. Considering the decades covered, there are nu-
merous variants of each document. For example, we
have identified at least 10 variants of one document of
interest, the FAA Form 8130-3. Figure 2 shows four
of these variants and their orientation. Note that (a)
and (b) are wider than tall. Variants (c) and (d) also
show significant scan line noise. These variants illus-
trate the difficultly in assuming any particular layout
for automated processing. The problem is to automat-
ically extract information from the work orders given
these difficulties.
This paper examines our approach for obtaining
information from these work orders using supervised
machine learning techniques. We specifically focus
on determining the status of the FAA Form, though
the approach has been extended to other documents
and information of interest. There are at least thirty
identified document types. We use a sample of the
work orders to train the classifiers by partitioning the
images and calculating statistical measures for each
partition from low-level symbols. Depending on the
partition, there can be a large number of features gen-
erated. To reduce the complexity of the classifiers, we
consider a shrinkage feature selection technique that
considerably reduces the number of features while
maintaining comparable accuracy. The contributions
of this paper are enumerated as follows:
• Practical approach to orientation and document
classification using only symbol features without
resorting to an OCR engine.
• Comparison of machine learning algorithms for
these symbol features.
• Application of machine learning and feature se-
lection for document analysis.
We further stipulate that our approach makes no
assumptions regarding the font type and font size.
The rest of the paper is organised as follows. The
related work is discussed followed by the feature ex-
traction process. The orientation and document clas-
sifiers are presented along with their results and anal-
ysis. Next the text analysis and end-to-end results are
presented followed by the conclusion.
2 RELATED WORK
Lu and Tan (Lu and Tan, 2006) propose converting the
documents into vectors using language information,
density, and vertical components. Training vectors
are then compared against for orientation detection
and document classification. Rangoni, et al. (Rangoni
et al., 2009), propose a method that does not depend
on the specific text symbols used to infer the orienta-
tion. Instead it uses the OCR engine and selected text
ICPRAM 2020 - 9th International Conference on Pattern Recognition Applications and Methods
416
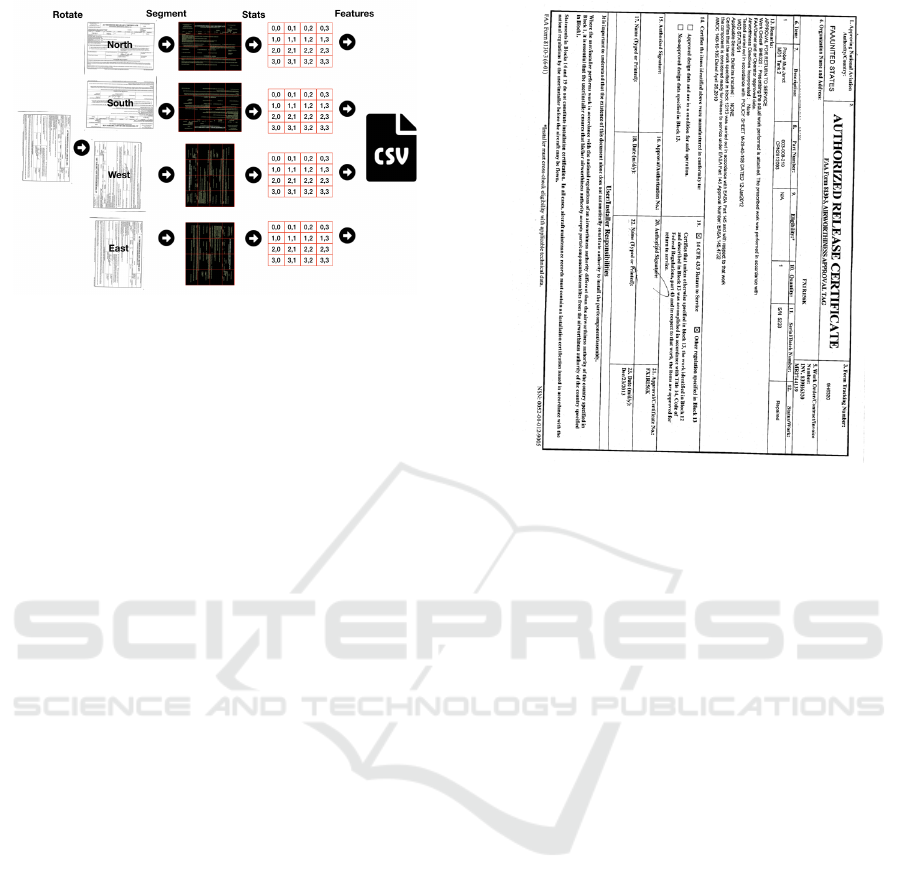
Figure 3: Feature Extraction Task.
to determine the orientation. Yang, et al. (Yang et al.,
2017), focus on text recognition from biomedical lit-
erature. They propose a system that performs multi-
orientation text detection, cropped word and end-to-
end recognition. Their approach does not explicitly
model the orientation of the document.
O’Gorman (O’Gorman, 1993) proposed a bottom-
up, nearest neighbour clustering approach for page
layout analysis. This has been a popular technique for
page layout analysis with many variants and heuris-
tics added. Ye, et al. (Ye and Doermann, 2015), sur-
vey existing techniques and problems for text recog-
nition in images highlighting the multiple orientation
issue.
Research in model selection continues and can
roughly be categorised as subset selection, shrinkage
methods, and dimension reduction techniques (James
et al., 2014). The Forward Stepwise subset selection
starts with no features in the model and adds them one
at a time. It can be evaluated using estimates of the
test error (e.g. AIC, BIC, adjusted R
2
) or directly us-
ing a validation set or cross-validation. LASSO (Tib-
shirani, 1994) and Elastic Net (Zou and Hastie, 2005)
are shrinkage techniques. LASSO adds an L1 norm
penalty of the coefficient vector to the residual sum
of squares. This norm is multiplied by the weighting
parameter λ. This can also be evaluated using cross-
validation.
3 FEATURE EXTRACTION
This section details how the image is processed from a
raw pixel representation to an annotated instance with
several hundred features. We use the notation N to
represent the number of training instances and D to
represent the number of features (i.e. dimensions).
Each work order typically consists of between four to
eight documents stored as images in a PDF. For this
Figure 4: Original Image.
work, we assume that the images have been extracted
and make the following assumptions:
• Images are scanned from form style documents
(also referred to as tabular documents) primarily
consisting of text and lines.
• Images consist mostly of black and white pixels or
can easily be converted (e.g. grey scale images).
• Most of the text symbols in the image are separa-
ble - i.e. non-cursive.
• Most of the text symbols are similarly aligned; we
do not assume mixed aligned text.
The following section details how pixels are con-
verted into symbols. The subsequent sections detail
how the symbol attributes are used to generate the fea-
tures for each image.
3.1 Symbol Extraction
The FAA Form 8130-3 contains black text, lines, and
figures with a white pixel background. Figure 4 shows
an example of the form. Most of the pixels are ei-
ther black (0,0,0) or white (255,255,255). Given the
form image, the file is read in and inverted to a pure
black background with pure white text, lines, and fig-
ures. A connected components algorithm is then run
on the image to group all pixels that are connected
into a symbol. We found that using a weighted union-
find with path compression (Sedgewick and Wayne,
2011) performs well for determining the connected
components and is scalable with a time complexity
near linear in the number of pixels.
Supervised Machine Learning and Feature Selection for a Document Analysis Application
417
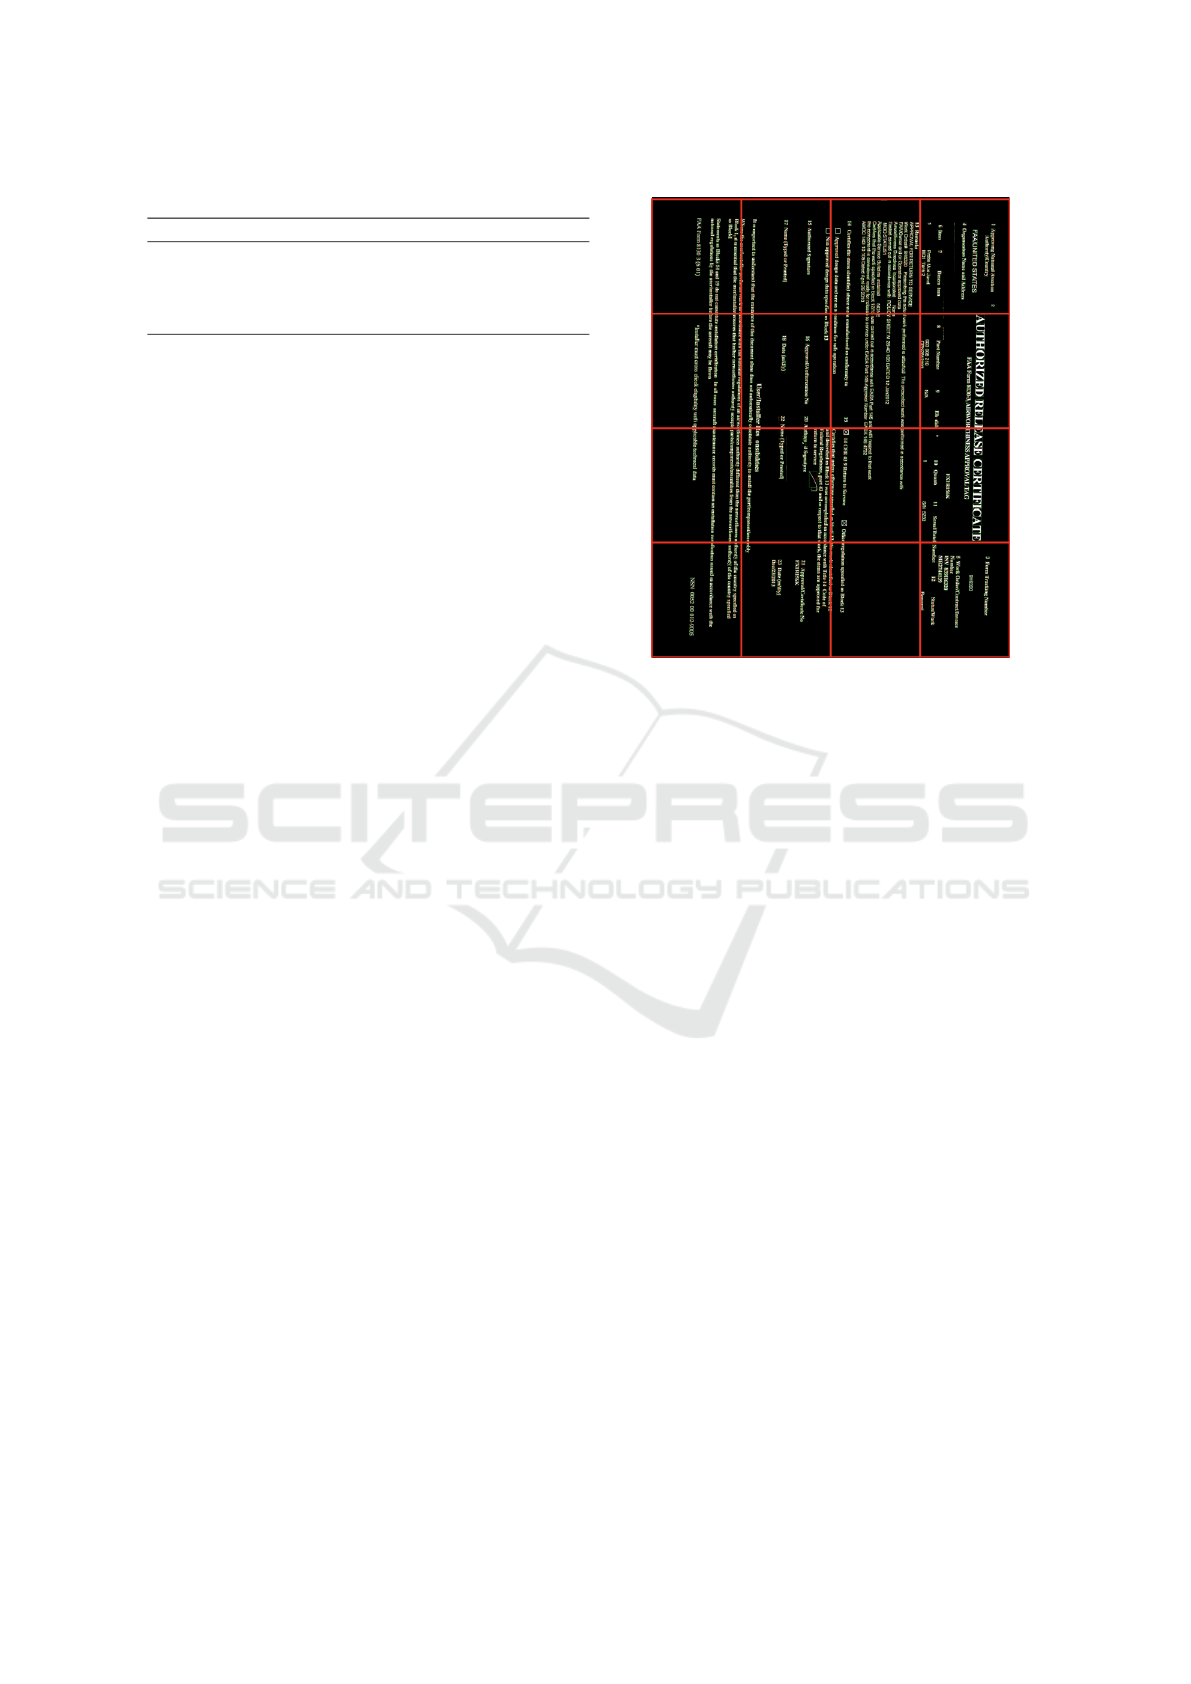
Table 1: Performance Metrics per Document Image.
Metric Value
Mean Time to Partition 0.8107 second
Mean Number of Pixels 8498281
Mean Number of Total Symbols 13226
Mean Number of Symbols Filtered 10986
To eliminate noise, we filter the symbols by num-
ber of points. Symbols with less than ∼ 20 points are
believed to be noise or uninteresting symbols (another
common approach would be to use a Gaussian filter /
threshold).
The remaining symbols are then augmented with
information about their neighbours. The K nearest
neighbours are determined using the distance between
the centroids of the symbols. The approach is per-
formed using a kD-tree to help avoid brute-force cal-
culation against all neighbours.
To demonstrate the efficiency of the approach, we
ran the process on 452 images (from 113 original doc-
uments rotated in the four orientations) and collected
metrics. The experiments were conducted ten times
on a standard MacBook Pro laptop (2.6 GHz Intel
Core i7). Table 1 shows the results. It takes less than
one second to produce the features for an image. It is
interesting to note the number of filtered noise sym-
bols (10986). This is due to the shaded regions on
many of the images (see Figure 2 (b) and (d)). Each
symbol has the following attributes.
• Number of black pixels
• Number of white pixels
• Density, white pixels / black pixels
• Bounding box pixel width and height
• Aspect ratio (width / height)
• Neighbour vector (distance and angle between
centroids)
3.2 Symbol Feature Generation
After each image is processed from raw pixels into
a set of symbols, the symbols are partitioned based
on the their centroid. The partition bounds are rect-
angular based on the number of columns and rows
specified. For example, if 4 rows and 4 columns are
specified for an image that is 2000 x 3000 pixels, the
partitions are 500 x 750 pixels. For this work we as-
sume the number of rows and columns to be the same
which we denote as P. Thus the number of partitions
is P
2
. Note that some symbol area may extend into
adjacent partitions - the symbol is placed into the par-
tition that contains its centroid point. Figure 5 shows
Figure 5: Partition P = 4.
the result of the partition of the form shown in Figure
4.
The number of points, neighbour angles, and den-
sity for the symbols are heavily skewed. For this rea-
son we choose to use the median as a central tendency
measure for each partition. For each partition the fol-
lowing features are recorded.
• Number of symbols in the partition
• Median neighbour angles
• Median aspect ratio
• Median symbol density
• Partition Density
As P increases there will be more and more par-
titions that have no symbols. For this, we record 0
for the number of symbols and 0 for the partition den-
sity and leave the aspect ratio, neighbour angle, and
symbol density as missing values.
3.3 Aspect Ratio
The aspect ratio is defined as the width / height for
each symbol. For each partition, we take the median
aspect ratio. For these particular documents we find
that a ratio below approximately 0.95 is indicative of
north or south orientation and above 0.95 is indicative
of east or west orientation.
ICPRAM 2020 - 9th International Conference on Pattern Recognition Applications and Methods
418

3.4 Symbol Neighbour Angle
Calculation
The centroid of each symbol is denoted as vector u
and a neighbour’s centroid is denoted as vector v.
Note that we first have to translate v to u by subtract-
ing to produce a new vector a = v − u. We normalise
a and compute the dot product with a unit vector b
pointing east (1,0). Because both vectors are unit, we
can simply determine the cos(θ) = a·b, where θ is the
angle between the vectors. For the rest of the paper
we consider this cos(θ) synonymous with neighbour
angle.
We do not need the actual angle in degrees and
simply use cos(θ) as the feature. We take the abso-
lute value to get values between [0.0, 1.0], where val-
ues near 0.0 indicate the neighbour is to the west or
east from the symbol and values near 1.0 indicate the
neighbour is to the north or south.
3.5 Number of Neighbours K
The number of neighbours for the expected neigh-
bour angle was also considered and is used in other
problem domains. O’Gorman suggests using K = 5
for extracting text blocks (O’Gorman, 1993). Figure
6 shows the result for K = 1. Each symbol is sur-
rounded by a green bounding box and red lines are
drawn to each neighbour. We empirically found that
it was sufficient to only consider K = 1 for orientation
detection (results omitted for brevity).
Figure 6: K = 1 Nearest Neighbours.
3.6 Number of Symbols
The number of symbols is also available for each par-
tition. Interestingly, Figures 11 and 10 show that the
number of symbols are critical for determining the
document’s type.
3.7 Document Features
In addition to the features for each partition, we cal-
culate the following features for each document.
• Document width
• Document height
• Document number of symbols
• Document median density
• Aspect ratio (width / height)
• Document median neighbour angle
• Orientation
• Document order in the PDF
Figure 7 shows the segment density versus neigh-
bour angle. Similar to the aspect ratio, this feature is
very good at separating north and south from east and
west orientations. Figure 8 shows it being used as the
root, though a better split value would have been 0.5
rather than the selected 0.119145.
It should be noted that there will be some corre-
lation between these document features and partition
features (e.g. the number of document symbols will
be related to the number of symbols in the partitions).
The total number of features D for each document is
given by the following formula.
D #features/document = (P
2
× 5) + 8 (1)
For example, a P = 4 partition results in D = 88
features for each image. We repeat this for each im-
age and save as a comma-separated values (CSV) file.
This file is then manually annotated to include the cor-
rect orientation and document type. We designate the
orientation as one of {east, north, west, south} (0, 90,
180, 270 degrees respectively). There are approxi-
mately thirty different document types. In this paper
we simplify and only consider the two classes {faa,
other}. We next analyse the orientation and document
type classifiers built using these features. We use de-
cision trees to assist in the analysis because they are
relatively easy to interpret.
4 ORIENTATION
CLASSIFICATION
We evaluate how well the features can be used to in-
fer the orientation and the effect that P has on the var-
ious classifiers. A failed orientation detection very
likely results in a failed optical character recognition,
thus we consider false positives and false negatives
Supervised Machine Learning and Feature Selection for a Document Analysis Application
419

Table 2: Classifier Settings.
Classifier Settings
Naive Bayes NA
Decision Tree -C 0.25 -M 2
Support Vector Machine -C 1.0 -K PolyKernel
Random forest -P 100
Logistic Regression -R 1e10
−8
-M -1
to be equal in cost. Considering this and since each
class is balanced we choose to use the accuracy mea-
sure to compare the various experiments. We use the
Weka data mining software (Hall et al., 2009) (version
3.9.3, 2019) to analyse the data. For the remainder of
this paper we use the classifiers listed in Table 2 using
the typical settings for this library. In several figures
we use the notation c0r4 segmentDensity to indicate
a specific feature for a partition (e.g. segment density
for partition column 0 and row 4). If the partition is
omitted it should be assumed to be a document fea-
ture. A brief analysis of the features with respect to
orientation is first presented followed by a compar-
ison of the accuracy of various classifiers using the
generated features.
4.1 Orientation Classifier Analysis
We consider the partition P = 5 with 133 features. Ex-
amining the scatter plots of the features against each
other it was clear that the document median angle
and certain partition segment densities provide use-
ful information regarding orientation. Figure 7 shows
a plot of the median angle (x-axis) versus partition
c4r4’s segment density. For illustration some jitter has
been added to distinguish the points.
The figure’s results are somewhat expected. For
English text the nearest symbol would be to the left or
right when oriented north or south. Conversely when
oriented east or west the nearest neighbour would be
above or below the symbol. Interestingly, the figure
also shows that the selected partition’s segment den-
sity can be used to distinguish between the north and
south orientation.
Figure 8 shows the corresponding decision tree.
We restricted the size of the tree for illustration pur-
poses (required leaf nodes to have a minimum of 100
instances).
The decision tree classifier takes advantage of the
document median angles and splits at 0.83 (though
0.5 would appear to suffice as well). As Figure
7 shows most north-south orientation instances are
nearer to 1.0 and east-west are nearer to 0.0. The
right half of the tree then uses the partition’s segment
density to differentiate north from south. The classi-
fier uses another partition segment density to differ-
Segment Density (c4r4)
Document Median Angle
Figure 7: Orientation Scatter Plot P = 5. Legend: north
south east west.
Figure 8: Orientation Decision Tree P = 5.
entiate east from west. The document median angle
and specific partition segment densities are important
for orientation classification. We also found that the
document median aspect was also able to distinguish
north-south from east-west similar to the document
median angle. This is also reasonable as we would
expect English text height to be more than the width
on the average.
Table 3 shows the confusion matrix for the deci-
sion tree classifier (with the node size restriction re-
moved) trained using 10 fold cross validation. We
would expect there to be errors between east and west
and north and south. We would not expect a north,
south orientation to be confused as east,west and visa
versa. The results confirm this as most errors occur
between north vs south and east vs west.
Table 3: Decision Tree Confusion Matrix P = 5.
Accuracy=0.972 Predicted
east north south west
Actual
east 563 0 1 16
north 1 565 14 0
south 1 16 563 0
west 15 0 1 564
ICPRAM 2020 - 9th International Conference on Pattern Recognition Applications and Methods
420
2 4
6
8 10 12 14
0.96
0.98
P
Accuracy
Decision Tree
Random Forest
Support Vector Machine
Figure 9: Orientation Accuracy 10-Fold Cross Validation.
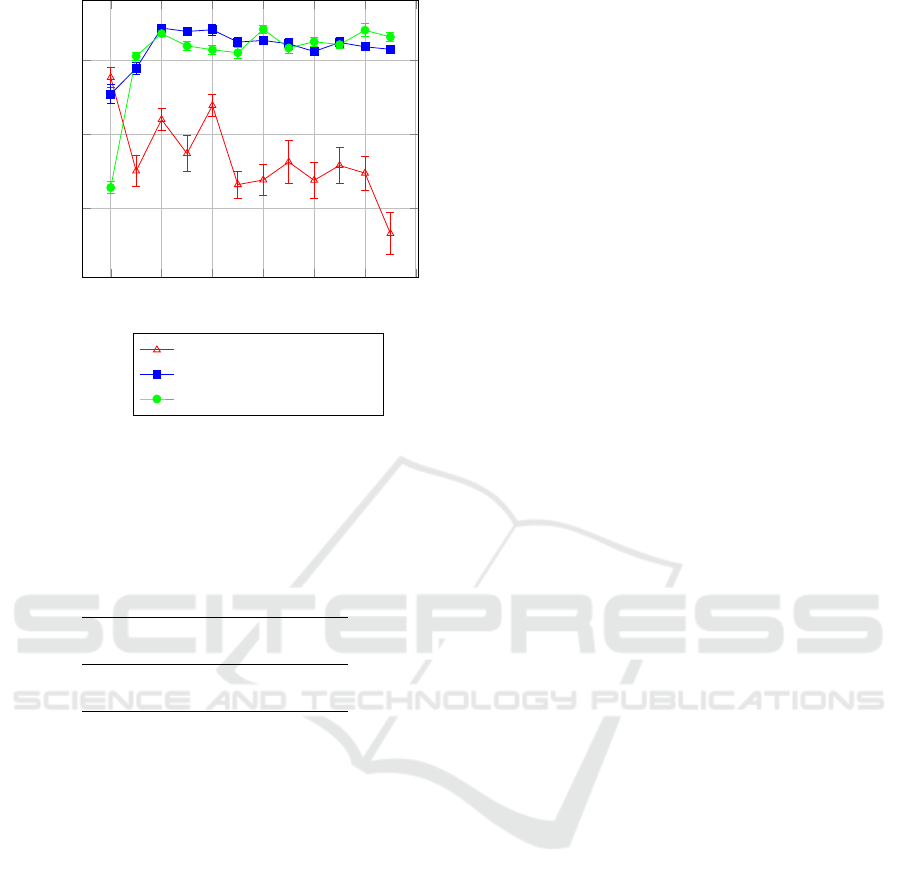
4.2 Orientation Classifier Accuracy
We use the annotated files for each value of P from 2
to 13 with N = 2320 instances to train several orienta-
tion classifiers. Due to limited training instances, we
train each classifier on the file using 10 fold cross val-
idation. We run this 30 times for each classifier and
take the average of the accuracy to produce Figure 9
with 99% confidence intervals. The results are shown
9. When P = 2 most classifiers perform poorly. We
believe this is because too much aggregation has oc-
curred and obscured differentiating information. As P
increases, the reason we believe the decision tree per-
forms poorly is because this creates more and more
irrelevant and correlated features. This has a negative
effect on some classifiers including decision trees and
naive Bayes (specifically correlated features) whereas
other classifiers, such as support vector machines, are
less impacted by these issues (Tan et al., 2019).
The ensemble random forest classifier appears to
do quite well for all values of P including P = 2. The
random forest and support vector machine do well be-
tween 3 =< P <= 6 achieving near 98% accuracy.
The random forest’s accuracy across all values of P
make it a strong candidate.
5 DOCUMENT CLASSIFICATION
Similar to the orientation classifier, we evaluate how
well the features can be used to infer the document
type and the effect that P has on the various classifiers.
We assume the orientation has been determined and
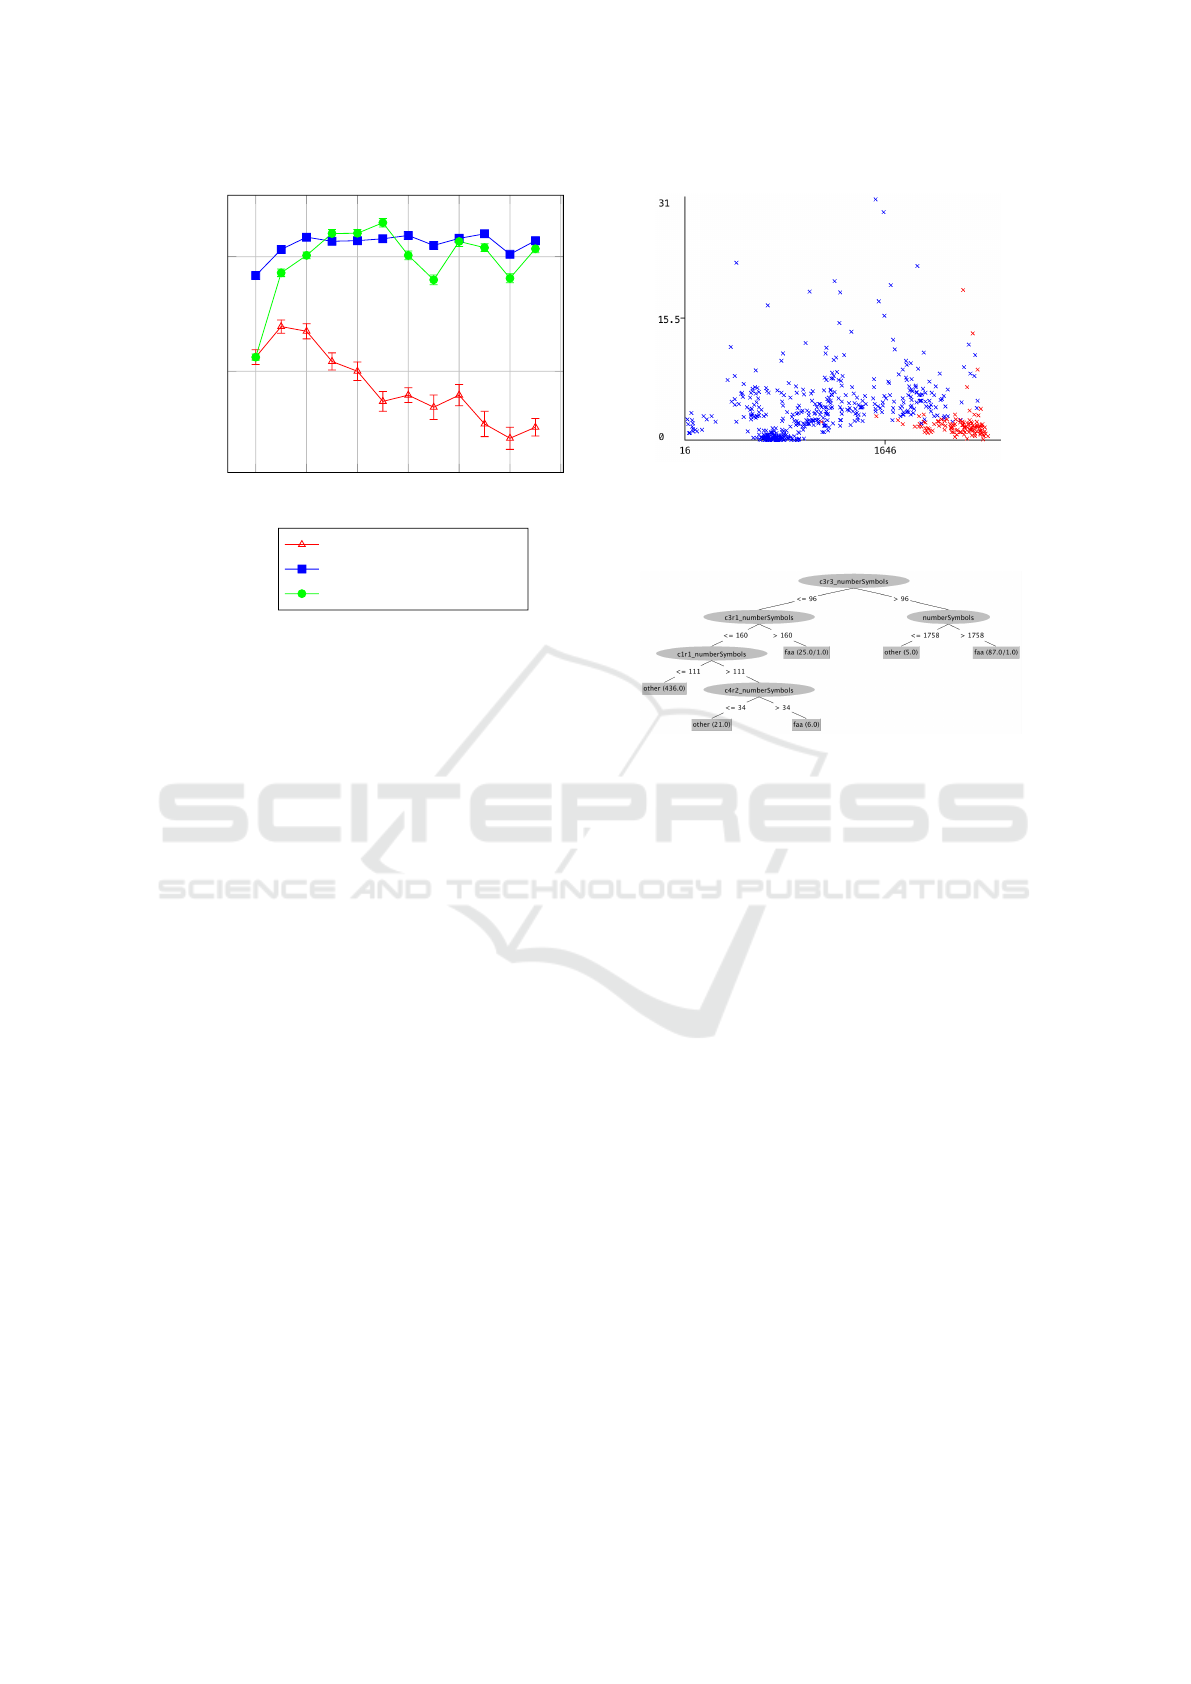
Document Number of Symbols
Order
Figure 10: Document Type Scatter Plot P = 5. Legend:
{other, faa}.
Figure 11: Document Type Decision Tree P = 5.
therefore only consider each image in its north orien-
tation with N = 580 annotated instances. We first con-
sider a brief analysis of the features and then consider
a comparison of the accuracy of various classifiers.
5.1 Document Type Classifier Analysis
Similar to the orientation classifier, we examine the
partition P = 5 with 133 features. Figure 10 shows
a plot of the document’s number of symbols (x-axis)
versus the document’s order (with some jitter added).
A relatively simple selection statement would do well
considering documents with more than 1800 symbols
and an order with 2 or 3. Figure 11 shows the corre-
sponding decision tree.
Interestingly, as Figure 11 shows, the decision tree
classifier primarily relies on the number of symbols
features. Other partition sizes do use the order. How-
ever, we also found the document median density fea-
ture to be just as effective as the order. We determined
this by removing the order feature and were able to
obtain similar accuracy results. Note that we did not
restrict the size of the tree. These results provide evi-
dence that many feature are either redundant (i.e. cor-
related with other features) or superfluous for docu-
ment type classification. Section 7 will provide more
evidence for this assertion. Table 4 shows the con-
fusion matrix for the decision tree. To remain consis-
tent, the classifier was trained using 10 fold cross vali-
Supervised Machine Learning and Feature Selection for a Document Analysis Application
421
2 4
6
8 10 12 14
0.97
0.98
0.99
P
Accuracy
Decision Tree
Random Forest
Support Vector Machine
Figure 12: Document Accuracy 10-Fold Cross Validation.
dation. We do note that for highly imbalanced classes
the number of folds may need to be adjusted (Raeder
et al., 2012). There are roughly the same number of
false positives as false negatives.
Table 4: Decision Tree Confusion Matrix P = 5.
Accuracy=0.9776 Predicted
other faa
Actual
other 457 7
faa 6 110
5.2 Document Type Classifier Accuracy
We again choose to use the accuracy measure to com-
pare the various experiments and use similar settings
shown in Table 2. We train each document type clas-
sifier using 10 fold cross validation and run this 30
times for each classifier and compute 99% confidence
intervals.
Figure 12 shows the results of the experiments.
For P = 2 the decision tree and random forest per-
form notably better than the support vector machine.
From P = 2 to P = 3 the situation reverses and the de-
cision tree performs progressively worse, as was the
case with the orientation classifier. After P = 3 the
random forest and support vector machine produce
similar results around 99% accuracy.
6 OCR AND TEXT ANALYSIS
Once images have been oriented and the document
identified, selected images are segmented and sent to
the optical character recognition (OCR) engine. After
a qualitative comparison of several tools, it was de-
cided to use Tesseract (Kay, 2007) as the OCR engine
in the pipeline. The north oriented FAA form image
is segmented to form a set of symbols. The symbols
are combined to form a suspected line of text (termed
document streams (O’Gorman, 1993)). Neighbouring
symbols are combined if within some angle to the left
and right and within some distance, both empirically
determined. Once the document streams have been
OCR’ed the produced text stream, (x, y) coordinates,
and bounding box are written to a Javascript Object
Notation (JSON) file.
The final text analysis step in Figure 1 performs
the following relatively simple procedure. The text
streams are filtered to only examine those in the area
of interest (in this case, the upper right quadrant).
Then each text stream is checked against a small set
of predetermined words. The Levenstein distance is
taken and the shortest distance is taken to the intended
word. Though simple this final step can also handle
false positive document classifications (images that
are not FAA forms but were identified as such and
OCR’ed). Of course, more extensive text analysis
can be performed and reinforce document classifi-
cation (e.g. using a bag of words approach). The
text analysis classifies as one of the following status’
{repaired,tested,inspected,overhauled,other}.
7 FEATURE SELECTION
We used the shrinkage method LASSO to select a
subset of the features for the document type classifier.
We compare the accuracy of the LASSO classifiers
to the full model classifiers. We do not necessarily
expect the LASSO classifiers to have a higher accu-
racy but would prefer that they are not significantly
lower. First the training set features for each parti-
tion size are standardised ( ¯x = 0.0, σ = 1.0). Miss-
ing values are then set to the mean of 0.0. We then
used the glmnet (Friedman et al., 2010) R package
for the analysis and figure generation. To evaluate
the models we selected cross-validation. With x rep-
resenting all the standardised features and y the re-
sponse variable type, we used the following com-
mand cv.glmnet(x,y, family = ”binomial”).
Figure 13 shows the log of λ versus the deviance
for a 10-fold cross validation to determine a suitable
value for λ for the P = 5 partition. The deviance is an
analogous measure to residual sum of squares but for
more general models and is negative two times the
maximised log-likelihood (lower is a better) (James
et al., 2014). For each value of λ the upper and lower
ICPRAM 2020 - 9th International Conference on Pattern Recognition Applications and Methods
422
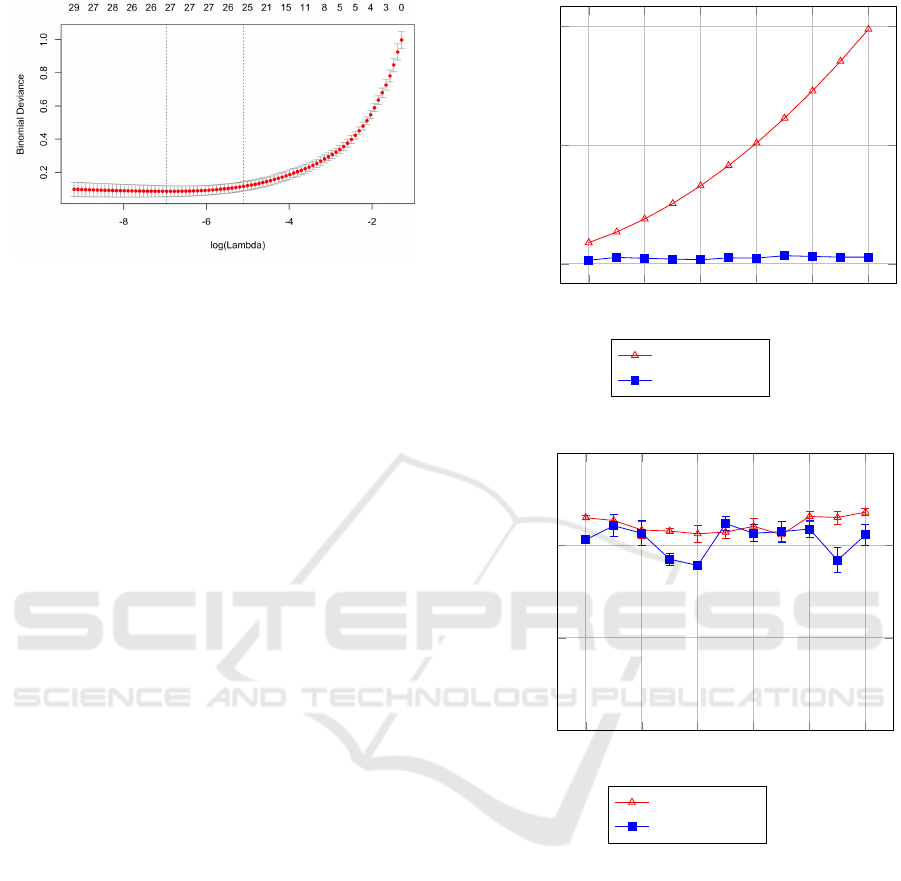
Figure 13: Binomial Deviance λ.
standard deviation is also shown. The first dashed ver-
tical line represents the λ
∗
that resulted in the lowest
deviance. Because we prefer a model with fewer fea-
tures we use the common heuristic of selecting the
matching λ to the right of λ
∗
’s upper standard devia-
tion. This is within one standard deviation of λ
∗
and
has fewer features (from roughly 27 to 25). This is
shown as the second dashed vertical line. Overall, this
went from 133 features (per Equation 1) to just 25, a
reduction of
˜
80%.
This process is repeated for each partition size
from P = 2 to P = 14 where a subset of features are se-
lected from the total set of features. Figure 14 shows
the total number of features versus the number of fea-
tures chosen by LASSO. The number of features for
LASSO rises slightly from P = 2 to P = 5. However,
after approximately P = 5 the number of features se-
lected by LASSO appears to stop increasing (the val-
ues never exceed 34 features). At P = 4, the number
of features for the LASSO model is 15 versus 88 for
the full model, a ratio of ∼17%. At P = 14, the num-
ber of features for the LASSO model is 28 versus 988
for the full model. The ratio between the number of
features for the LASSO model and the full model is
never more than 80% when P = 5. We believe this
is expected. At some point increasing the number of
features would not help the model as the partitions
become smaller and smaller and no significant aggre-
gation is obtained.
The document number of symbols and document
order from Section 3.7 appear in all LASSO models
except for one indicating their importance. The FAA
document typically appears second or third in the or-
der suggesting some ordering procedure in the scan-
ning process. The document median density also ap-
pears in more than half the models. The median doc-
ument density is likely correlated with the document
number of symbols. A drawback of LASSO is that it
arbitrarily selects one of a set of correlated features.
For the same models shown in Figure 14, using the
support vector machine classifier, we compute their
4
6
8 10 12 14
0
500
1,000
P
# Features
Full Model
Lasso Model
Figure 14: Features: Full Model vs LASSO Model.
4
6
8 10 12 14
0.97
0.98
0.99
1
P
Accuracy
Full Model
Lasso Model
Figure 15: Document Accuracy Full vs LASSO Model.
accuracy results 30 times and plot them in Figure 15
with 99% confidence intervals. The accuracy results
of the LASSO model are comparable to the full model
or indistinguishable.
8 STATUS CLASSIFICATION
RESULTS
To demonstrate the overall efficacy of our approach,
we consider the classification of the FAA status as
shown in Figure 1 for each work order. A cor-
rect classification requires the orientation, document
type, document stream identification, optical charac-
ter recognition, and text analysis to also be successful.
Supervised Machine Learning and Feature Selection for a Document Analysis Application
423

To be clear, this is not an ideal validation. Though we
have been using cross validation approaches through-
out, a significant test set would be more convincing
(future work is to obtain this).
The pipeline was run on the 116 work orders with
1106 images where 117 are FAA documents (one
work order had a duplicate FAA form). All 117
FAA documents were correctly oriented. The doc-
ument type classifier predicted 121 documents to be
FAA where four were false positives (non-FAA im-
ages classified as FAA). The text classifier predicted
three of the four as other and one as tested (i.e. it mit-
igated three of four false positives). The text classifier
correctly predicted the status of 116 FAA documents
with one incorrectly predicted as tested versus actual
repaired.
9 CONCLUSIONS
In this paper we proposed and demonstrated an ap-
proach for document analysis using a combination
of supervised machine learning models for orienta-
tion classification and document classification. The
form style documents were first partitioned to pro-
duce symbols from which features were generated.
The features were then used to train machine learn-
ing algorithms. When the image is oriented and the
document identified, document streams are sent to an
OCR engine to produce a text file from which a simple
match is made to determine the desired form’s status.
We then employed a feature selection approach for the
document type classifier to produce a parsimonious
model and showed that it was as accurate as the full
model. Finally, the end-to-end results were presented
to demonstrate the effectiveness of our approach.
ACKNOWLEDGEMENTS
This work was supported in part by the University
of Montevallo Contract #19-0501-001. The authors
greatly appreciate the support of the airline company
employees involved in the project. Without their ef-
forts this research could not have been conducted.
REFERENCES
Friedman, J., Hastie, T., and Tibshirani, R. (2010). Regular-
ization paths for generalized linear models via coordi-
nate descent. Journal of Statistical Software, 33(1):1–
22.
Hall, M., Frank, E., Holmes, G., Pfahringer, B., Reutemann,
P., and Witten, I. H. (2009). The WEKA Data Min-
ing Software: An Update. SIGKDD Explor. Newsl.,
11(1):10–18.
James, G., Witten, D., Hastie, T., and Tibshirani, R. (2014).
An Introduction to Statistical Learning: With Appli-
cations in R. Springer Publishing Company, Incorpo-
rated.
Kay, A. (2007). Tesseract: An open-source optical character
recognition engine. Linux J., 2007(159):2–.
Lu, S. and Tan, C. L. (2006). Automatic document orien-
tation detection and categorization through document
vectorization. In Proceedings of the 14th ACM Inter-
national Conference on Multimedia, MM ’06, pages
113–116, New York, NY, USA. ACM.
O’Gorman, L. (1993). The document spectrum for page lay-
out analysis. IEEE Transactions on Pattern Analysis
and Machine Intelligence, 15(11):1162–1173.
Raeder, T., Forman, G., and Chawla, N. V. (2012). Learn-
ing from Imbalanced Data: Evaluation Matters, pages
315–331. Springer Berlin Heidelberg, Berlin, Heidel-
berg.
Rangoni, Y., Shafait, F., Van Beusekom, J., and Breuel,
T. M. (2009). Recognition driven page orientation
detection. In Proceedings of the 16th IEEE Inter-
national Conference on Image Processing, ICIP’09,
pages 1969–1972, Piscataway, NJ, USA. IEEE Press.
Sedgewick, R. and Wayne, K. (2011). Algorithms, 4th Edi-
tion. Addison-Wesley.
Tan, P., Steinbach, M., Karpatne, A., and Kumar, V. (2019).
Introduction to Data Mining, Second Edition. Pear-
son.
Tibshirani, R. (1994). Regression shrinkage and selection
via the lasso. JOURNAL OF THE ROYAL STATISTI-
CAL SOCIETY, SERIES B, 58:267–288.
Yang, C., Yin, X., Yu, H., Karatzas, D., and Cao, Y. (2017).
ICDAR2017 robust reading challenge on text extrac-
tion from biomedical literature figures (DeTEXT). In
2017 14th IAPR International Conference on Docu-
ment Analysis and Recognition (ICDAR), volume 01,
pages 1444–1447.
Ye, Q. and Doermann, D. (2015). Text detection and
recognition in imagery: A survey. IEEE Transac-
tions on Pattern Analysis and Machine Intelligence,
37(7):1480–1500.
Zou, H. and Hastie, T. (2005). Regularization and variable
selection via the elastic net. Journal of the Royal Sta-
tistical Society, Series B, 67:301–320.
ICPRAM 2020 - 9th International Conference on Pattern Recognition Applications and Methods
424
