
Surface Plasmons Phase Imaging Microscopy using Deep Learning
Suejit Pechprasarn
a
, Suvicha Sasivimolkul
b
, Chayanisa Sukkasem
c
,
Phitsini Suvarnaphaet
d
and Nuntachai Thongpance
College of Biomedical Engineering, Rangsit University, Phaholyothin Road, Pathum Thani, Thailand
Keywords: Surface Plasmon Resonance, Phase Imaging, Phase Retrieval Algorithm, Surface Plasmon Microscopy, Deep
Learning, Image Recognition.
Abstract: Surface Plasmon Resonance have been a gold standard for biosensing and chemical sensing over the past
decades. The surface plasmons are a confined electromagnetic wave mode propagating on surface of noble
metals. One of the key features of surface plasmons is that they are sensitive to its surrounding medium,
therefore the surface plasmons are usually applied in sensing applications. It has been very well established
that measuring the phase response of the surface plasmons is more sensitive and more robust compared to
intensity or amplitude measurements. To measure the phase, of course, an interferometer is required. This
will impose the complexity to the optical alignment. Moreover, the interferometric systems usually require a
well-controlled experimental condition, such as, vibration isolation system. Recently, there are some interest
of the research community to recover the surface plasmons phase through computational phase retrieval
algorithms, such as, Ptychography. Although these computational algorithms can recover the phase profile,
they do require many images or a lengthy computing time making them not suitable for real-time measurement.
Here, we propose a novel approach to perform surface plasmon phase retrieval using image recognition
though deep learning. We demonstrate the feasibility of using the deep learning to recover amplitude and
phase responses of simulated back focal plane images.
1 INTRODUCTION
Surface Plasmons (SPs) are a confined
electromagnetic wave phenomenon propagating on
surface of noble metals, such as, gold (Au), Silver
(Al) and Copper (Cu) (Somekh & Pechprasarn,
2016). Surface Plasmon Resonance (SPR) is a well-
known resonant effect of the SPs occurring when
there is a p-polarized light beam (TM polarization)
with a matching momentum to the resonant frequency
of the SPs illuminating on the noble metal surface.
The SPR is very sensitive to its local refractive index
change around the height of 200nm from the metal
surface due to the evanescent wave penetration depth
of the SPs (Shen, Learkthanakhachon, Pechprasarn,
Zhang, & Somekh, 2018). The SPs have been widely
utilized as a gold standard equipment for label-free
biosensing (Liedberg, Nylander, & Lundström,
1995), chemical sensing (Liedberg, Nylander, &
a
https://orcid.org/0000-0001-9105-8627
b
https://orcid.org/0000-0002-1459-8133
c
https://orcid.org/0000-0003-4057-7237
d
https://orcid.org/0000-0001-8195-1841
Lunström, 1983) and bioimaging (Pechprasarn &
Somekh, 2014; Somekh, Pechprasarn, Chow, Meng,
& Shen, 2016).
There are two standard approaches to excite the
SPs, which are (1) Kretschmann configuration
(Kretschmann & Raether, 1968) as shown in Figure
1a and (2) Otto configuration (Akowuah, Gorman, &
Haxha, 2009) as shown in Figure 1b. Both optical
configurations require high index prism coupling and
p-polarized incident illumination with the wavelength
in red to infrared regime. The main difference
between the two configurations is the thickness of the
metal and the position of the metal. On the reflectance
of both configurations, there will be a dark band in
the reflectance curve, so called ‘SP dip’ position and
the wave vector position that the SP dip occurs is the
surface plasmon’s wave vector or k
sp
.
Pechprasarn, S., Sasivimolkul, S., Sukkasem, C., Suvarnaphaet, P. and Thongpance, N.
Surface Plasmons Phase Imaging Microscopy using Deep Learning.
DOI: 10.5220/0008917100330039
In Proceedings of the 8th International Conference on Photonics, Optics and Laser Technology (PHOTOPTICS 2020), pages 33-39
ISBN: 978-989-758-401-5; ISSN: 2184-4364
Copyright
c
2022 by SCITEPRESS – Science and Technology Publications, Lda. All rights reserved
33
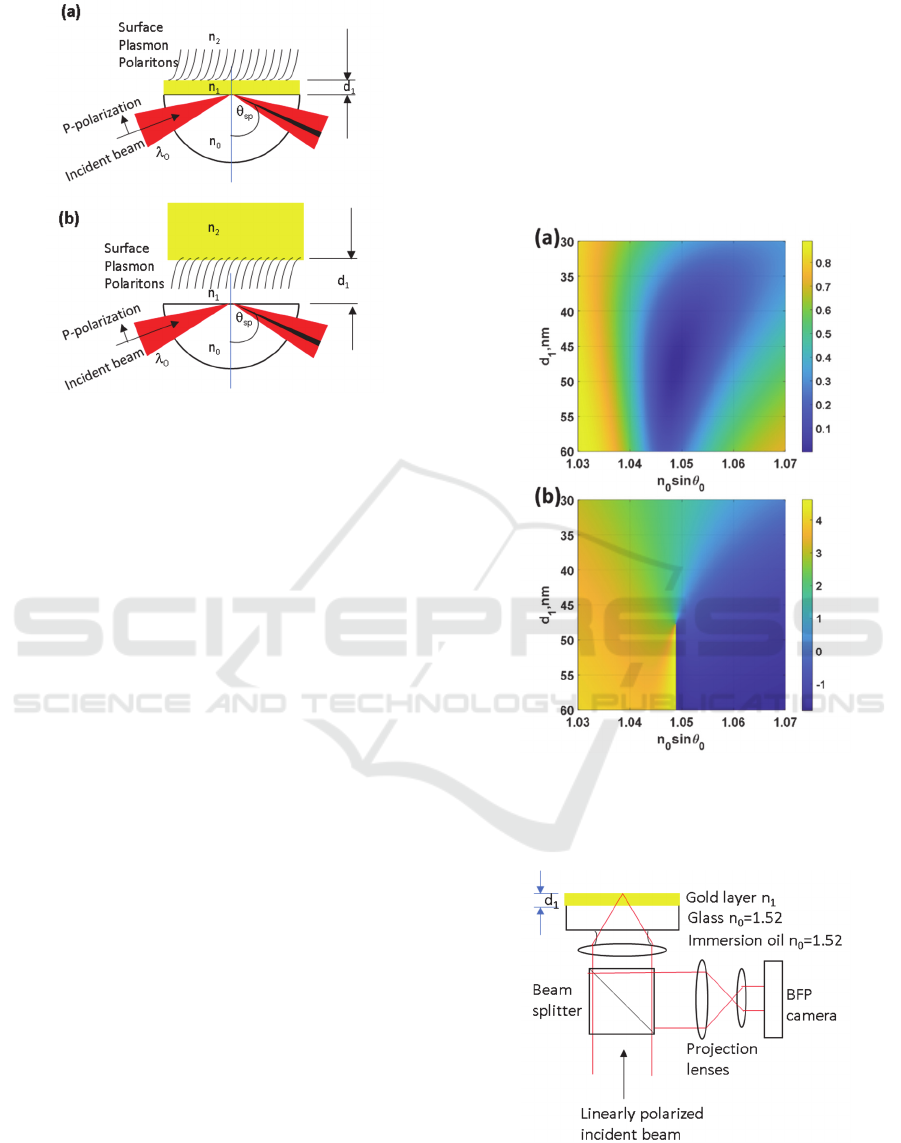
Figure 1: Shows conventional SPR optical setups (a)
Kretschmann configuration and (b) Otto configuration.
The SP dip occurs due to loss mechanisms of SP
coupling (Pechprasarn, Chow, & Somekh, 2018).
This is a strong evidence for SP excitation. Figure 2a
shows the simulated SP reflectance curves for
different thicknesses of gold between 60nm to 60nm
with the p-polarized incident wave of 633nm
wavelength (HeNe) and the gold complex refractive
index of 0.1834+3.4332i (Johnson & Christy, 1972)
for Kretschmann configuration. Fig.2b shows
corresponding phase responses. The phase responses
of reflection coefficient for p-polarized wave were
different for different thicknesses of the gold layer d
1
.
For the thicknesses lower than 47nm had 2π rad phase
transition over the SP dip, whereas the thicknesses
higher than 47nm had π rad phase transition. This can
be explained by coupling strength of the SPs and the
direct reflection from the gold surface, which is
explained in detail in the cited reference here
(Pechprasarn et al., 2018). The simulation results in
Figure 2 were calculated using Fresnel equations and
Transfer matrix approach (Suvarnaphaet &
Pechprasarn, 2018).
For Kretschmann configuration, the uniform
metal is usually very thin and attach to the glass prism
layer. The metal thickness (d
1
) for biosensing
depends
on the metal type and its application. For biosensing,
gold is usually used as the SPR sensor chip, since gold
is chemically stable and does not form an oxide layer
with its environment (Suvarnaphaet & Pechprasarn,
2018). The gold thickness is usually employed at
46nm to 50nm, since it gives the darkest |r
p
|
2
.
On the other hand, for the Otto configuration there
is a very thick metal layer positioned around one
wavelength of light away from the glass prism. The
Otto configuration to the best of author knowledge it
is not usually applied in a biosensing. Most of its
applications are in physics, like study of light-matter
interaction (Pechprasarn et al., 2016).
Thanks to high numerical aperture (NA) objective
lenses, which are becoming more affordable and
widely commercially available, they have made the
SPs excitation possible under a conventional
microscope configuration as shown in Figure 3.
Figure 2: Shows (a) Reflectance |r
p
|
2
and (b) phase of r
p
in
rad for 30nm to 60nm of uniform gold layer coated on BK7
glass with refractive index of 1.52. The incident wave was
p-polarized wave at 633nm wavelength.
Figure 3: Shows gold sensor under an oil immersion
objective lens and optical system to capture the back focal
plane (BFP) image.
PHOTOPTICS 2020 - 8th International Conference on Photonics, Optics and Laser Technology
34
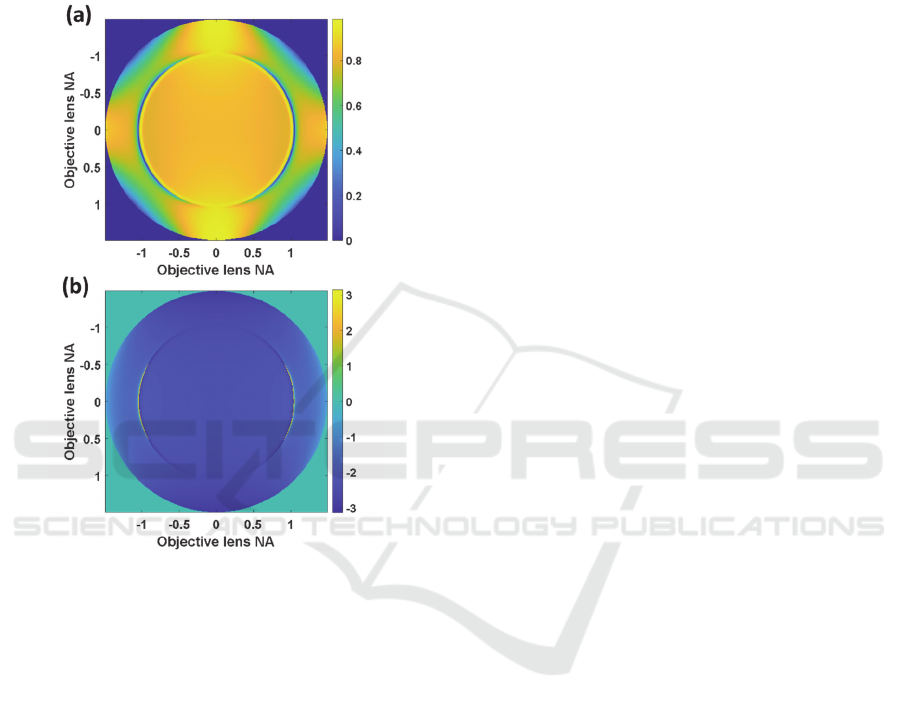
Figure 4a and Figure 4b show a simulated back
focal plane (BFP) of the 1.49 NA objective lens
microscope system in Figure 3a for a linearly
polarized coherent source of 633nm wavelength. The
pure p-polarization is along the x-axis of Figure 4 and
the pure s-polarization is along the y-axis of Figure
4.
Figure 4: Shows (a) BFP intensity and (b) BFP phase in rad
for the electric field component along x-direction. n0=1.52,
n1=0.1834+3.4332i ,n2=1.00, d1=45nm λ0=633nm.
Although the SPR has been discovered and its
theory have been thoroughly studied and very well
established for a few decades, there are still new
findings and breakthroughs reported over the recent
years. One of the most exciting work in the field is
single protein molecule imaging (Taylor & Zijlstra,
2017) and quantitative bioimaging (Tan,
Pechprasarn, Zhang, Pitter, & Somekh, 2016). Most
of the ultra-sensitive SPR systems rely on phase SPR
phase measurement (Pechprasarn & Somekh, 2014).
It has been very well established that in measuring
SPR phase is more robust and more sensitive than
measuring SPR amplitude response (Kabashin,
Patskovsky, & Grigorenko, 2009). Of course, to
measure the phase response, an optical interferometer
is needed making the optical configuration more
sophisticated (Pechprasarn, Zhang, Albutt, Zhang, &
Somekh, 2014). There are several interferometric
configurations reported to improve SPR phase
measurement stability and repeatability, such as,
common path SPR interferometry (Pechprasarn et al.,
2014). Recently there is an interest in applying
computational phase retrieval algorithms, such as,
Ptychography (Somekh, Pechprasarn, Chen,
Pimonsakonwong, & Albutt, 2017), Transport of
intensity (Streibl, 1984) and Gerchberg and Saxton
(Zalevsky, Mendlovic, & Dorsch, 1996) to retrieve
the SPR phase with no requirement of an
interferometer system.
Although the phase retrieval algorithms can be
employed to recover the SPR phase, they still have
their own disadvantages for each of the algorithms.
For example, for the Ptychography and Gerchberg
and Saxton they are iterative therefore they are not
suitable for real time measurement. The transport of
intensity method is not an iterative method, it
recovers the phase by solving a Poison’s equation to
wave propagation to predict the phase of the
propagating wave. The method requires finite
element (FEM) calculation, computationally time
consuming and require relatively large computing
power compared to the other two methods.
Here, the mentioned issues will be addressed by
replacing the time-consuming phase retrieval
computations by a data driven technology deep
learning. Here a 3 layered U-shaped artificial neural
network (UNet) architecture was employed to learn
how to do image segmentation and regression to
predict the corresponding real part and imaginary part
of the back focal plane as the network output.
2 PROPOSED METHOD
In this section, an overview of relevant computational
methods and the deep learning are described in detail.
There are 3 major components to train the UNet
network (1) Input BFP intensity (2) the UNet network
and (3) the labelled output BPF. Once the UNet has
been trained and has reach its convergence. The
network can then be deployed to validate itself, by
predicting an output for a new BFP input. Validation
to test the robustness of the trained network will be
discussed in section 3.
2.1 Back Focal Plane Calculation
Here, 1,000 BFP images were computed with
different d
1
thicknesses ranging from 25nm to 65nm
serving as the training data for the UNet, which will
be described in detail in the later section. The d
1
thicknesses are randomly distributed as shown in
Surface Plasmons Phase Imaging Microscopy using Deep Learning
35
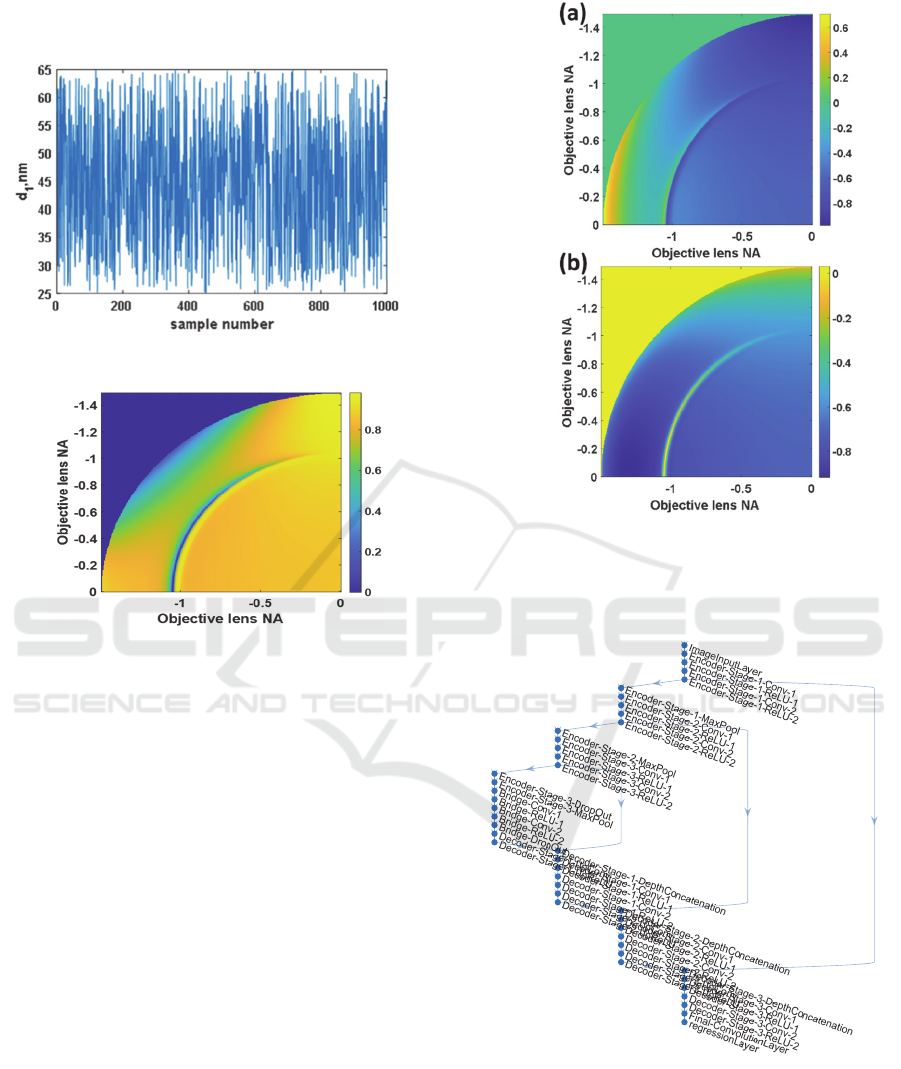
Figure 5. The mean value and the standard deviation
for the d
1
were 44.55nm and 11.33nm respectively.
Figure 5: Shows d1 thicknesses for all the 1,000 cases.
Figure 6: Shows one quadrant of the BFP intensity for the
500
th
sample with d
1
of 49.54nm.
BFPs for all the d
1
thicknesses were then
computed using Fresnel equations and the transfer
matrix approach (Suvarnaphaet & Pechprasarn,
2018). It is important to point out that only one
quadrant of the BFP was computed to reduce the size
of the training set since the other 3 quadrants contain
the exact same information. Figure 6 shows a
computed BFP intensity of the electric field pointing
along x direction for the case number 500 (d
1
of
49.54nm). This is the input for the neural network.
For the output from the neural network, the
labelled data was prepared as the real part and the
imaginary part of the BFP as shown in Figure 7a and
Figure 7b. The training dataset for the neural network
consisting of 1,000 images with 1 input (BFP
intensity with the size of 328 pixels x328 pixels) and
2 outputs (the real part of the BFP and the imaginary
part with the total size of 328 pixels x328 pixels x 2
dimensions). It is important to point out that one can
use only one output by taking the phase as the output,
but here the two outputs was implemented to avoid
the ambiguity of 2π rad phase wrapping. This will be
discussed in detail in discussion section later.
Figure 7: Shows (a) real part of the 500
th
sample BFP and
(b) imaginary part of the 500
th
sample BFP.
2.2 U-Network Shape Neural Network
Figure 8: Shows U-shaped artificial neural network
structure with 3 layers of encoders and 3 layers of decoders.
In this paper, U-shaped artificial neural network
structure with 3 layers of encoder and 3 layers of
decoder as shown in Figure 8 were employed. The
UNet has been found to one of the best artificial
neural networks (ANNs) for image segmentation and
PHOTOPTICS 2020 - 8th International Conference on Photonics, Optics and Laser Technology
36
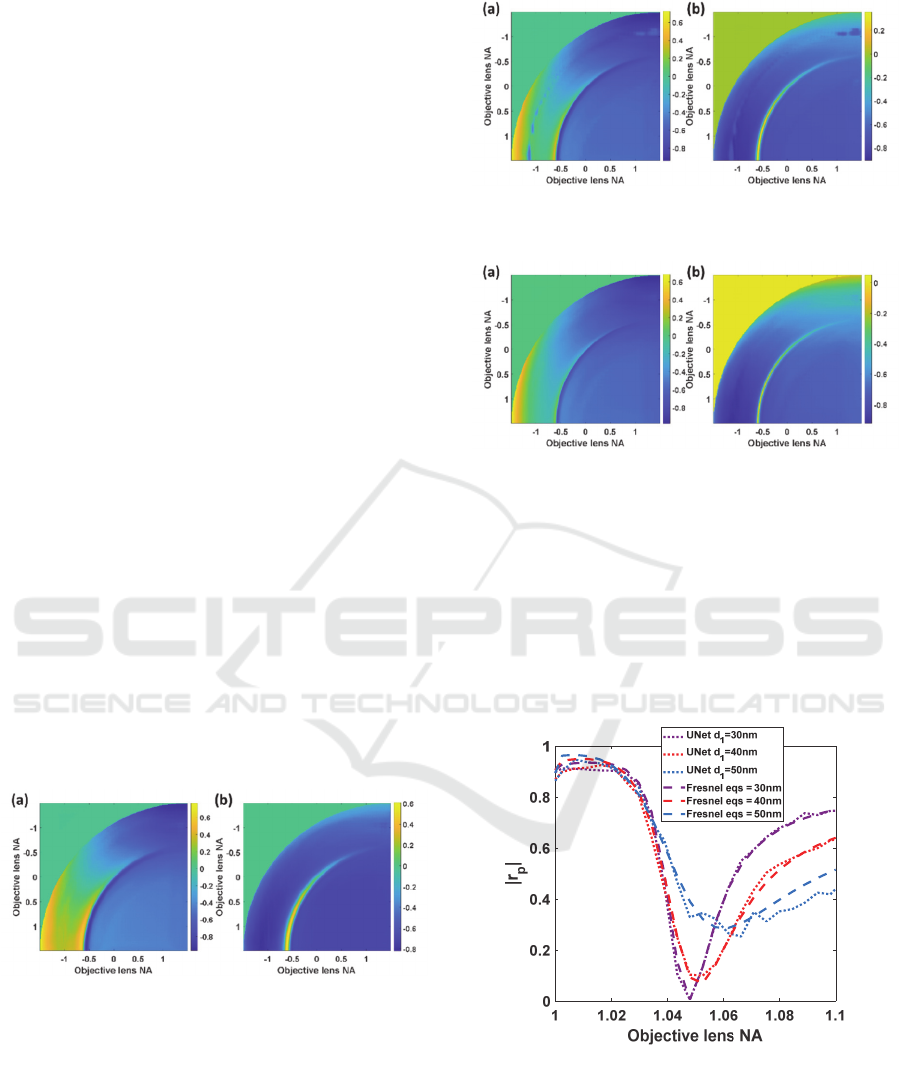
image regression. Predicting the phase values is, of
course, in the category of image regression. The
detailed functions for each network layer are omitted
they are all standard functions in deep learning. The
UNet is then trained with the BFP dataset described
in the section 2.1.
3 RESULTS AND DISCUSSION
3.1 Network Training
The UNet network was trained under
MATLAB2019a environment with a single graphic
processing unit (GPU) Nvidia GeForce GTX1060. It
took about 8 hours for 100 Epoches (100,000
iterations in total). The UNet is trained so that the
recovered outputs have reached the root mean square
error less than 0.0001 or 0.01%.
Once the UNet is trained, in the next section the
UNet will be tested with different thicknesses of d
1
to
validate the corresponding output results.
3.2 Network Testing with Simulated
Data
Here let us, see how well the network responses to the
simulated input BFP. It is interesting to point out that
the BFP phase responses do have different phase
gradient and transition levels depending on the d
1
sensor thickness. Three thicknesses of 30nm,40nm
and 50nm were chosen to be the test input to the
trained UNet.
Figure 9: Shows (a) real part for d
1
of 30nm and (b)
imaginary part for d
1
of 30nm.
The BFP images corresponding to the 3
thicknesses were then computed as discussed in
section 2.1. The 3 BFPs were employed as an input to
the trained UNet in turn. The output real part and
imaginary part images corresponding to the 3 inputs
are shown in Figure 9 to Figure 11 for d1 of 30nm,
40nm and 50nm respectively.
Figure 10: Shows (a) real part for d
1
of 40nm and (b)
imaginary part for d
1
of 40nm.
Figure 11: Shows (a) real part for d
1
of 50nm and (b)
imaginary part for d
1
of 50nm.
The UNet can recover the real and imaginary parts
for all the three inputs. However, for the 40nm case,
there were some noise artefacts at around the NA of
1.02 for both s and p polarizations.
From the results in Figure 9 to Figure 11, the
reflectance curve and the phase transition can be
calculated as shown in Figure 12. Figure 12 shows the
linescan reflectance |r
p
|
2
for the 3 thicknesses.
Figure 12: Shows linescan of recovered reflectance |r
p
|
2
calculated from the results in Figure 9 to Figure 11 in
comparison with the ideal BFPs calculated using Fresnel
equations.
It can be observed that the recovered intensity images
have the similar shape and intensity profiles
compared to the Fresnel calculations. However, they
did have some noise on the recovered SP dips
Surface Plasmons Phase Imaging Microscopy using Deep Learning
37
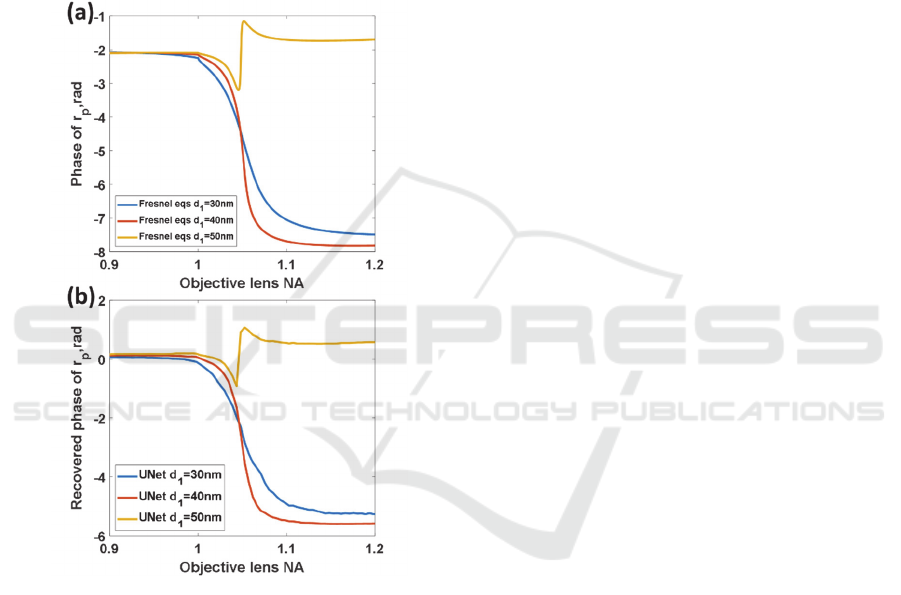
especially for 40nm case. The SP phase responses
could also be recovered from the results in Figure 9
to Figure 11. The phase responses calculated from
Fresnel equations for the three gold thicknesses are
shown in Figure 13a in comparison with the phase
profiles recovered from the UNet as shown in Figure
13a. Like the intensity responses, the recovered phase
profiles using the UNet were like the phase profiles
from Fresnel calculation with some random noise on
the phase profile. These noises did not affect the
shape and gradient of the phase transition of the SPR
dip.
Figure 13: Shows (a) phase responses for the three
thicknesses of gold calculated using Fresnel equations and
(b) the recovered phase responses using the UNet.
The proposed image recognition using UNet
might be another promising candidate to get around
the issues of phase retrieval algorithms. There are still
several issues that need to be further investigated,
such as, how robust the network is at different input
noise levels and its performance compared to the
conventional interferometry and computational phase
retrieval algorithms.
4 CONCLUSION
In this paper, we have proposed a novel approach to
perform SPR phase measurement using U-shaped
artificial neural network through deep learning. The
UNet has been employed to replace the need for an
interferometer or a computational phase retrieval
algorithm. We have provided a theoretical analysis
showing that the trained UNet can correctly recover
different phase profiles. However, there are still some
noise artefacts on the recovered intensity and phase
profiles. There are still some room for further
improvement, such as, training the network with a
bigger dataset or including the image plane to the
training set. We are currently investigating these
possible improvements, which will be reported in
another separate publication.
ACKNOWLEDGEMENTS
The authors would like to acknowledge the Research
Institute of Rangsit University, Thailand for research
funding and traveling grant.
REFERENCES
Akowuah, E. K., Gorman, T., & Haxha, S. (2009). Design
and optimization of a novel surface plasmon resonance
biosensor based on Otto configuration. Optics express,
17(26), 23511-23521.
Johnson, P. B., & Christy, R.-W. (1972). Optical constants
of the noble metals. Physical review B, 6(12), 4370.
Kabashin, A. V., Patskovsky, S., & Grigorenko, A. N.
(2009). Phase and amplitude sensitivities in surface
plasmon resonance bio and chemical sensing. Optics
express, 17(23), 21191-21204.
Kretschmann, E., & Raether, H. (1968). Radiative decay of
non radiative surface plasmons excited by light.
Zeitschrift für Naturforschung A, 23(12), 2135-2136.
Liedberg, B., Nylander, C., & Lundström, I. (1995).
Biosensing with surface plasmon resonance—how it all
started. Biosensors and Bioelectronics, 10(8), i-ix.
Liedberg, B., Nylander, C., & Lunström, I. (1983). Surface
plasmon resonance for gas detection and biosensing.
Sensors and actuators, 4, 299-304.
Pechprasarn, S., Chow, T. W., & Somekh, M. G. (2018).
Application of confocal surface wave microscope to
self-calibrated attenuation coefficient measurement by
goos-hänchen phase shift modulation. Scientific
reports, 8(1), 8547.
Pechprasarn, S., Learkthanakhachon, S., Zheng, G., Shen,
H., Lei, D. Y., & Somekh, M. G. (2016). Grating-
coupled otto configuration for hybridized surface
phonon polariton excitation for local refractive index
PHOTOPTICS 2020 - 8th International Conference on Photonics, Optics and Laser Technology
38

sensitivity enhancement. Optics express, 24(17),
19517-19530.
Pechprasarn, S., & Somekh, M. G. (2014). Detection limits
of confocal surface plasmon microscopy. Biomedical
optics express, 5(6), 1744-1756.
Pechprasarn, S., Zhang, B., Albutt, D., Zhang, J., &
Somekh, M. (2014). Ultrastable embedded surface
plasmon confocal interferometry. Light: Science &
Applications, 3(7), e187.
Shen, M., Learkthanakhachon, S., Pechprasarn, S., Zhang,
Y., & Somekh, M. G. (2018). Adjustable microscopic
measurement of nanogap waveguide and plasmonic
structures. Applied optics, 57(13), 3453-3462.
Somekh, M. G., & Pechprasarn, S. (2016). Surface
plasmon, surface wave, and enhanced evanescent wave
microscopy. Handbook of Photonics for Biomedical
Engineering, 1-41.
Somekh, M. G., Pechprasarn, S., Chen, W.,
Pimonsakonwong, P., & Albutt, N. (2017). Back Focal
Plane Confocal Ptychography. Paper presented at the
Applied Mechanics and Materials.
Somekh, M. G., Pechprasarn, S., Chow, W.-K., Meng, J., &
Shen, H. (2016). New avenues for confocal surface
plasmon microscopy. Paper presented at the Plasmonics
in Biology and Medicine XIII.
Streibl, N. (1984). Phase imaging by the transport equation
of intensity. Optics communications, 49(1), 6-10.
Suvarnaphaet, P., & Pechprasarn, S. (2018). Enhancement
of long-range surface plasmon excitation, dynamic
range and figure of merit using a dielectric resonant
cavity. Sensors, 18(9), 2757.
Tan, H.-M., Pechprasarn, S., Zhang, J., Pitter, M. C., &
Somekh, M. G. (2016). High resolution quantitative
angle-scanning widefield surface plasmon microscopy.
Scientific reports, 6, 20195.
Taylor, A. B., & Zijlstra, P. (2017). Single-molecule
plasmon sensing: current status and future prospects.
ACS sensors, 2(8), 1103-1122.
Zalevsky, Z., Mendlovic, D., & Dorsch, R. G. (1996).
Gerchberg–Saxton algorithm applied in the fractional
Fourier or the Fresnel domain. Optics Letters, 21(12),
842-844.
Surface Plasmons Phase Imaging Microscopy using Deep Learning
39
