
The Development and Psychometric Assessment of Medication
Literacy Scale for Hypertensive Patients
Zhuqing Zhong
1,2,3
, Aijing Luo
2,
*
, Wenzhao Xie
1,2
, Siqing Ding
1,3
, Shuangjiao Shi
1,3
, Yinglong Duan
1
and Feng Zheng
1
1
Third Xiangya Hospital, Central South University, Tongzipo Road, Yuelu District, Changsha 410013, China
2
Key Laboratory of Medical Informatics Research, Central South University, College of Hunan Province,
Changsha 410013, China
3
Xiangya Nursing School, Central South University, Tongzipo Road, Yuelu District, Changsha 410013, China
e_1286761338@qq.com, f_421379895@qq.com, g_1030185308@qq.com
Keywords: Hypertension, Medication Literacy, Scale, Reliability, Validity.
Abstract: Objective: To develop the medication literacy scale for patients with hypertension, and to test the reliability
and validity of the scale. Methods The initial draft of the scale was formulated based on a theoretical
framework of medication literacy with four domains of knowledge, attitude, skill and practice, and developed
through procedures of literature review, expert meetings and consultations, patient interviews and focus group
discussions. In this study, 260 patients with hypertension in Changsha city of China were selected to conduct
a pilot survey. After item selection by a series of statistical analysis method and item re-wording according to
patients’ feedback, the scale was revised to form a formal investigation scale with four domains and 37 items.
A formal investigation was carried out on 650 patients with hypertension selected purposively in a tertiary
general hospital and two community health service centers in Changsha city. The reliability and validity of
the scale were analyzed. Results: Finally, the formal scale consists of four dimensions on knowledge, attitude,
practice and skills, 11 loading factors and 37 items in total. S-CVI of the scale was 0.968, and the I-CVI for
each item ranged from 0.833 to 1.000, indicating good and acceptable content and face validity. The
Cronbach’s α coefficient was 0.849 for the overall scale and ranged from 0.744 to 0.783 for 4 dimensions.
The Pearson correlation coefficient between each of the four dimension and the total scale was 0.530-0.799.
Besides, the Pearson correlation coefficient among each dimension of the scale ranged from 0.157 to 0.439.
The split-half reliability coefficient was 0.893 for the total scale and ranged from 0.793 to 0.872 for four
dimensions. The test-retest reliability coefficient of the total scale was 0.968 and ranged from 0.880 to 0.959
for four dimensions. 11 common loading factors were extracted through exploratory factor analysis, and the
cumulative variance contribution rate of individual domains were 56.111%-64.419%. The confirmatory factor
analysis showed the fit indices of the four-dimension 11-factor model as follows (
2
/df=2.629,GFI=0.804,
AGFI=0.777,RMR=0.012,IFI=0.746,RMSEA=0.066,PNFI=0.599,PCFI=0.689), which indicated
good model fit. Conclusions: The medication literacy scale for hypertensive patients has good reliability and
validity, which is suitable and acceptable for evaluating the medication literacy level of hypertension patients
in China. In the future, English translation of this scale is required, so that this scale can be further validated
and applied worldwide.
1 INTRODUCTION
Medication safety problem has always been the focus
of healthcare providers and public health community
scholars. Researches across the globe reported that
there were certain safety problems in medication
*
Corresponding author
taking process for hypertensive patients (Rahmawati,
2017; Liu, 2016).
Medication literacy is the degree to which individuals
can obtain, comprehend, communicate, calculate and
process patient-specific information about their
medications to make informed medication and health
decisions in order to safely and effectively use their
56
Zhong, Z., Luo, A., Xie, W., Ding, S., Shi, S., Duan, Y. and Zheng, F.
The Development and Psychometric Assessment of Medication Literacy Scale for Hypertensive Patients.
DOI: 10.5220/0008916300560065
In Proceedings of the 13th International Joint Conference on Biomedical Engineering Systems and Technologies (BIOSTEC 2020) - Volume 5: HEALTHINF, pages 56-65
ISBN: 978-989-758-398-8; ISSN: 2184-4305
Copyright
c
2022 by SCITEPRESS – Science and Technology Publications, Lda. All rights reserved

medications, regardless of the mode by which the
content is delivered (e.g. written, oral and visual), and
there are four domains of knowledge, attitude, skill,
and practice included by medication literacy which
were extracted from its definition and connotation
(Sauceda, 2012; Shi, 2019). Safe and correct self-
medication was a leading contributor to the optimal
blood pressure control for hypertensive patients (Hu,
2010), and the effectiveness of medication therapy
depends mainly on patients’ understanding of related
knowledge about medication, attitudes to
antihypertensive medication taking, skills on how
they should administer the prescribed medication as
well as adherent medication taking behavior and
practice with appropriate adverse reaction and blood
pressure monitoring (Shi, 2019). In addition, the
awareness of the utilization of health support system
could be a facilitator to promote hypertensive
patients’ blood pressure control. Therefore, it is of
great significance to assess the level of medication
literacy of hypertensive patients, which could be a
pivotal step to prevent from medication safety
problems, ameliorating the condition of suboptimal
blood pressure control and long-term challenging
disease state. However, there is a dearth of specific
medication literacy scale for hypertensive patients
currently, though several medication literacy
measurements for general population have been
found (Sauceda, 2012; Yeh, 2017; Horvat, 2017).
Hence, based on previous theory research and
analysis on medication literacy, a specific assessment
scale of medication literacy for Chinese hypertensive
patients has been developed in the present study, and
four domains of knowledge, attitude, skill, and
practice were included, the reliability and validity test
were also performed.
2 METHODS
PHASES OF DEVELOPMENT
2.1 Initial Item Pool Establishment
Knowledge-Attitude-Practice model (Alzghoul, 2015),
health belief model (Peng, 2014), plan behavior
theory (Cheng, 2012), health literacy (Sorensen,
2012), and patients’ skills in the medication
administration process were incorporated into
conceptualization of medication literacy. Methods of
derivation, synthesis, and theory analysis developed
by Walker (Butcher, 2006; Walker, 2010)
were used
for nursing theory construction, then medication
literacy was conceptualized and constructed.
According to its definition, in essence, medication
literacy was a recurring process of medication
information acquisition, understanding, evaluation,
and medication administration. Knowledge, skill,
attitude, and practice are four core elements of
medication literacy and are playing critical roles in
different stage of dealing with information of
medication. Based on the concept of medication
literacy and its four core elements, the theoretical
framework of medication literacy for hypertensive
patients was established and the initial item pool of
this scale was identified. Methods for development of
initial item pool: a. related literature review of
existing researches about instruments of general
medication literacy, some items were extracted from
or referred to existing measurements of hypertension
treatment adherence; b. expert panel meeting was
convened, related experts specialized in
cardiovascular research and pharmaceutical research
were invited to examine the clarity of drafted items as
well as each item’s relevance and appropriateness to
its belonging construct. Some inappropriate items
were removed and some highly relevant extra items
suggested by experts were supplemented; c. interview
for hypertensive patients: after items were revised
according to the advises in expert meeting, the items
of the initial assessment scale from above were
applied to the interviews performed to 5 recruited
hypertensive patients. The questions as well as
suggestions about each item of the scale put forward
by participants were recorded, according to which
related items were revised. Then, an initial
assessment scale including 52 items has been
reached; d. focus group discussion: the advices of
experts and the results of interviews for hypertensive
patients were integrated and synthesized through
discussion by research group, then a primary
assessment scale involving 41 items assessing
hypertensive patients’ medication literacy level was
accomplished.
2.2 Content and Face Validity
6 experts have been invited to appraise on the
construct and items of the primary assessment scale
with 41 items in this study. Based on every expert’s
understanding of the definition and connotation of
hypertensive patients’ medication literacy,
constructive amendments and item suggestions were
required to be given. Therefore, supplements,
expurgations, and revisions to some items or contents
could be made accordingly. Inclusion criteria for
experts: a. with over 10 years of work experience in
the cardiovascular department; b. with Doctoral
degree or above; c. with profession title of associate
The Development and Psychometric Assessment of Medication Literacy Scale for Hypertensive Patients
57

professor or deputy director or above; d. experts who
master in the development and psychometric
assessment of a scale; e. experts who were interested
in this research and willing to offer advices or
suggestions. Finally, 2 clinical professionals, 2
nursing professionals, and 2 pharmaceutical
professionals were involved. The authority
coefficient of each expert has been calculated in a
comprehensive way, including experts’ level of
academic research, judgmental basis, and their
familiarity degree to the concept of medication
literacy for hypertensive patients and each item of this
scale. The intended meaning and clarity of each item,
as well as its relevance to its belonging domain were
checked and graded by experts based on response
options of Likert 4 ranking scale (highly relevant,
relevant, slightly relevant, irrelevant), 4 indicating
strong correlation and high relevance between each
item and its corresponding domain and the overall
scale, 3 indicating correlation, 2 identified weak
correlation, and 1 was no correlation. Furthermore,
content validity for each item as well as CVI (content
validity index) was calculated (
Hambleton, 1978;
Martuza, 1977). Significant items were retained
whereas non-significant items were excluded. After
random consistency was calibrated by applying with
Kappa value (K
*
) (Polit, 2007), items with I-CVI
(item level CVI) <0.78 were excluded (Lynn, 1986;
Shi, 2012). The face and content validity were
established at this point.
2.3 Pilot Survey
Purposive sampling was applied, and a total of 260
hypertensive patients from a tertiary hospital and a
community health service center in Changsha city of
China were participated in this pilot survey. Inclusion
criteria: a. diagnosed as hypertension according to the
2016 revised version of guidance for hypertension
prevention and treatment in China, which is systolic
BP>=140mmHg or diastolic BP>=90 mmHg; b. the
patient has been on antihypertensive treatment and
taking antihypertensives for at least 2 weeks, these
included both newly diagnosed and treated
hypertensive patients and those who were already on
antihypertensive medication treatment for a longer
period of time; c. aged over 18; d. who can
communicate with others and have the ability of
reading and comprehension; e. who were willing to
participate in this study and signed the consent forms;
Exclusion criteria: a. who were diagnosed with
psychologically and mentally ill by ICD or have been
on a mental pharmacotherapy; b. who have severe or
acute hypertension or other uncontrolled
cardiovascular and cerebrovascular diseases such as
New York Heart Association Class III or IV heart
failure, or unstable angina. c. who have dementia or
cognitive impairment, severe disease of other organs
or systems, such as cancer. d. Patients with hearing
and communication disability. The language,
understanding and wording as well as construct of the
assessment scale were checked, and questions about
the clarity and accuracy of the expression of items
were recorded. Meanwhile, collected data were
statistically analyzed using IBM SPSS 23.0 for items
selection, so that a complete and final research scale
can be developed. During questionnaire distribution,
participants’ timely feedback on questionnaire
problem was focused on to improve the
questionnaire. Items that were questionable or
confusing for participants were given appropriate
revision or excluded.
In this pilot survey, a total of 252 completed
questionnaires were collected, response rate is
96.60%. Statistical analysis methods of discriminant
and convergent validity such as construct average
factor loading, average variance and correlation
coefficient between two constructs, as well as item
discrimination of t-test, Cronbach’s alpha (α) were
calculated to re-screen items. a. Item Discrimination
analysis: total scores of collected questionnaires were
listed in sequence of numeric value from high to low,
among which 27% of the highest score were defined
as high score group, 27% of the lowest score were
defined as low score group, then independent t-test
was used, the difference of the score of each item
between high score group and low score group was
tested. Considering specialty practicalities, items
with no significant difference between high score
group and low score group were excluded; b.
Correlation Coefficient Method: the Pearson
correlation coefficient between the score of each item
and the overall score of its belonging domain, as well
as the correlation coefficient between the total score
of each domain and the overall score of the whole
scale were calculated. Considering the specialty
practicalities, items with Pearson correlation
coefficient r<0.3 were removed.
2.4 Formal Investigation
In formal investigation stage of this research,
purposive sampling was used. 400 hypertensive
patients were collected from inpatient and outpatient
department of a tertiary hospital, 250 were collected
from 2 community health services center in Changsha
city of China from April to June, 2016. Therefore, a
total of 650 eligible hypertensive patients participated
HEALTHINF 2020 - 13th International Conference on Health Informatics
58

in this research. 650 questionnaires were handed out
and 637 were collected back. The response rate was
98.00%, among which 336 were male participants
(52.7%), aged from 18 to 90, the average age was
(57.49±15.12); married 542 (85.0%); 149 with
education level of primary school or below (23.4%);
462 were employed (72.5%); Duration of
hypertension: 220 (34.5%) participants have been
diagnosed as hypertension for more than 10 years;
Family history of hypertension: 421 (66.1%) with
family history. (Table 1).
Table 1: Patient Characteristics (n=637).
Items Group
N
%
Age (years)* 18~45 131 20.6
46~60 183 28.7
61~90 323 50.7
Gender male 336 52.7
female 301 47.3
Education level Primary and below 149 23.4
Junior middle school 158 24.8
High school 115 18.1
Junior College 81 12.7
College degree and above 134 21.0
Annual Household
income Chinese RMB
(¥)
<10,000/year 112 17.6
10,000~29,999/year 131 20.6
30,000~49,999/year 171 26.8
50,000~99,999/year 101 15.9
≧100,000/year
122 19.2
Marital status married 542 85.0
unmarried 35 5.5
Divorced or widowed 60 9.5
Occupational status employed 462 72.5
retired 133 20.9
unemployed 42 6.6
Registered residence urban 380 59.7
countryside 257 40.3
Duration of
hypertension
<3years 187 29.4
3- years 82 12.9
5- years 146 22.9
≧10 years
220 34.5
Family history of
hypertension
yes 421 66.1
no 216 33.9
*The mean for age was 57.49 years with a standard
deviation of 15.12.
2.4.1 Validity Test
Content validity and Construct Validity were checked
and tested. Content validity was assessed by
calculating the content validity index of each item (I-
CVI) and the content validity index of the whole scale
(S-CVI), which have been figured out according to
the results of expert panel consultation. Construct
validity was assessed by calculating related indexes
of exploratory factor analysis and confirmatory factor
analysis. Convergent validity was assessed by
calculating average factor loading of a construct. The
validity for a construct was established if the average
factor loading was greater than 0.7. Discriminant
validity was also identified by calculating the average
variance and squared correlation coefficient between
two constructs. Discriminant validity for a construct
was established if average variance was greater than
squared correlation coefficient (Streiner, 1995;
Bowling, 2009). The exploratory factor analysis and
confirmatory factor analysis were applied to identify
and confirm the construct and principal components
of the scale. Amidst the 637 responses, half of the data
was used to explore factor structure, and the rest half
of the data was used to confirm factor structure with
fit indices. Absolute fit indices namely χ
2
/df,
goodness of fit (GFI), absolute goodness of fit
(AGFI), root mean square error of approximation
(RMSEA) and standardized root mean square
residual (SRMR) was calculated, a good model fit
was highlighted by these indices (Jöreskog, 1993). In
addition, incremental fit indices (IFI), parsimony fit
index including PNFI, PCFI were also noted. A value
of GFI, AGFI, and IFI was > 0.90, RMR < 0.05, IFI
over 0.9, indicate good model fit. For RMSEA, the
value ranges from 0.08 to 0.10 indicates acceptable
model fit, value ranges from 0.05 to 0.08 suggests
moderate model fit, value less than 0.05 shows great
model fit. Generally, RMSEA, SRMR values < 0.07
indicate good model fit. (Pett, 2003; Hair, 2009;
Shima, 2015). A value for parsimony fit index (PNFI,
PCFI) > 0.5 was considered satisfactory (Mulaik,
1989). χ
2
/df was an absolute fit index. For the χ
2
/df,
the smaller of the value, the better of the model fit,
and χ
2
/df<3 indicates a good model fit. (Knowledge
cited from Chinese statistics book). Structure
equation modeling was carried out using IBM SPSS
AMOS version 25.
2.4.2 Reliability Test
Internal consistency was assessed using Cronbach’s
alpha (α) values. A value of 0.5 or greater was
considered acceptable (
Sushil and Verma, 2010). Split-
half reliability was also calculated. The test-retest
The Development and Psychometric Assessment of Medication Literacy Scale for Hypertensive Patients
59

reliability was measured by Pearson’s correlation
coefficient (ρ) between two time-points with a gap of
2 weeks in 40 randomly collected hypertensive
patients. A value of (ρ) more than 0.75 and p-value <
0.05 was considered significantly strong correlation
(Lahey, 1983; Cohen, 1988; De Vellis, 1991).
2.4.3 Scoring Criteria
This research scale measured medication literacy
level of hypertensive patients across four domains
namely knowledge about hypertension disease,
treatment, and antihypertensive medication, attitude,
skill and practice for medication administration. For
items in domains of knowledge and skill, answering
right for each item scores 1, and answering wrong
scores 0. A 5-point Likert response option for each
item in domains of attitude and practice was used, in
which scores of 1.0, 0.75, 0.5, 0.25, 0 were applied
(totally agree, agree, not sure, disagree, totally
disagree; always, often, sometimes, seldom, never).
In addition, there were 5 items in the attitude
domain and 1 item in practice domain scoring
reversely. The summed total score on this 37-item
scale ranged from 0 to 37, with higher scores
indicating higher medication literacy level.
3 RESULTS
3.1 Scale Construct and Items
Generation
An initial entry pool of 52 items was established in
this study at the beginning, then the primary
medication literacy scale for hypertensive patients
with 41 items was developed after 11 items were
excluded through the focus group discussion.
Subsequently, scale with 39 items for pilot survey has
been formed after 2 items being excluded according
to suggestions generated from the 2-round expert
consultation. Finally, 2 items with low discrimination
were excluded after analysis of item discrimination
and correlation coefficient method on the collected
data from pilot survey. (item A4: I am willing to try
traditional popular prescription; item A10:I worry
about the side effects of long-term antihypertensive
treatment). After pilot study and item re-screening, a
formal medication literacy scale for hypertensive
patients has been accomplished, and 4 domains with 37
items were identified. Knowledge domain (K) includes
9 items, attitude domain (A) involves 8 items, skill
domain (S) 7 items, and practice domain (P) 13 items.
3.2 Validity Analysis
3.2.1 Content and Face Validity
Based on the expert panel feedback, 2 items in the
attitude domain were removed. The results showed
that the individual authority coefficient of each expert
ranged from 0.79 to 0.97, the integrated authority
coefficient of all experts was 0.92. The expert
positive coefficient in two rounds of expert
consultation was 1. The I-CVI (Item Level Content
Validity Index) of each item ranged from 0.833-
1.000; the S-CVI (Scale Level Content Validity
Index)for the knowledge domain of the scale was
0.962, S-CVI for the attitude domain was 0.979, S-
CVI for the practice domain was 0.961, S-CVI for the
skill domain was 0.976; the S-CVI for the total
medication literacy scale was 0.968, and the K
*
values
of each item were over 0.74, indicating that good
validity assessment for items were identified.
3.2.2 Exploratory Factor Analysis
Exploratory factor analysis (EFA) was conducted.
Principle component analysis with Varimax rotation
was employed to analyze the construct and factor
structure of this scale and each domain. 257 collected
data were randomly abstracted from total
questionnaires of 637 to conduct the exploratory
factor analysis for the scale. Therefore, the construct
and component factor of the total scale and its each
domain were identified. The Kaiser-Meyer-Olkin
(KMO) measure of sampling adequacy was reported
at 0.765, 0.766, 0.713, and 0.808 with significant
result for Bartlett’s test of sphericity, i.e., p-value <
0.001. A 4-domain model construct of this scale was
obtained with eigenvalues above 1.0. For
demonstration of a clear model structure, items with
factor loadings greater than 0.4 on a component, and
non-salient loading less than 0.4 on other components,
were considered as a single domain (Zwick, 1986;
Toll, 2007). Domain 1 (knowledge) contained 9 items,
domain 2 (attitude) contained 8 items, domain 3 (skill)
contained 7 items and domain 4 (practice) contained
13 items. There were 3 common factors extracted
from knowledge domain and its cumulative variance
contribution rate was 64.419%, 4 items loaded on
factor 1 measured knowledge for antihypertensive
medication, factor 2 contains 3 items that measured
knowledge for hypertension disease, factor 3 had 2
items that measured knowledge for hypertension
treatment (Table 2). 2 common factors were extracted
from attitude domain and its cumulative variance
contribution rate was 60.914%, 5 items loaded on
HEALTHINF 2020 - 13th International Conference on Health Informatics
60

factor 1 measured patients’ attitude to
antihypertensive medication, factor 2 had 3 items that
represented attitude to hypertension disease (Table 3).
4 common factors were extracted from practice
domain and its cumulative variance contribution rate
was 59.474%, 4 items loaded on factor 1 represented
antihypertensive compliance behavior, factor 2 had 3
items that measured medication decision making
behavior, 3 items loaded on factor 3 represented
patients’ disease control behavior and adverse effects
surveillance after medication administration as well
as blood pressure monitoring practice, factor 4
contained 3 items that represented antihypertensive
medication information-seeking and dissemination
behavior (Table 4). 2 common factors were extracted
from skill domain and the cumulative variance
contribution rate was 56.111%, 4 items loaded on
factor 1 measured patients’ ability of reading and
comprehension for the prescription and medication
instruction, factor 2 contained 3 items that measured
patients’ ability to numeric calculation for dosage of
medication, medication administering or prescription
refill time (Table 5). This 4-domain with 11 factors
model was then confirmed in the rest sample by
conducting a confirmatory factor analysis (CFA).
Table 2: Exploratory Factor Analysis on Knowledge
Dimension of ML for Hypertensive Patients (n=257).
Items
Factors
1 2 3
K1
0.688
K2
0.867
K3
0.813
K4
0.614
K5
0.866
K6
0.776
K7
0.747
K8
0.761
K9
0.795
Eigenvalues
2.473 2.008 1.317
Variance
contribution
rate (%)
27.481 22.306 14.631
Factors
designation
Sub-
domain 1
Sub-
domain 2
Sub-
domain 3
Note: ML: Medication Literacy K: Knowledge dimension
of ML; KMO (Kaiser-Meyer-Olkin) Measure of Sampling
Adequacy Value=0.765,Bartlett’s test:
2
(Chi square test
value) =627.670; df (degree of freedom) =36; P=0.000.
Table 3: Exploratory Factor Analysis on Attitude
Dimension of ML for Hypertensive Patients(n=257).
Items
Factors
1 2
A1 0.690
A2 0.826
A3 0.808
A4 0.763
A5 0.776
A6 0.767
A7 0.727
A8 0.785
Eigenvalues 2.971 1.902
Variance contributio
n
rate (%)
37.134 23.780
Factors designation Sub-domain 1 Sub-domain2
Note: A: Attitude dimension of ML; KMO Measure of
Sampling Adequacy Value=0.766, Bartlett’s test:
2
(Chi
square test value) =723.104; df (degree of freedom) =28;
P=0.000.
Table 4: Exploratory Factor Analysis on Practice
Dimension of ML for Hypertensive Patients (n=257).
Items
Factors
1 2 3 4
P1 0.489
P2 0.652
P3 0.671
P4 0.789
P5 0.722
P6 0.713
P7.1 0.766
P7.2 0.803
P7.3 0.766
P7.4 0.757
P8 0.476
P9.1 0.659
P9.2 0.654
Eigenvalues 2.512 1.988 1.762 1.469
Variance
contribution
rate (%)
19.327 15.294 13.553 11.300
Factors
designation
Sub-
domain 1
Sub-
domain 2
Sub-
domain
3
Sub-
domain
4
Note: P: Practice dimension of ML; KMO Measure of
Sampling Adequacy Value=0.713, Bartlett’s test:
2
(Chi
square test value) =874.831; df (degree of freedom) =78;
P=0.000.
The Development and Psychometric Assessment of Medication Literacy Scale for Hypertensive Patients
61
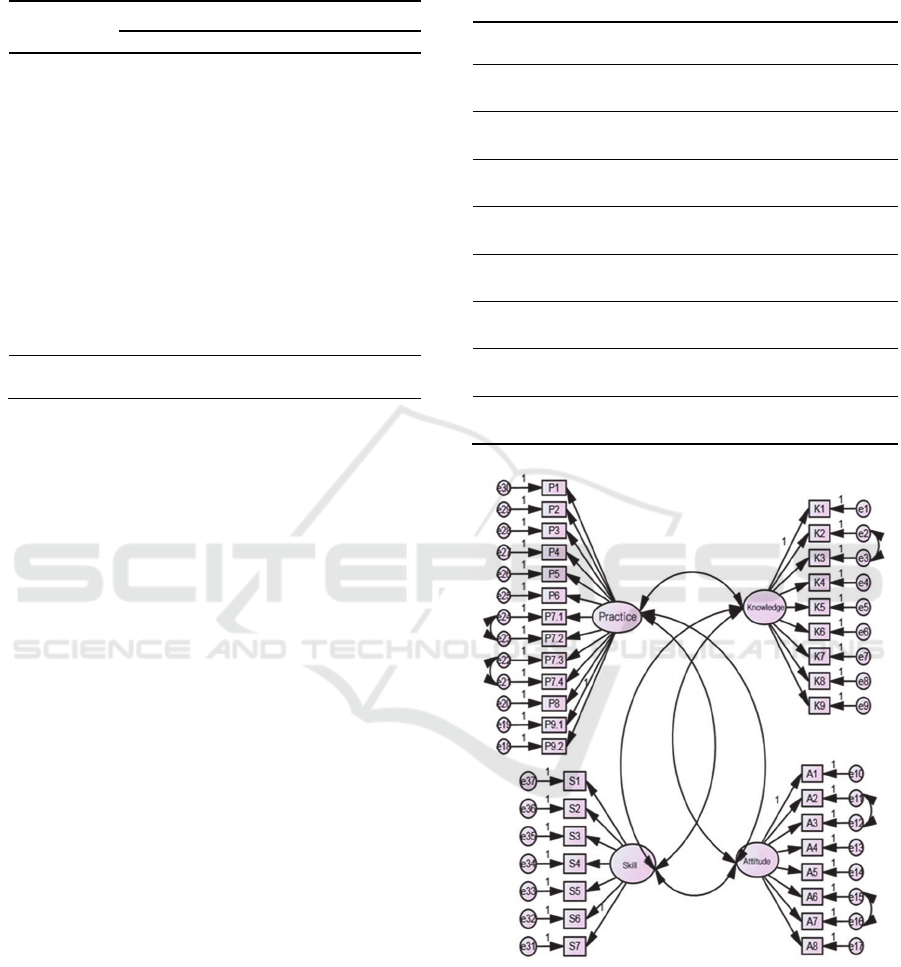
Table 5: Exploratory Factor Analysis on Skill Dimension of
ML for Hypertensive Patients (n=257).
Items
Factors
1 2
S1
0.704
S2
0.750
S3
0.643
S4
0.600
S5
0.789
S6
0.739
S7
0.821
Eigenvalues
2.275 1.653
Variance
contribution
rate (%)
32.503 23.608
Factors
designation
Sub-domain 1 Sub-domain 2
Note: S: Skill dimension of ML; KMO Measure of
Sampling Adequacy Value=
0.808, Bartlett’s test:
2
(Chi
square test value)
=373.837; df
(degree of freedom)
=21;
P=0.000
.
3.2.3 Confirmatory Factor Analysis
380 questionnaires, of the rest part of the 637
collected questionnaires, were used to test the 4-
domain with 11 factors model of the scale. Fit indices
were calculated. The values obtained for fit indices in
CFA were; IFI = 0.746, i.e., near to 0.9. The value for
RMSEA and RMR was 0.066 and 0.012, respectively,
i.e., less than 0.07. The values for GFI, AGFI were
0.804, 0.777, and values for PCFI and PNFI were
0.689 and 0.599, i.e., > 0.50. In our results, the value
of χ
2
/df was 2.629, i.e, < 3. All these values confirmed
an acceptable 4-domain 11-factor model fit (Table 6),
and the structure equation modeling was showed in
Figure 1. For convergent validity and discriminant
validity, in our results for this scale, the average factor
loadings for each construct were reported larger than
0.7. Therefore, the convergent validity was
established; the average variance and squared
correlation coefficients between two constructs were
also calculated and the results showed that the
average variance values between every two
constructs were greater than their respective squared
correlation coefficients. This means that the
discriminant validity was identified.
3.3 Reliability Analysis
The Cronbach’s α coefficient, split-half reliability,
and test-retest reliability coefficient of the total scale
Table 6: The Results of Fitting Indices of Confirmatory
Factor Analysis of 11-Factor Model of Medication Literacy
Assessment Scale for Hypertensive Patients (n=380).
Parameters 11-factor model
χ
2
/df 2.629
GFI 0.804
AGFI 0.777
RMR 0.012
IFI 0.746
RMSEA 0.066
PCFI 0.689
PNFI 0.599
Figure 1: Structure equation modeling of 4-domain with 11
factors for medication literacy scale.
and among each domain on knowledge, attitude,
practice, and skill were measured. The overall
reliability of the scale for 37 items was 0.849. All
items were positive correlated with each other. The
Cronbach’s α coefficients among each domain ranged
from 0.744 to 0.783. The split-half reliability
coefficient for the overall scale was 0.893, among
HEALTHINF 2020 - 13th International Conference on Health Informatics
62

each domain ranged from 0.793-0.872. The test-retest
Pearson’s correlation coefficient for the overall scale
was 0.968, among each domain of the scale ranged
from 0.880-0.959 (P-value < 0.01). (Table 7). The
Pearson correlation coefficient between each domain
and the overall scale ranged from 0.530-0.799
(P<0.01), and the Pearson correlation coefficient
among domains ranged from 0.157-0.439 (P<0.01).
(Table 8). Therefore, good reliability of this scale was
confirmed.
Table 7: The Reliability Coefficients of the Total Scale and
among Each Dimension of Medication Literacy
Assessment Scale for Hypertensive Patients (n=637).
Dom
ains
Items Cronbach's
α
coefficient
Split-half
reliability
Test-
retest
reliability
KL 9 0.754 0.816 0.958
AL 8 0.783 0.872 0.959
PL 13 0.744 0.809 0.928
SL 7 0.763 0.793 0.880
ML 37 0.849 0.893 0.968
Table 8: Correlation Analysis between Each Domain of
Medication Literacy and the Overall Assessment Scale for
Hypertensive Patients (n=637).
ML KL AL PL SL
ML 1
KL 0.799
**
1
AL 0.530
**
0.283
**
1
PL 0.746
**
0.439
**
0.334
**
1
SL 0.653
**
0.370
**
0.157
**
0.216
**
1
Note: **. Statistically significant Correlation with each
other at level of 0.01(bilateral).
ML: Medication Literacy; KL: Knowledge Literacy; AL:
Attitude Literacy; PL: Practice Literacy; SL: Skill Literacy.
4 DISCUSSION
This is the first study to develop and validate a self-
reporting medication literacy scale specific for
hypertensive patients, though, there were several
existing medication literacy scales for general
population, for example, Medication Literacy
Assessment Scale in Spanish and English
(MedLitRxSE) (Sauceda, 2012); Chinese Medication
Literacy Measure (ChMLM) (Yeh, 2017);
Medication Literacy Assessment Questionnaire
(Horvat, 2017). For hypertensive patients, adherence
to prescribed medication regimen and taking
antihypertensives in a correct and safe way are
prerequisites for achieving optimal blood pressure
control. Medication literacy presents the knowledge
and attitude to hypertension disease, treatment and
antihypertensive therapy, as well as the skill and
practice of taking antihypertensives in a correct and
safe way. Therefore, medication literacy level
assessment for hypertensive patients can be the first
step to target gaps and patients’ problems of
pharmacotherapy, so that targeted counselling and
interventions to prompt persistent, correct and safe
antihypertensive therapy for patients could be
implemented. The item generation in the
development of the medication literacy scale for
hypertensive patients was mainly based on a concept
framework of medication literacy with four domains
on knowledge, attitude, skill and practice. A
comprehensive literature review about relevant
literatures and existing medication literacy research
tools was also conducted. Subsequently, an expert
meeting, interviews for hypertensive patients, and
focus group discussion for appraising the generated
items were initiated and ended up with 41 items. After
that, 6 experts were invited to have a content and face
validity evaluation on the primary scale with 41
items, 2 items were removed by the experts. The
measurement purification was carried out by item re-
screen through statistical analysis with pilot study.
Item discrimination analysis and correlation
coefficient method were used to rescreen items, after
which 2 items in the attitude domain were excluded.
Finally, a scale with 37 items based on 4 domains
were utilized to give a formal investigation in a
sample of 650 participants. The evaluation of the
scale was determined by study validity and reliability.
Content validity and construct validity were
measured. A qualified scale requires I-CVI over 0.78,
K
*
over 0.74, and S-CVI over 0.9. In this study, the
CVI of each item were over 0.78, and K
*
over 0.74;
S-CVI for the scale was 0.968 and for each domain
ranged from 0.961-0.979. Therefore, good content
validity of this newly developed medication literacy
scale for hypertensive patients has been confirmed.
For construct validity, the scale was subjected to
exploratory factor analysis (EFA) and confirmatory
factor analysis (CFA). 4-domain 11-factor modeling
was explored and was then confirmed by subsequent
CFA. The extracted 11 common factors from four
domains of medication literacy scale for hypertensive
patients were fundamentally identified in accordance
with theory assumption of medication literacy and
EFA results, which can be well interpreted by
specialty practicalities. Besides, the cumulative
variance contribution for each domain ranged from
56.111%-64.419%.
The Development and Psychometric Assessment of Medication Literacy Scale for Hypertensive Patients
63

In the confirmatory factor analysis, χ
2
/df, GFI,
AGFI, RMR, IFI, RMSEA, PCFI and PNFI were
calculated to test model fit in this study. In this study
for the developed scale, the χ
2
/df<2, the value of fit
indices for GFI, AGFI and IFI were close to 0.9;
RMR were less than 0.05 and RMSEA were less than
0.07; PCFI and PNFI were greater than 0.5. All these
values indicated an acceptable model fit. Therefore,
the construct validity of this scale was confirmed
well.
In this study, the internal consistency of this scale
was measured. The Cronbach’s α coefficient of the
overall scale for 37 items was 0.849. This was higher
than alpha value reported by ChMLM scale among
general population in Taiwan (Yeh, 2017)
, i.e., 0.72,
and was also higher than the total test reliability
reported by 14-item English and Spanish
MedLitRxSE tool for general population (Sauceda,
2012), i.e., (English: KR-20 = 0.81; Spanish: KR-20
= 0.77). In our results, the Cronbach’s α value for
individual domains ranged from 0.744 to 0.783,
indicating a good internal consistency in this scale.
The split-half reliability coefficient for the overall
scale was 0.893, for its individual domains ranged
from 0.793 to 0.872, indicating good split-half
reliability of this scale. The test-retest reliability was
0.968, greater than 0.9, and for its individual domains
were from 0.880 to 0.959 (P<0.001). In addition, this
scale demonstrated a high acceptability among
hypertensive patients with a response rate of 96.6%
and 98%. Therefore, this newly developed scale is
easy to use and fill in, which is pragmatic and
applicable in assessing hypertensive patients’
medication literacy.
The strengths established in this study: the
developed scale is available in Chinese language,
high patient acceptability, a rigorous and scientific
procedure of measurement purification, validated and
reliable constructs.
The validation of this newly developed
medication literacy scale for hypertensive patients in
other sample of population of China is still needed.
Besides, English translation and validation is also
required for its international utilization.
5 CONCLUSIONS
A newly self-reporting medication literacy scale for
hypertensive patients was developed in Chinese
language. The measurement property of this scale has
been established, in which good reliability and
validity was confirmed, suggesting its
appropriateness and applicability to measure
medication literacy level for Chinese hypertensive
patients. Future study will be focused mainly on two
aspects: first, English translation is needed, so that
this scale application can be further validated
worldwide; Then, large-scale investigation of
hypertensive patients’ medication literacy in China
based on this scale is needed, so associated factors of
hypertensive patients’ medication level could be
found.
REFERENCES
Alzghoul Bashar I,Abdullah Nor Azimah Chew. Pain
Management Practices by Nurses: An Application of
the Knowledge, Attitude and Practices (KAP) Model.
[J]. Global journal of health science, 2015, 8(5).
Bowling, A. (2009). Research Methods in Health:
Investigating Health and Health Services, 3rd Edn.
London: Open University Press.
Butcher H K. Book Review: Strategies for Theory
Construction in Nursing (4th ed.) [J]. Nurs Sci Q, 2006,
19 (2): 174-180.
Cheng Fang, Shi Huanhuan, Wang Wei. Theory of Planned
Behavior and its application in nursing research
worldwide[J]. Journal of Nursing Science, 2012, 27 (8):
91-94.
Cohen, J. S. (1988). Statistical power analysis for the
behavioral sciences, 2nd Edn. New Jersey, NJ:
Lawrence Erlbaum Associates Inc.
De Vellis, R. F. (1991). Scale Development: Theory and
Applications, 26th Edn. Thousand Oaks, CA: Sage.
Horvat N, Vidic L, Kos M. Development and content
validation of Medication Literacy Assessment
Questionnaire [J]. International Journal of Clinical
Pharmacy, 2017, 39 (3): 606-606.
Hu Dayi. The Social Practice Significance of the
"Guidelines for Prevention and Treatment of
Hypertension in China" (2009 Grass-roots Edition) [J].
China J hypertension, 2010, 18(1): 9-10.
Hambleton RK, Swaminathan H, Algina J, etal. Criterion-
referenced testing and measurement: Review of
technical issues and developments [J]. Rev Educat Res,
1978, 48(1):11–22.
Hair, J. F. Jr., Black, W. C., and Babin, B. J. (2009).
Multivariate Data Analysis. Anderson RE, 7th Edn.
New York, NY: Prentice Hall.
Jöreskog, K., and Long, J. S. (1993). “Introduction,” in
Testing Structural Equation Models, eds A. Kenneth, J.
Bollen, and J. Scott Long (Newbury Park CA: Sage).
Liu He, Xu Shuiyang, Wang lei, et al. The health literacy
and influencing factor of hypertension patients (15-69
years old) in Zhejiang province [J]. Chinese Journal of
Prevention and Control of Chronic Diseases, 2016, 24
(5): 343-347.
Lahey, M. A., Downey, R. G., and Saal, F. E. (1983).
Intraclass correlations: there’s more there than meets
HEALTHINF 2020 - 13th International Conference on Health Informatics
64

the eye. Psychol. Bull. 93, 586–595. doi: 10.1037/0033-
2909.93.3.586.
Lynn MR. Determination and quantification of content
validity [J]. Nursing Res, 1986, 35(6):382–385.
Martuza VR. Applying norm-referenced and criterion-
referenced measurement in education [M]. Boston:
Allyn and Bacon, 1977:275–293.
Mulaik, S. A., James, L. R., Van Alstine, J., Bennet, N.,
Lind, S., and Stilwell, C. D. (1989). Evaluation of
goodness-of-fit indices for structural equation models.
Psychol. Bull. 105, 430–445. doi: 10.1037/0033-
2909.105.3.430.
Peng Xiangdong, Zhu Yongqiang, Sa Zhihong, et al.Health
behavior theory: from health belief model to risk
perception and health behavior decision making
[J].Chinese Journal of Health Education, 2014, 30 (6):
547-548.
Polit DF, Beck CT, Owen SV. Is the CVI an acceptable
indicator of content validity? Appraisal and
recommendations [J]. Res Nurs Health, 2007,
30(4):459–467.
Pett, A. M., Lackey, N. R., and Sullivan, J. J. (2003).
Making Sense of Factor Analysis: The use of Factor
Analysis for Instrument Development in Health Care
Research. Thousand Oaks, CA: Sage. doi:
10.4135/9781412984898.
Rahmawati R, Bajorek B V. Self-medication among people
living with hypertension: a review [J]. Family Practice,
2017, 34 (2):1-7.
Shi S J, Shen Z Y, Duan Y L, et al. Association Between
Medication literacy and medication adherence among
patients with hypertension [J]. Frontiers in
Pharmacology, 2019, 10:822. doi:
10.3389/fphar.2019.00822.
Sauceda J A, Loya A M, Sias J J, et al. Medication literacy
in Spanish and English: psychometric evaluation of a
new assessment tool [J]. Journal of the American
Pharmacists Association, 2012, 52 (6): e231-e240.
Sorensen K,Van den Broucke S, Fullam J,et al. Health
literacy and public health: A systematic review and
integration of definitions and models[J]. BMC Public
Health, 2012, 12 (1): 1-13.
Shi Jingcheng, Mo Yakun,Sun Zhengqiu.Content validity
index in scale development[J].Journal of Central South
University (Medical Science) , 2012, 37 (2): 152-155.
Yeh Y C, Lin H W, Chang E H, et al. Development and
validation of a Chinese medication literacy measure [J].
Health Expect, 2017, 20 (6): 1296-1301.
Sushil, S., and Verma, N. (2010). Questionnaire validation
made easy. Eur. J. Sci. Res. 46, 172–178.
Streiner, D. L., and Norman, G. R. (1995). Health
Measurement Scales: A Practical Guide to their
Development and use, 2nd Edn. New York, NY:
Oxford University Press Inc.
Shima, R., Farizah, H., and Majid, H. A. (2015). The 11-
item Medication Adherence Reasons Scale: reliability
and factorial validity among patients with hypertension
in Malaysian primary healthcare settings. Sing. Med. J.
56, 460–467. doi: 10.11622/smedj.2015069.
Toll, B. A., McKee, S. A., Martin, D. J., Jatlow, P., and
O’Malley, S. S. (2007). Factor structure and validity of
the Medication Adherence Questionnaire (MAQ) with
cigarette smokers trying to quit. Nicot. Tob. Res. 9,
597–605. doi: 10.1080/14622200701239662.
Walker L, Avant K. Strategies for Theory Construction in
Nursing, CourseSmart eTextbook [J]. Pearson Schweiz
Ag, 2010, 44 (44): 434-436.
Wu Minglong. Structural equation model: AMOS's
operation and application [M]. Chongqing: Chongqing
University Press, 2009.
Zwick, W. R., and Velicer, W. F. (1986). Comparison of
five rules for determining the number of components to
retain. Psychol. Bull. 99, 432–442. doi: 10.1207/
s15327906mbr1702_5.
The Development and Psychometric Assessment of Medication Literacy Scale for Hypertensive Patients
65
