
Geo-localization using Ridgeline Features Extracted from
360-degree Images of Sand Dunes
Shogo Fukuda
1
, Shintaro Nakatani
2
, Masashi Nishiyama
2
and Yoshio Iwai
2
1
Graduate School of Sustainability Science, Tottori University, Tottori, Japan
2
Graduate School of Engineering, Tottori University, Tottori, Japan
Keywords:
Geo-localization, Ridgelines, 360-degree Images, Sand Dune.
Abstract:
We propose a method to extract the features of sand-dune ridgelines using a 360-degree camera to improve
the accuracy of estimating geo-locations. It is difficult to estimate geo-locations in an outdoor environment
with almost no texture such as in sand dunes. We focus on the feature of the ridgeline, which is the boundary
between the ground region and the sky region. A 360-degree camera can quickly detect the ridgeline signal
in all directions in a sand dune. Our method determines the current location by searching for the nearest
ridgeline signal from target signals and pairing with their geo-locations. We evaluated the accuracy of this
geo-localization method using synthesized images generated from a digital elevation model. We also eval-
uated it using real 360-degree images collected in sand dunes. We confirmed that our method significantly
outperformed the existing geo-localization method on both synthesized and real images.
1 INTRODUCTION
Geo-localization systems have attracted attention to
increase the use of tourism resources. A geo-
localization system can guide users to specific loca-
tions and provide digital content suitable for each lo-
cation. To guide users accurately, there is a need for
a technique to estimate the geo-location of a user. In
this paper, we discuss how to estimate geo-locations
in an outdoor environment that is nearly textureless.
We consider sand dunes, which are a noted tourist re-
source of Tottori prefecture in Japan. In sand dunes,
simple and similar textures are widely spread. Thus,
we have to carefully consider how to accurately esti-
mate the geo-locations.
Many existing methods for estimating geo-
locations have been proposed. Here, we classify
the existing methods into three types. In the first
type (Li et al., 2015; Hofmann-Wellenhof et al., 2001;
Groves, 2013), the location is acquired using a GNSS
(Global Navigation Satellite System) such as GPS or
GLONASS. The existing methods have a problem in
that the accuracy of the geo-location estimation de-
pends on the arrangement and number of satellites
that are observed from the location of the user. In
the second type (Kim et al., 2017; Brejcha and
ˇ
Cad
´
ık,
2017; Lowry et al., 2016), the geo-location is esti-
mated using texture patterns in the images acquired
from a camera. We must consider that outliers fre-
quently occur when simple and similar textures repeat
in a sand dune environment. In the third type (Piasco
et al., 2018; Chen et al., 2018; Dusha and Mejias,
2012), the accuracy of estimating the geo-location is
improved using both GNSS and the camera. These
existing methods set the initial location using GNSS
and determine the current location using the image
acquired from the camera. These methods should im-
prove the accuracy compared with the methods that
use only GNSS or a camera. However, the difficult
problem of little texture still remains in sand dune en-
vironments.
Our aim is to improve the accuracy of geo-location
estimation in a nearly textureless outdoor environ-
ment. We investigate robust features that can be de-
tected from the images of sand dunes. The images in-
clude two regions, the ground and the sky. The ground
region is covered with sand, so it is unsuitable for fea-
ture extraction because there is little texture. The sky
region contains many objects, such as clouds and the
sun, that disturb the feature extraction because these
always move over time. Hence, it is difficult to use ei-
ther region to improve the accuracy of estimating geo-
location. In this paper, we focus on the feature of the
ridgeline, which is the boundary between the ground
region and the sky region. Existing methods (Saurer
et al., 2016; Baatz et al., 2012; Nicolle et al., 2017;
Fukuda, S., Nakatani, S., Nishiyama, M. and Iwai, Y.
Geo-localization using Ridgeline Features Extracted from 360-degree Images of Sand Dunes.
DOI: 10.5220/0008914306210627
In Proceedings of the 15th International Joint Conference on Computer Vision, Imaging and Computer Graphics Theory and Applications (VISIGRAPP 2020) - Volume 5: VISAPP, pages
621-627
ISBN: 978-989-758-402-2; ISSN: 2184-4321
Copyright
c
2022 by SCITEPRESS – Science and Technology Publications, Lda. All rights reserved
621
Porzi et al., 2016) have introduced ridgelines that are
robust to changes in vegetation, illumination, and sea-
son in the outdoor environment. We assume that the
ridgelines work effectively even in a nearly texture-
less environment such as sand dunes. Note that the
existing methods are designed using a general cam-
era with a limited angle of view to extract the fea-
tures. We need to consider that ridgelines spread to
all 360-degree directions in sand dunes. It cannot be
said that the existing methods are sufficient to repre-
sent the features of the ridgelines.
In this paper, we propose a method to extract the
features of the ridgelines using a 360-degree cam-
era. Our aim is to improve the accuracy of geo-
localization in sand dunes. The 360-degree camera
can quickly acquire an image containing all angles of
the view and can easily detect the ridgelines of all di-
rections. We regard the ridgelines as continuous sig-
nals and extract their amplitude components as fea-
tures. Our method sets the search range of the geo-
location using the initial location obtained by GNSS
and determines the current location by searching for
the nearest ridgeline feature. To confirm the effec-
tiveness of our method, we evaluated the accuracy of
the geo-location estimation using synthesized images
generated from a digital elevation model. Further-
more, we collected the 360-degree images of a sand
dune environment and confirmed that our method im-
proves accuracy.
This paper is organized as follows. Section 2 de-
scribes the details of our method, Section 3 presents
the results of a preliminary experiment using GNSS,
Section 4 describes the results of geo-localization us-
ing the synthesized images, and Section 5 describes
the result of the evaluation using real 360-degree im-
ages. Our concluding remarks are given in Section 6.
2 ESTIMATION OF
GEO-LOCATION USING
RIDGELINE SIGNALS
2.1 Ridgelines in a Sand Dune
Environment
A ridgeline generally refers to a narrow area of high
land along the top of a line of hills. In this pa-
per, the ridgeline refers to the boundary between the
ground region and the sky region in the image ac-
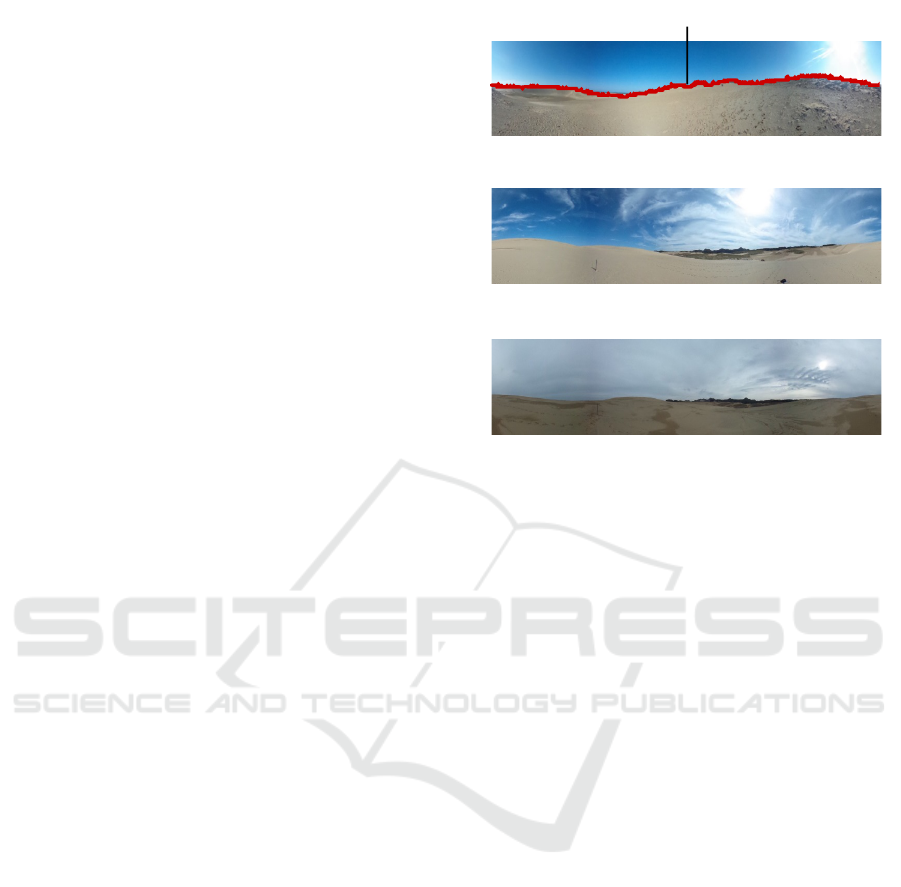
quired from a 360-degree camera. Figure 1(a) shows
an example of a ridgeline. We represent a ridgeline as
a one-dimensional waveform signal. When the user
moves, parallax occurs between the ridgeline signals
Ridgeline
(a)
(b)
(c)
Figure 1: Example of a ridgeline detected from a 360-
degree image of a sand dune environment (a). Two 360-
degree images acquired under different weather conditions
(b) and (c).
observed before and after movement. Therefore, we
can use the ridgeline signals as features when esti-
mating geo-location. We discuss the characteristics
of the ridgelines below. A sand dune does not change
its shape rapidly over time because of coastal con-
servation activities. There are no obstacles such as
buildings at most locations on the sand dunes. Fur-
thermore, it is difficult to see the buildings that stand
several kilometers away because of the height differ-
ence in the sand dunes. We thus can stably observe
the parallax included in the ridgeline signals in all di-
rections. There is also an advantage in that the ridge-
lines can be easily detected from 360-degree images
because the textures of the ground and sky regions are
very different. Figures 1(b) and (c) show examples
of 360-degree images acquired from the sand dunes.
Given the above characteristics, we believe that geo-
localization using ridgeline signals works effectively
in sand dune environments.
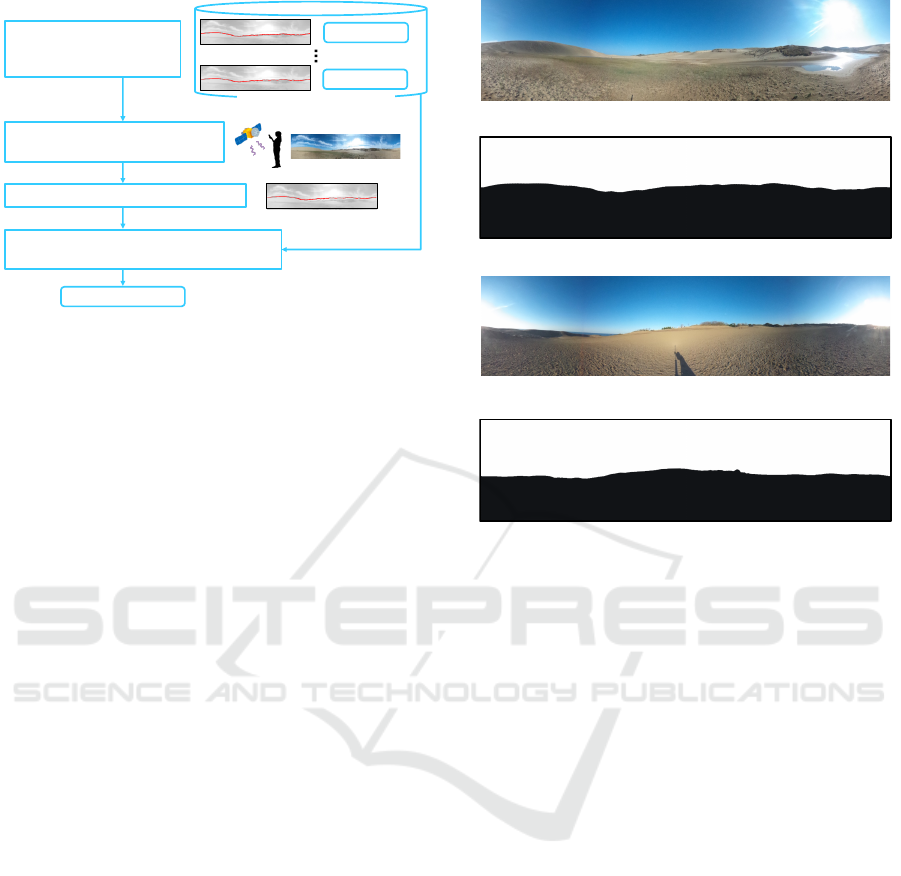
2.2 Overview of Our Method
Figure 2 illustrates an overview of our method. In
step S1, we generate a target database to store the
pairs of ridgeline signals and their geo-locations. The
system collects a 360-degree image at each location
in the sand dune area and detects the ridgeline sig-
nal in advance. Steps S2 to S4 are used to estimate
the geo-location of the user. In step S2, the user ac-
quires a query 360-degree image using the camera
VISAPP 2020 - 15th International Conference on Computer Vision Theory and Applications
622
Geo-location
S2: Obtain an initial location and
a query 360-degree image
S1: Store target ridgeline
signal and
geo-locations
S3: Detect the query ridgeline signal
S4: Search for the nearest target ridgeline
signal using the PSD features
Target ridgeline signals
Location N
Location 1
Figure 2: Overview of our method. We set the search range
of the geo-location using the initial location obtained by
GNSS and detect the current position by searching for the
nearest ridgeline signal.
and his or her initial location using GNSS. In step S3,
our method detects the ridgeline signal from the 360-
degree image. We divide the 360-degree image into
the sky and ground regions using color distributions,
and determine the region boundary to detect the ridge-
line signal. In step S4, we determine the geo-location
by searching for the target ridgeline signal that is most
similar to the query ridgeline signal. It is not practi-
cal to search through all ridgeline signals contained in
the target database. Instead, our method searches only
the neighborhood of the initial location acquired from
GNSS by limiting the search range in the database.
Our aim is to prevent outliers and reduce processing
time. Our method determines the search range using
the error of the initial location (see Section 3). The
search for ridgeline signals is described in detail be-
low.
2.3 Searching for the Nearest Target
Ridgeline Signals using Power
Spectrum Density (PSD) Features
Our method searches for the target ridgeline signal
that has the waveform that is most similar to the given
query ridgeline signal. To accurately search for the
ridgeline signal, it is necessary to consider the varia-
tion of camera poses when acquiring the 360-degree
images. Recently available 360-degree cameras have
various tilt correction functions, which suppresses the
variation in attitude. To more stably extract fea-
tures from ridgeline signals, our method uses the PSD
(Power Spectrum Density). The PSD is a frequency-
based analysis and is represented by the power spec-
trum components for each frequency band. The fre-
quency analysis assumes that the query signal is a
(a)
(b)
(c )
(d)
Figure 3: Examples of 360-degree images acquired from a
real camera (a) and (c). Synthesized images generated from
the digital elevation model (b) and (d).
continuous waveform, so it has a high affinity with the
ridgeline signal acquired from a 360-degree image.
The PSD also has the advantage of not being affected
by phase shift. Note that we remove the components
of the frequency band above f
max
because high fre-
quency components sometimes contain noise when
detecting ridgeline signals. Our method determines
the target ridgeline signal corresponding to the query
ridgeline signal when the L1 norm between the two
PSD features is the smallest. Our method outputs the
final geo-location linked to the target ridgeline signal.
3 PRELIMINARY EXPERIMENT:
THE ERROR OF THE INITIAL
LOCATION OBTAINED BY
GNSS
Our method uses GNSS to set the search range
for the target ridgeline signals from the initial lo-
cation. To determine this range, we investigated
how much error occurs in commonly available GNSS
terminals. We used a mobile terminal (GARMIN:
GPSMAP64SJ) that records the current position using
GPS, GLONASS, and QZSS. We measured known
Geo-localization using Ridgeline Features Extracted from 360-degree Images of Sand Dunes
623
location points managed by the Geospatial Informa-
tion Authority of Japan, which are generally used
for map making and various topographical surveys.
We acquired the current values of the latitude and
longitude using the mobile terminal at each known
point and compared them with the correct latitude and
longitude values of the known point. We computed
the error in distance between the current estimated
point and the known point using these values. Three
known points (L010000001070, TR35334212403,
and TR45334214401) were used. We performed one-
minute measurements three times on sunny days. The
results of the evaluation show that the estimation er-
ror of the initial location using GNSS is 2.5 ± 1.3 m.
In the following experiments, we set the search range
of the target ridgeline signals to a radius of 5 m from
the initial location, which is a margin of 2σ of the es-
timation error for the search range.
In recent years, RTK-GPS (Langley, 1998; Odijk
et al., 2017) has attracted attention because it is a
highly accurate GNSS and a low-cost device. The
RTK-GPS system uses a reference station on the
ground and corrects the estimated locations using po-
sitioning satellites. We set the reference station less
than 5 km of the known points. Here, we evaluated
the estimation error of the current locations using the
single-band RTK-GPS (NEO-M8T, u-blox). We con-
firmed that the estimation error was within several
tens of centimeters when the RTK-GPS system ob-
tained fixed solutions. However, it was necessary to
wait for several tens of seconds while standing the
same location to obtain the fixed solution. Further-
more, there were some cases where the fixed solution
could not be obtained even after waiting a long time.
We believe that the use of RTK-GPS is still premature.
We thus used the estimation error computed from the
commonly available GNSS terminal to determine the
search range of the target ridgeline signal.
4 BASIC PERFORMANCE OF
GEO-LOCALIZATION
EVALUATED USING THE
SYNTHESIZED IMAGES
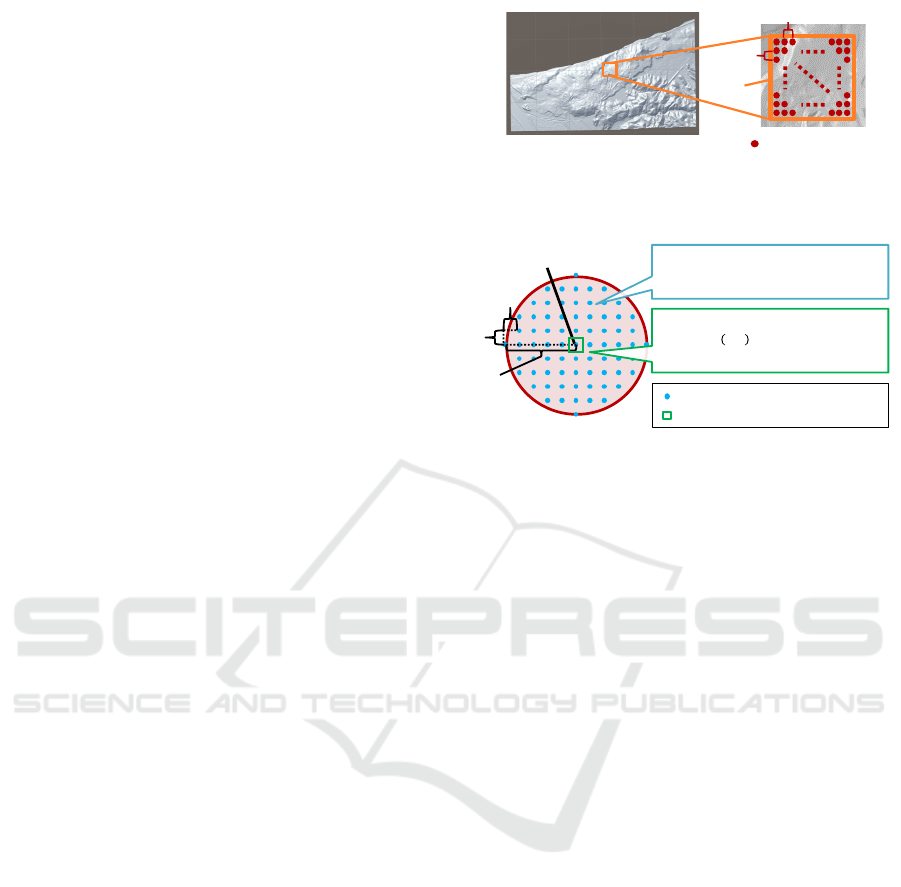
4.1 Dataset Generated from the Digital
Elevation Model
We generated synthesized images of the ridgeline sig-
nals using the digital elevation model (hyo, 2 12)
provided by the Geospatial Information Authority of
Japan. The model contains three-dimensional meshes
Digital Elevation Model (5 m
mesh)
25 m
25 m
Evaluation point
Region
Figure 4: Evaluation points on the digital elevation model
of sand dunes.
5 m
Initial location (!
"
, #
"
)
1 m
1 m
Location of the target ridgeline signal
Range of the query ridgeline signal
Target:
Radius of 5 m in intervals of 1 m from
initial location$%!
"
&#
"
'
Test:
Location !(& #( ) %!
"
* +
,
& #
"
*+
-
'
+
,
& +
-
. /0123& 1234 uniform random noise
Figure 5: Locations used to generate the synthesized images
at certain evaluation points.
at intervals of 5 m. We generated the synthesized im-
ages of the ridgelines using graphics rendering en-
gine (Unity). Figures 3(a) and (c) show real 360-
degree images, and Figs. 3(b) and (d) show synthe-
sized images assuming the same location as the real
images. When generating the synthesized images, we
rendered the ground regions as black and the sky re-
gions as white. We generated a 360-degree image by
connecting the center pixel rows of candidate images.
We made a candidate image of each orientation by ro-
tating a camera with a field angle of θ by A. The pa-
rameter settings θ = 100 degrees and A = 0.5 degrees
were adjusted by comparing the synthesized image
with the waveform of the actual 360-degree image.
The resolution of the synthesized image was set to
720 × 180 pixels.
We used an area of a 500× 500 m square to gener-
ate the synthesized images. Figure 4 shows the eval-
uation points on the digital elevation model. We set
20 × 20 = 400 evaluation points on a 25-m grid. At
each evaluation point, synthesized images for the tar-
get and query were generated. Figure 5 shows the
locations used to generate the synthesized images at
a certain evaluation point. In the 5 m radius from an
initial position (x
c
, y
c
), which represents the center of
the search range described in Section 2.3, 73 synthe-
sized target images were generated at locations in in-
tervals of 1 m. The 10 synthesized query images were
generated at an initial location ( ˆx, ˆy) with uniform ran-
dom noise (ε
x
, ε
y
) in the range [−0.5, 0.5]. The height
of the camera from the ground surface was fixed at a
height of 100 cm.
VISAPP 2020 - 15th International Conference on Computer Vision Theory and Applications
624
4.2 Results for Synthesized Images
We compared the accuracies of several geo-
localization methods to confirm the effectiveness of
our method by evaluating them using the synthesized
images. We extracted features using the following
methods:
• Existing Method. We extracted the histogram
features of the ridgelines for geo-localization us-
ing the existing method (Saurer et al., 2016).
The ridgeline signals were divided into small seg-
ments. The distributions of gradients of contours
in the segments were computed to generate the
contour words, which are similar in spirit to visual
words. We set the number of the contour words to
32.
• Baseline. We used the fast Fourier transform
(FFT) to extract features from the ridgeline sig-
nals. The FFT is a representative approach of
frequency analysis. We used the amplitude com-
ponents as the feature, and set the maximum fre-
quency band of 15 Hz to increase the accuracy.
• Our Method. We used the PSD features of the
ridgeline signals. The maximum frequency band
was f
max
= 15.
We used the 360-degree images of the ridgelines syn-
thesized in Section 4.1. All experimental conditions
except for the features were the same for all three
methods. We computed the Euclidean distance from
the ground-truth location to the estimated location at
each evaluation point. The errors of the geo-locations
were calculated at all evaluation points and their av-
erages are reported.
Table 1 shows the average errors of the geo-
localization evaluated using the synthesized images
of the digital elevation model. We confirmed that
our method obtained higher accuracy than the existing
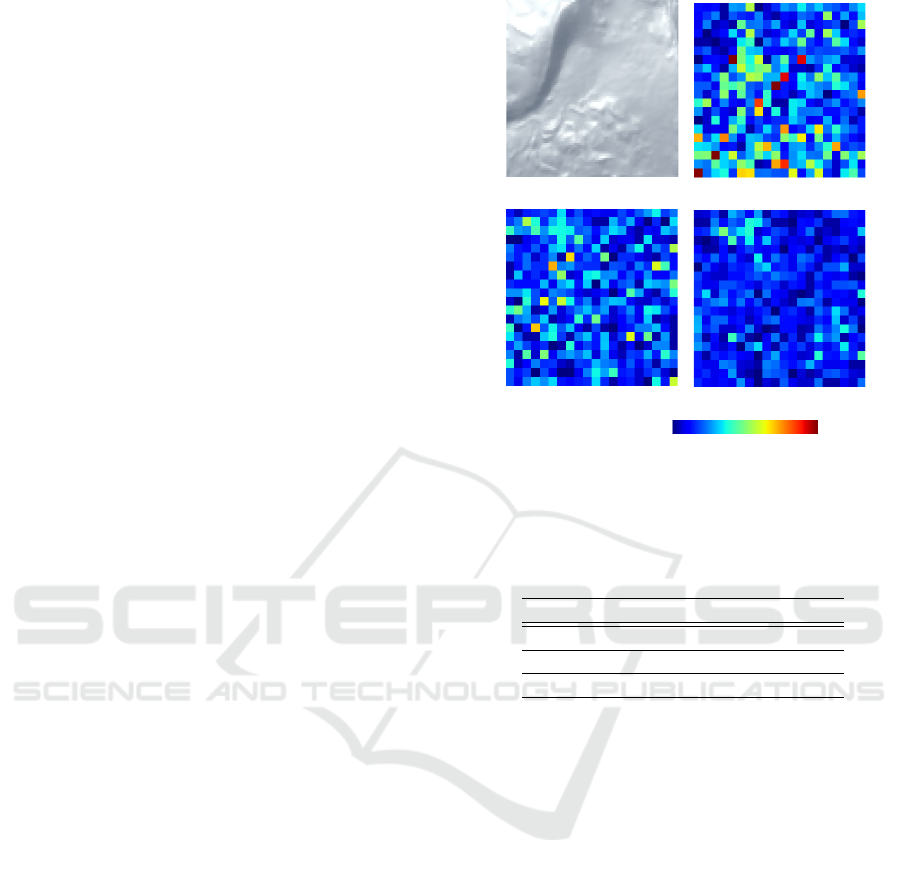
method and the baseline. We visualized the average
errors of the evaluation points with a heatmap. Fig-
ure 6(a) shows the area including all evaluation points
on the digital elevation model. In Figs. 6(b), (c), and
(d), the heatmaps of the average errors for the exist-
ing method, the baseline, and our method are repre-
sented, respectively. We see that the existing method
(Fig. 6(b)) and the baseline (Fig. 6(c)) yielded large
errors for many evaluation points. In contrast, we
confirmed that our method (Fig. 6(d)) was able to esti-
mate the geo-location at 1 m or less at most evaluation
points, although the average errors were still large at
some points. We discuss the reason for these large
errors below.
(a) (b)
(c) (d)
30Average error [m]
Figure 6: Visualization of the average errors at all evalua-
tion points. (a) The three-dimensional shape of the all eval-
uation points when viewed from above. The average errors
of the (b) existing method, (c) baseline, and (d) our method.
Table 1: Average errors of the geo-localization evaluated
using the synthesized images of the digital elevation model.
Average error [m]
Existing method 0.79 ± 0.95
Baseline 0.60 ± 0.75
Our method 0.42 ± 0.60
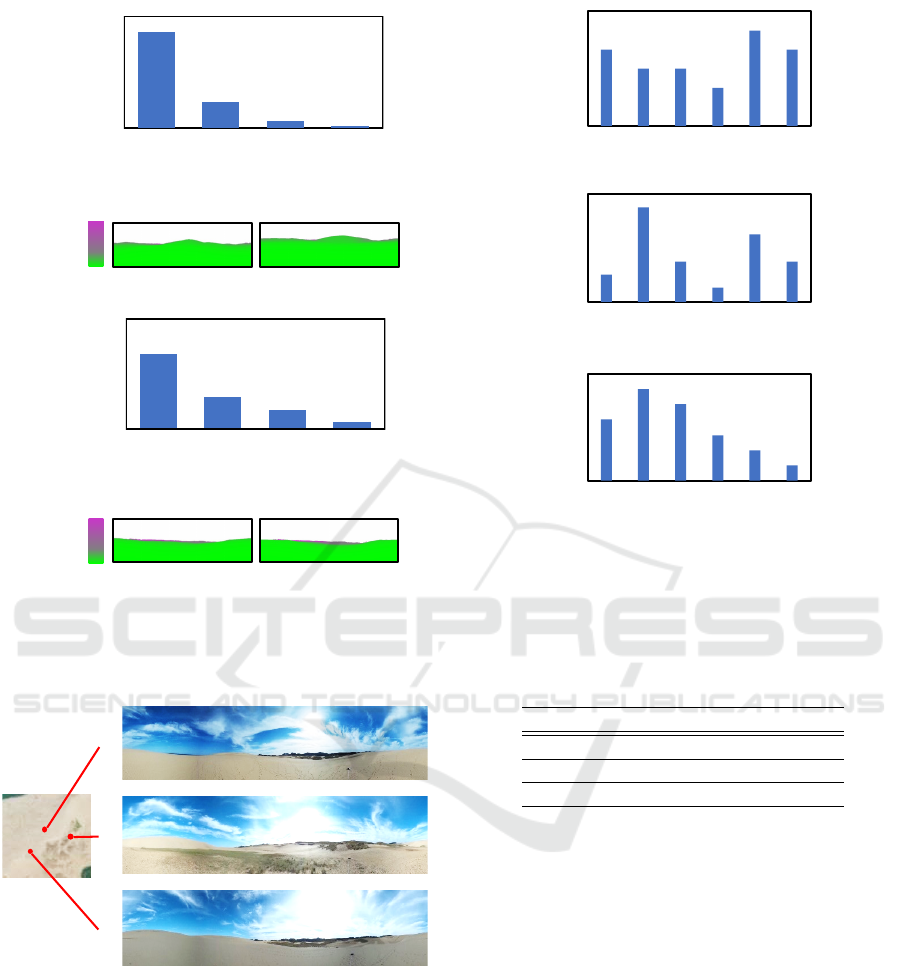
4.3 Discussion of the Errors of
Geo-localization using Our Method
We investigated the locations at which the accuracy of
the geo-localization decreases. We hypothesized that
the errors are large when the ridgeline signals con-
tain deep depth values and the parallax is very small.
We generated histograms of the depth values of the
rendered ridgeline signals for evaluation points with
good accuracy and poor accuracy and compared them.
Figure 7 shows the distribution of depth values on the
top-10 and bottom-10 ridgelines with respect to evalu-
ation point accuracy. We see that the distributions for
low-accuracy points tend to have deeper depth values
on the ridgeline signals than the distributions for high-
accuracy points. In fact, we found that there are many
low-accuracy evaluation points on the top of a sand
dune. We believe that the top of a sand dune has a
good view and distant mountains are observed, so the
change in parallax of the ridgeline signals decreases.
Geo-localization using Ridgeline Features Extracted from 360-degree Images of Sand Dunes
625
Depth of the ridgeline (m)
800
0
6,000
0
3,000
(0, 250) (250, 500) (500, 750) (750,∞]
(a)
(c)
(b)
(d)
(0, 250) (250, 500] (500, 750) (750, ∞]
Depth of the ridgeline (m)
Frequency
Depth (m)
6,000
0
3,000
Frequency
800
0
Depth (m)
Figure 7: Distribution of depths on ridgelines and depth
maps. (a) and (c) Depth distribution of the 10 most and
least accurate evaluation points. (b) and (d) Depth maps of
the most and least accurate evaluation points.
A
B
C
Figure 8: Examples of real 360-degree images. The target
and query images were acquired from each area of the sand
dunes.
5 EVALUATION USING REAL
360-DEGREE IMAGES
We evaluated the accuracy of our method using actual
360-degree images collected in the sand dune envi-
ronment. We used piles managed by Tottori prefec-
ture to determine the locations where the 360-degree
0 42 31 5
Frequency
Average error (m)
(c)
0
9
0 42 31 5
Frequency
Average error (m)
(b)
0
9
0 42 31 5
Frequency
Average error (m)
(a)
0
9
Figure 9: Distributions of the errors of the geo-localization
evaluated using the real 360-degree images. Results for the
(a) existing method, (b) baseline, and (c) our method.
Table 2: Average errors of geo-localization evaluated using
real 360-degree images collected in a sand dune environ-
ment.
Average error [m]
Existing method 3.62 ± 1.84
Baseline 2.42 ± 1.72
Our method 1.81 ± 1.44
images were acquired. The piles were struck in a
grid every 100 m. We defined three areas, each cen-
tered on a pile, and collected the 360-degree images
in each area. Figure 8 shows examples of real 360-
degree images, taken using a 360-degree camera (RI-
COH THETA m15) and a tripod. To generate a target
database of ridgeline signals, we collected 19× 3 = 57
target images per meter in the range of ±9 m to the
north starting from each pile. We collected 9× 3 = 27
query images per meter in the range of ±4 m to the
north. The resolution of the 360-degree image was
set to 720 × 180 pixels. We manually detected the
ridgeline signals using a graphics editor (Adobe Pho-
toshop). The search range of the target database was
set to ±5 m. The ridgeline signal feature extraction
process was the same as that described in Section 4.2.
Table 2 shows the average errors of the geo-
localization obtained using real 360-degree images.
The results show that our method obtains a smaller
VISAPP 2020 - 15th International Conference on Computer Vision Theory and Applications
626

average error (less than 2 m) than the existing method
and baseline.
We investigated how much the error was dis-
tributed for each feature. Figure 9 shows the distri-
butions of the errors of the geo-localization using the
real 360-degree images. In the results of the existing
method (Fig. 9(a)) and baseline (Fig. 9(b)), the peaks
of the distributions have an error of 4 m. In contrast,
in our method (Fig. 9(c)), almost all cases had errors
less than 1 m, though there were a few cases with er-
rors of 5 m. The above results confirm that the pro-
posed PSD features extracted from the ridgeline sig-
nals are effective for geo-localization.
6 CONCLUSIONS
We proposed a method for estimating geo-location us-
ing ridgeline features extracted from 360-degree im-
ages. We evaluated the accuracy of the proposed geo-
localization method using synthesized images gener-
ated from a digital elevation model. We confirmed
that our method substantially outperformed the exist-
ing method. Furthermore, we conducted an experi-
ment to evaluate geo-location using real 360-degree
images collected in the sand dunes. We confirmed
that the average error of our method was less than 2
m.
In future work, we will further evaluate our
method on various datasets of with low texture us-
ing 360-degree cameras. We will also explore the use
of synthesized images to create a target database to
reduce the cost of database generation.
REFERENCES
(Reference 2019-2-12). Digital Map five meter Grid (Ele-
vation), Geospatial Information Authority of Japan.
Baatz, G., Saurer, O., K. K
¨
oser, K., and Pollefeys, M.
(2012). Large scale visual geo-localization of images
in mountainous terrain. In Proceedings of the Euro-
pean Conference on Computer Vision, pages 517–530.
Brejcha, J. and
ˇ
Cad
´
ık, M. (2017). State-of-the-art in visual
geo-localization. Pattern Analysis and Applications,
20(3):613–637.
Chen, X., Hu, W., Zhang, L., Shi, Z., and Li, M. (2018).
Integration of low-cost gnss and monocular cameras
for simultaneous localization and mapping. Sensors
18(7) 2193.
Dusha, D. and Mejias, L. (2012). Error analysis and atti-
tude observability of a monocular gps/visual odome-
try integrated navigation filter. International Journal
of Robotics Research, pages 1–41.
Groves, P. D. (2013). Principles of gnss, inertial, and mul-
tisensor integrated navigation systems. Artech House.
Hofmann-Wellenhof, B., Lichtenegger, H., and Collins, J.
(2001). Global positioning system theory and prac-
tice. Springer-Verlag Wien.
Kim, H. J., Dunn, E., and Frahm, J. (2017). Learned con-
textual feature reweighting for image geo-localization.
In Proceedings of the IEEE Conference on Computer
Vision and Pattern Recognition (CVPR), pages 3251–
3260.
Langley, R. B. (1998). Rtk gps. In GPS WORLD, pages
70–76.
Li, X., Zhang, X., Ren, X., Fritsche, M., Wickert, J.,
and Schuh, H. (2015). Precise positioning with cur-
rent multi-constellation global navigation satellite sys-
tems: Gps, glonass, galileo and beidou. Scientific Re-
ports, 5(8328):1–14.
Lowry, S., Sunderhauf, N., Newman, P., Leonard, J. J.,
Cox, D., Corke, P., and Milford, M. J. (2016). Vi-
sual place recognition: A survey. IEEE Transactions
on Robotics, 32(1):1–19.
Nicolle, L., Bonneton, J., Konik, H., Muselet, D., and
Tougne, L. (2017). Towards an electronic orientation
table: using features extracted from the image to reg-
ister digital elevation model. In Proceedings of the
International Conference on Computer Vision Theory
and Applications, pages 28–38.
Odijk, D., Nadarajah, N., Zaminpardaz, S., and Teunissen,
P. J. G. (2017). Gps, galileo, qzss and irnss differen-
tial isbs: estimation and application. GPS Solutions,
21(2):439–450.
Piasco, N., Sidibe, D., Demonceaux, C., and Gouet-Brunet,
V. (2018). A survey on visual-based localization: On
the benefit of heterogeneous data. Pattern Recogni-
tion, 74:90 – 109.
Porzi, L., Rota, B. S., and Ricci, E. (2016). A deeply-
supervised deconvolutional network for horizon line
detection. In Proceedings of the 24th ACM Interna-
tional Conference on Multimedia, pages 137–141.
Saurer, O., Baatz, G., K
¨
oser, K., Ladick
´
y, L., and Polle-
feys, M. (2016). Image based geo-localization in
the alps. International Journal of Computer Vision,
116(3):213–225.
Geo-localization using Ridgeline Features Extracted from 360-degree Images of Sand Dunes
627
