
Towards a Model-based Fuzzy Software Quality Metrics
Omar Masmali and Omar Badreddin
Department of Computer Science, The University of Texas, El Paso, Texas, U.S.A.
Keywords: Model Driven Engineering, Software Quality Metrics, UML Class Diagram, Software Design, Code Smells.
Abstract: Code smells and Technical debt are two common notions that are often referred to for quantifying codebase
quality. Quality metrics based on such notions often reply on rigid thresholds and are insensitive to the project
unique context, such as development technologies, team size, and the desired code qualities. This challenge
often manifest itself in inadequate quantification of code qualities and potentially numerous false positives
cases. This paper presents a novel approach that formulates code quality metrics with thresholds that are
derived from software design models. This method results in metrics that, instead of adopting rigid thresholds,
formulates unique and evolving thresholds specific to each code module. This paper presents the novel
methodology and introduces some novel code quality formulas. To evaluate the proposed formulas, we
evaluate them against open source codebase developed by experienced software engineers. The results suggest
that the proposed methodology results in code quality quantification that provides more adequate
characterization.
1 INTRODUCTION
One important goal of software engineering is to
deliver software systems that can be sustainably
maintained for extended period of time. Software
becomes unsustainable often due to deficiencies in its
design or code (Badreddin, 2018) (Badreddin, 2019).
Software longevity maximizes returns and justifies
efforts in design and testing. The code lines at the
heart of any software systems represent significant
intellectual investments by professionals often with
unique domain expertise. Engineers must develop
systems efficiently and address key requirements, and
do so while ensuring that the software system is
scalable to address future users’ needs and
requirements. Unfortunately, it is not uncommon that
software becomes prohibitively expensive to
maintain. Software codes tends to accumulate
arbitrary complexities that obscure knowledge and
make maintenance more challenging. Engineers,
under pressure to deliver functioning systems on time
and within budget, often take shortcuts and deliver
code, while may address immediate users’ needs, may
not be suitable to adapt to evolving requirements in
the future. Therefore, it is paramount to be able to
track code quality characteristics throughout the
software lifecycle.
Quality quantification methodologies reply on
desired code characteristics, such as size of code
modules, the number of dependencies between
modules, and more. Violation of those desired
characteristics suggest that future maintenance of the
codebase will require more time and effort. An
important notion of such metrics are code smells.
Large Class and Large Parameter List are example of
such code smells (Badreddin, and Khandoker, 2018).
For example, a Class that is more than 750 lines of
code is determined to suffer from Large Class Code
smell, suggesting that the Class is too big in size, and
efforts to comprehend and maintain its code will be
challenging.
Code quality metrics that reply on code smells and
technical debt suffer from key fundamental
limitations. First, such methodologies are insensitive
to software project unique contextual elements such
as, project priorities, development technologies,
maturity level, and expertise of its developers. These
metrics operate under the one-size-fits assumption
that a quality metric is applicable to all software
modules at all times. Second, these metrics do not
evolve over time to appropriately consider the
evolving code base size and its indented life time. A
software system developed to serve as a prototype
should not be subject to the same quality metrics for
one that is intended to be sustained for an extended
Masmali, O. and Badreddin, O.
Towards a Model-based Fuzzy Software Quality Metrics.
DOI: 10.5220/0008913701390148
In Proceedings of the 8th International Conference on Model-Driven Engineering and Software Development (MODELSWARD 2020), pages 139-148
ISBN: 978-989-758-400-8; ISSN: 2184-4348
Copyright
c
2022 by SCITEPRESS – Science and Technology Publications, Lda. All rights reserved
139
period of time. Similarly, the quality of a codebase
that is expected to be subject to extensive
maintenance should be measured differently than
code that is unlikely to be changed overtime. Third,
prevalent quality metrics are largely independent of
the intended software design specifications. For
example, a software module designed to perform
significant computations may appear to violate key
quality metrics. This violation, however, is
intentional as per the design specification.
This paper presents a methodology to address
some of these limitations as follows. First, the
methodology defines code quality metrics with
thresholds that are derived from software design. This
approach means that metrics can evolve as the
codebase design evolve throughout the software
lifecycle. Moreover, this approach means that each
code module will have its own unique quality metrics
that are tailored to its unique context.
2 MOTIVATIONAL EXAMPLE
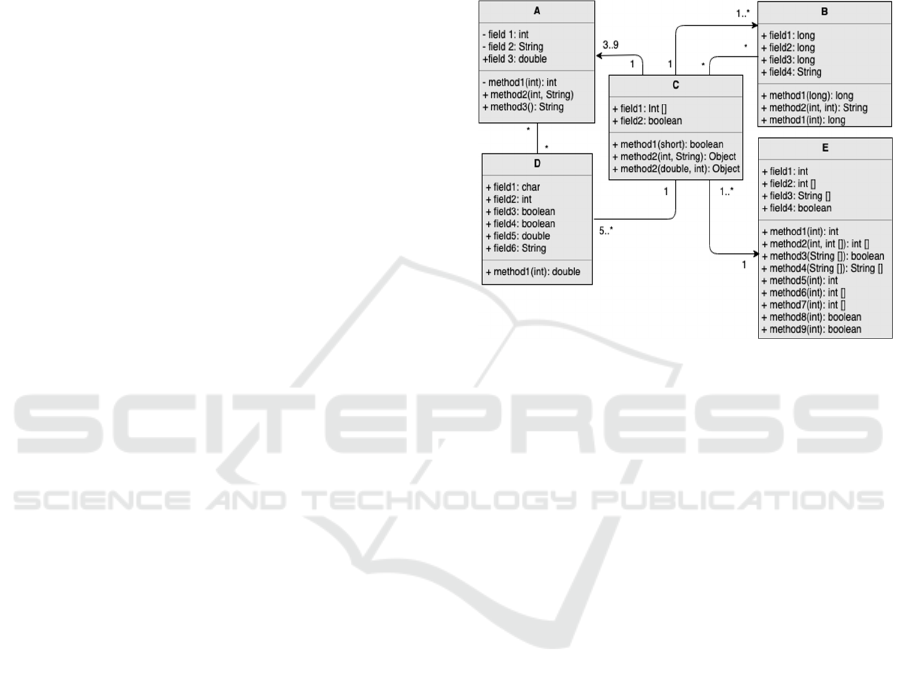
To demonstrate the proposed approach of deriving
complexity measures from software design, consider
the following simplified UML class diagram (Figure
1). The class diagram shows a data-heavy class (Class
D), computational heavy Class (Class E), and some
associations between classes. While the
implementation of this model follows the design very
closely, efforts to quantify code health returns
significantly low sustainability quantification. For
example, because Class D is data-heavy, its size in
terms of lines of code is very small resulting in Lazy
Class code smell (Taibi, 2017). Similarly, the Class C
is designed to access many methods and attributes in
other classes (it is participating in five associations).
The code analysis of Class C returns God Class code
smell (Vidal, 2016). Large Parameter List code smell
was also found in method 1 in Class D. This is
arguably because the Class is designed to have many
data fields but only a single method to operate on
these fields.
Contemporary code analysis approaches that
uncovers code smells are agnostic to the intentions of
the software designers as evident in the provided
UML Class diagram. The analysis did not consider to
what extent the implementation is aligned with the
design. The identified code smells are frequently not
an indication of unsustainable code but are rather is a
direct result from the intentional design. Class D is
Lazy because it is designed to host data and perform
little computations. Class C is Large and has access
to many external entities because it is designed as a
root element. Similarly, Smells of Large Parameter
list is misleading because the class to which these
methods belong to are data-heavy and as a result, its
method has legitimate reason to use large number of
parameters. Recommended code refactorings to
remove the code smells will inevitably suggest
refactorings that are difficult to implement without
violating the design.
Figure 1: UML Class Diagram Example.
More importantly, the aforementioned smells are
only detectable after the significant effort of
developing the codebase. Meaning, the development
teams are informed of the deficiencies after they have
manifested with little upfront guidance. The team has
the only option of implementing potentially time
consuming refactorings to minimize the smells.
3 PROPOSED QUANTIFICATION
APPROACH
The proposed metrics are derived from the design by
estimating complexity rating for each Class, which
itself is estimated from the complexity rating of the
Class attributes and methods in that Class. Each Class
element has its own unique complexity rating based
on its data type and visibility (for attributes),
parameter list size, type, and return type (for
methods). In the following, we present the element
complexity rating and the metrics formula.
3.1 Element Complexity Rating
Table 1 illustrates elements complexity rating. These
ratings are used as input to the proposed metrics
discussed in the following section to rate the
complexity of each element.
MODELSWARD 2020 - 8th International Conference on Model-Driven Engineering and Software Development
140
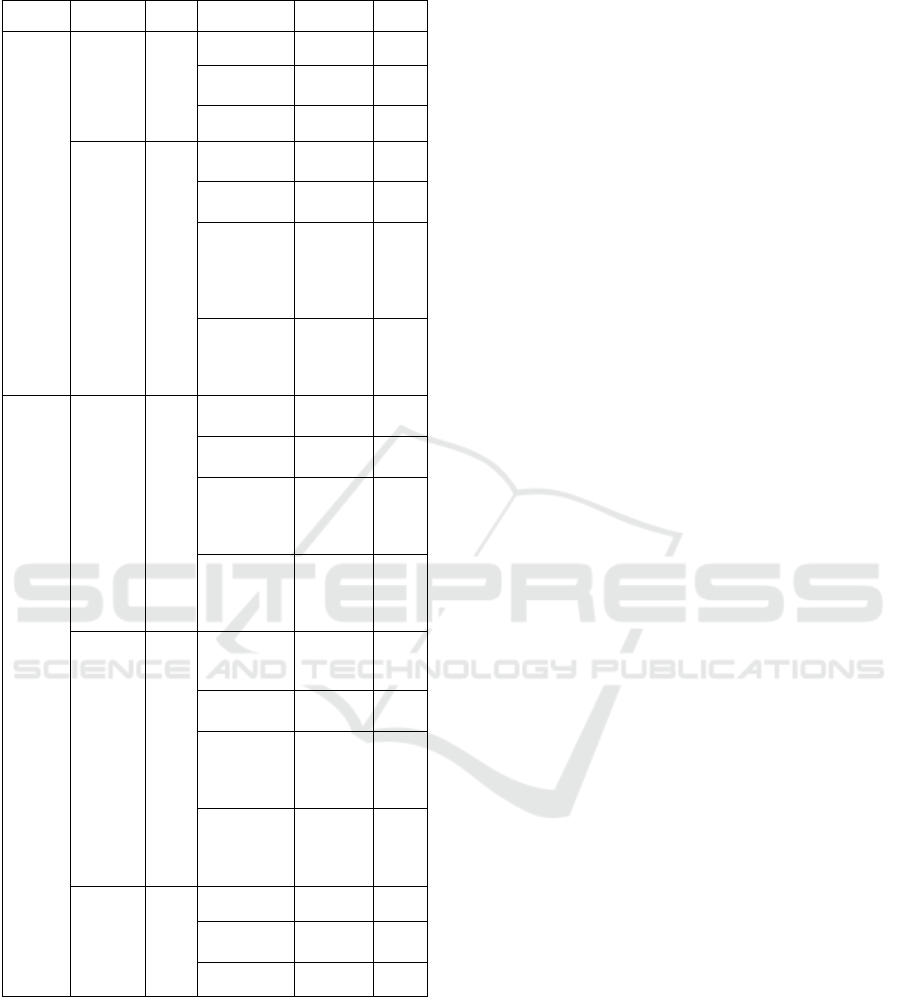
Table 1: Attributes and Methods Complexity Rating.
Element Scope Name Classification Examples Rating
Attributes
Visibility
Primitive Private 1
Simple
Protected,
Package
2
Complex Public 3
Type
Primitive
int, char,
b
oolean
1
Simple
float, long,
double, st
r
2
Complex
array,
struct,
tuple, date,
time, list,
map
3
Derived
object,
array of
complex
types
4
Methods
Parameters
.
Primitive
int, char,
b
oolean
1
Simple
float, long,
double, st
r
2
Complex
array,
struct,
tuple, date,
time, list
3
Derived
object,
array of
complex
types, map
4
Return
Type
.
Primitive
int, char,
boolean,
voi
d
1
Simple
float, long,
double, st
r
2
Complex
array,
struct,
tuple, date,
time, list
3
Derived
object,
array of
complex
types, map
4
Visibility
.
Primitive Private 1
Simple
Protected,
Package
2
Complex Public 3
Attributes have two complexity ratings to
quantify, attribute visibility and attribute type. The
visibility of attribute (
) differs in term of
complexity between primitive, simple and complex
complexity. Private attribute, which can be used only
on its own class, classified as primitive complexity
with the lowest rating. On the other hand, public
attributes can be associated with many other classes
in the system which will increase the complexity to
the highest rating. Protected and package attributes
are rated in the moderate complexity rating since it
can communicate with a limited number of classes
within the package or based on inheritance role.
The second attribute scope of complexity ratings
is the attribute type (
), which we divided into
four different complexity classifications. First,
primitive types such as integer and boolean with the
minimum complexity rating. Second, simple types
like double, float, long, and string data fields. Third,
attributes contain an array, structure, tuple or list are
considered as a complex attribute type. Finally,
derived data types with the highest complexity rating
such as objects and array of complex types. The same
classifications of complexity assigned to the method
visibility (
), return type (
)
and the total of parameters list (
.
).
3.2 Proposed Design Driven Metrics
The metrics are defined using the following formulas.
∗
∗
(1)
Where (
is attribute complexity, (
)
attribute visibility, (
) is attribute type.
capture the complexity rate.
(2)
.
∗
.
∗
.
∗
Where (
) is method complexity derived
from Table 1, (
.
) is method visibility, (
.
) is
method return type. The term (
∑
.
∗
)
captures the complexity rate for all parameters in the
method, if any.
(3)
Finally, the complexity of a class (
) is
comprised of three elements; the sum of all of its
attribute complexities (
∑
), and method
complexities (
∑
).
3.3 Fuzzy Quality Metrics
We define a fuzzy quality metric is one where the
quantification value is dependent on the gap between
the actual and expected value. To demonstrate this
concept, we illustrate a fuzzy metric for Large Class
and Long method code metrics.
ELOC
(4)
Towards a Model-based Fuzzy Software Quality Metrics
141
Where ELOC is the expected size in terms of lines of
code. That is, the metric for Large Class is a function
of the absolute distance between the expected and
actual class size in terms of lines of code. ELOC is
calculated as follows.
∗
(5)
That is, the expected Class size is the Complexity of
the class (as defined in
) multiplied by LOC
factor to capture platform and development language
dependencies.
Similarly, the Fuzzy Metric for method is defined
as follows.
(6)
ELOC
LOC
Where ELOC(method) is the expected lines of code
of the method. That is, the metric for Long Method is
the absolute value of the distance between the
expected and actual method size in terms of lines of
code. ELOC(method), which is the expected LOC of
method, is calculated as follows.
∗
(7)
4 CASE STUDY DESIGN
The goal of this case study is to evaluate whether in
fact the proposed fuzzy metrics provide adequate
characterization for the underlying codebase quality.
Towards that goal, the case study constructs two
points of analysis (PoA); 1) Analysis of a stable
codebase developed by experienced professionals. 2)
Analysis of a stable codebase developed by non-
professionals. Table 2 shows the selected codebases
from the open source GitHub (GitHub, 2019) to
represent professional developers, which are
DataWave (National Security Agency, 2019),
CopyBara (Google, 2019), Pai (Microsoft, 2019),
Java (The Algorithms, 2019), Nacos (Alibaba, 2019)
and Kafka (Apache, 2019), and some other codebases
as non-professional developers, which are Arrays
(Glin1, 2019), Cool Cats Project Final (Bakker,
2019), Address Book (Pryadarshi, 2019), CITIC06a
(Formoso, 2019), Attendance App (Kumar, 2019) and
Multitask Downloader (Mario, 2019).
To determine the UML class diagram of the
selected projects, we used the tool Understand
(Scitools, 2019) which can be used for code analysis
and graphical UML class view. In total, more than
700 classes from the codebases were selected
randomly. From the selected systems, we excluded
interface classes, abstract classes, and classes that
include test cases. From large systems, we selected
the first alphabet names of the classes.
Table 2: The Selected Open Source Projects.
Category
Project
Commits
LOC
Selected
Classes
High-Trending Repository
DataWave 964 399719 150
CopyBara 1660 75227 100
Pai 3159 20506 100
Java 771 13100 100
Nacos 1283 62353 100
Kafka 6216 393403 100
Low-Trending Repository
Arrays and
Array Lists
13 1119 13
Cool Cats
Project Final
53 1372 9
Address Book 8 1883 18
CITIC06a 1 352 7
Attendance
A
pp
8 2568 13
Multitask
Downloader
8 1899 13
5 RESULTS
We present in this section the results for analysing the
subject systems.
5.1 Attribute Complexity
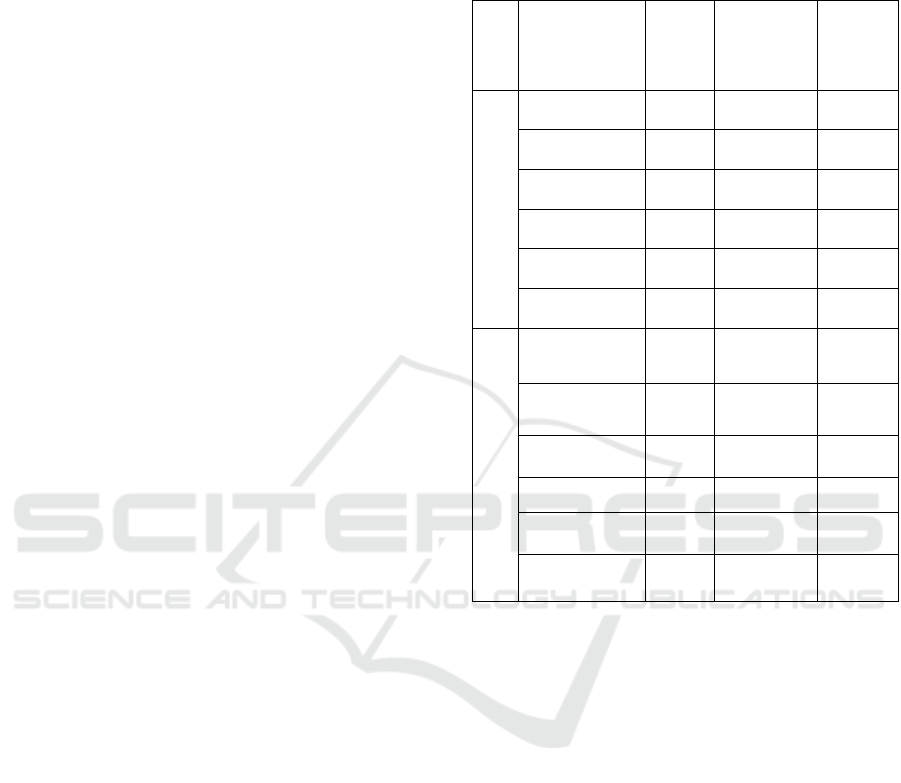
Table 3 explains the results after applying the first
formula described earlier, on the codebases attributes.
Project DataWave, which designed by professional
developers, has 680 attributes in the selected class.
Those attributes are 463 primitives, 76 simple and
141 complex attributes. The complexity rate for those
attributes is 1038 based on our derived matric.
The complexity rate for attribute types is 1870
after measuring 98 primitives, 229 simple, 98
complexes, and 255 derived attributes. Consequently,
the total attribute complexity (
) of Data Wave
project is 2908. The attribute complexity of project
“Arrays and Array Lists” from low trending
repositories is 155.
MODELSWARD 2020 - 8th International Conference on Model-Driven Engineering and Software Development
142
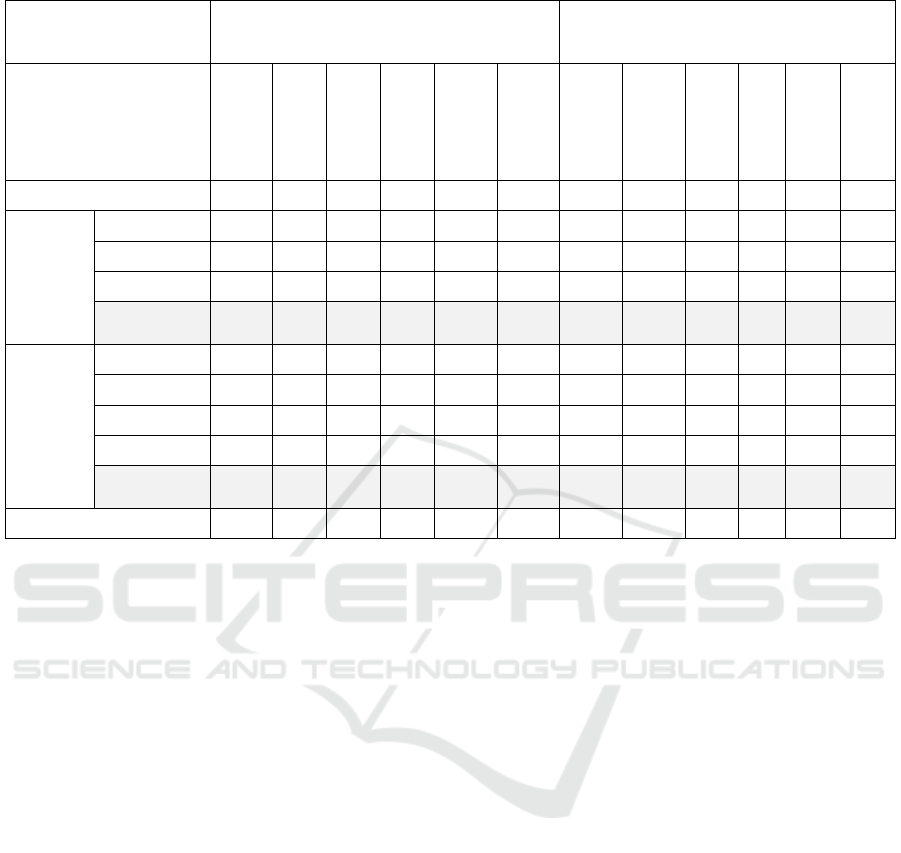
Table 3: Attributes Complexity for the Selected Projects.
Developers High-Trending Repository Low-Trending Repository
System
DataWave
Pai
CopyBara
Java
Nacos
Kafka
Arrays and
Array Lists
Cool Cats
Project Final
Address
Book
CITIC06a
Attendance
App
Multitask
Downloader
Number of Attributes 680 64 18 153 467 403 45 64 73 10 95 90
Visibilit
y
Primitive 463
64 17 113 318 263 42 21 37 5 54 61
Simple 76 0 0 0 0 0 0 0 15 0 0 0
Complex 141 0 1 40 147 139 3 43 21 5 29 29
Complexity
Rate
1038 64 20 233 763 682 51 150 130 20 177 148
Type
Primitive 98 36 5 55 98 51 23 6 9 3 7 29
Simple 229 10 4 12 182 119 1 20 31 1 27 19
Complex 98 1 3 42 53 62 5 4 6 2 11 8
Derived 255 17 6 44 134 171 16 34 27 4 51 34
Complexity
Rate
1870 127 46 381 1157 1159 104 194 197 27 298 277
Attribute Complexity 2908 191 66 614 1920 1841 155 344 327 47 457 375
5.2 Method Complexity
For measuring method complexity, we used the
design driven metric (
). The outcomes
illustrated in Table 4 where we used the same
classification that we used it on attribute visibility to
classify method visibility. The complexity rate for all
the 1239 methods found from the selected classes for
project DataWave, for example, is 3384. In the
second factor of method complexity, which is method
return type, we found 553 primitive methods, 229
simple methods, 121 complex method and 335
derived methods. As a result, the total complexity rate
for the methods return type is 2714. After that, we
estimated complexity rate for the total parameters of
the methods which is 3325. Finally, we added the
complexity rate of the three factors, method visibility,
method return type and the total parameters to
estimate method complexity.
5.3 Class Complexity
The final step is to estimate class complexity
(
) by adding both attribute complexity and
method complexity. Table 5 show the class
complexity of the selected datasets which resulting
out of adding both attribute complexity and method
complexity. It also shows the total lines of code of the
selected classes of each system. In the high trending
repositories, the highest number of LOC is from Data
Wave with 24233 and the lowest is Java system with
10054 LOC. From the low trending repositories, the
total number of LOC of the selected classes is
between 249 and 1744.
6 ANALYSIS
In this section, we present the analysis for classes and
methods complexity.
6.1 Class Complexity Analysis
In Figure 2 we can observe the high correlation
between LOC and class complexity of the high
trending repository systems. The correlation was
between 0.76 and 0.91 with an average 0.85 for all
high trending systems. Meanwhile, the correlation for
the low trending systems comes between 0.51 and
0.89 with an average 0.7 as shown in Figure 3.
According to these findings, we can see the strong
relationship between class complexity and the lines of
code for that class.
Towards a Model-based Fuzzy Software Quality Metrics
143
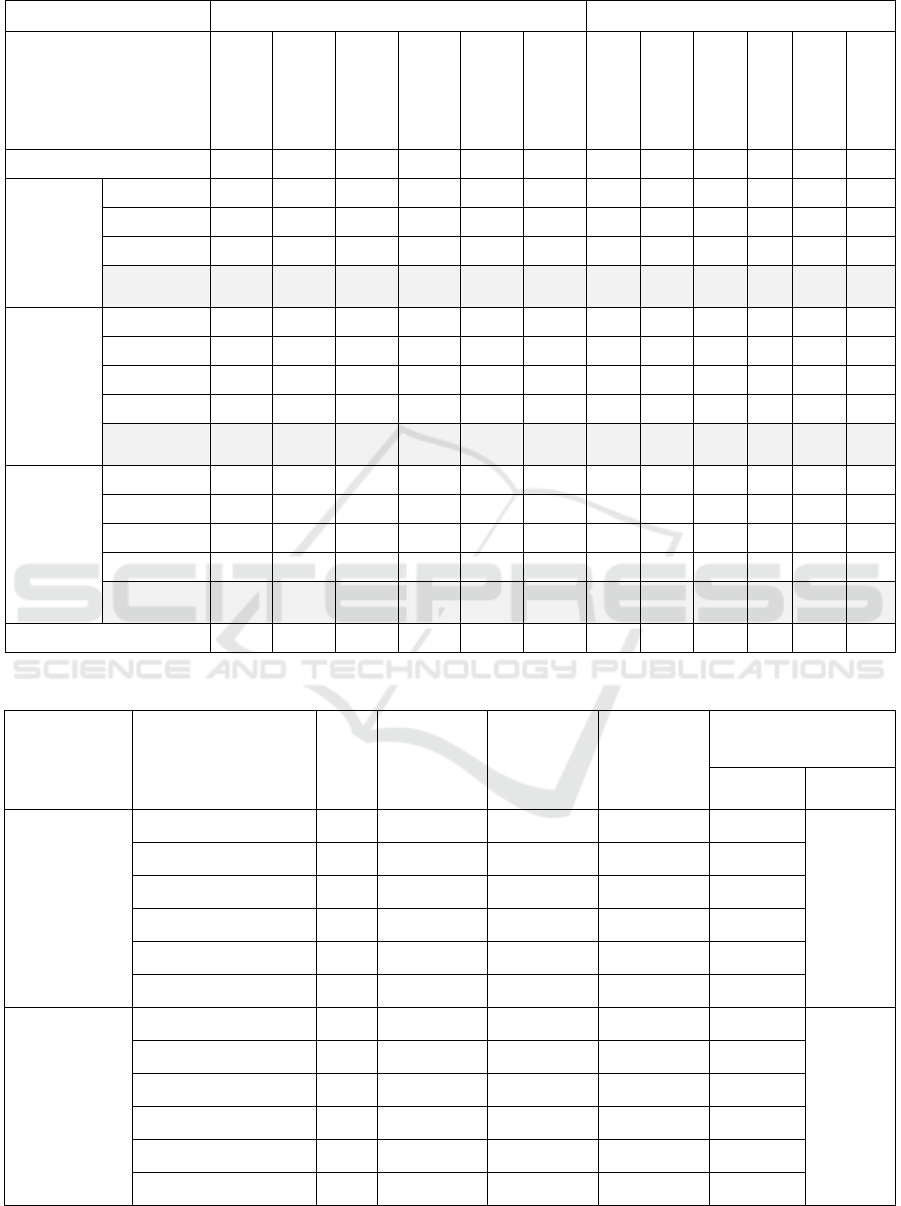
Table 4: Method Complexity for the Selected Projects.
Developers High-Trending Repository Low-Trending Repository
System
DataWave
Pai
CopyBara
Java
Nacos
Kafka
Arrays and
Array Lists
Cool Cats
Project Final
Address Book
CITIC06a
Attendance
App
Multitask
Number of Methods 1239 1017 625 402 780 643 43 26 82 9 130 112
Method
Visibility
Primitive 103
89 70 78 117 39 1 4 14 1 12 15
Simple 127 47 14 0 2 15 0 4 10 0 40 9
Complex 1009 881 541 324 661 589 42 18 58 8 78 88
Complexity
Rate
3384 2826 1721 1050 2104 1836 127 66 208 25 326 297
Method
Return
Type
Primitive 553 573 92 297 400 243 35 21 45 5 93 84
Simple 229 169 192 36 185 78 4 1 21 2 14 10
Complex 121 78 26 11 74 101 0 0 4 1 2 3
Derived 335 197 315 58 128 221 4 4 12 1 21 15
Complexity
Rate
2714 1933 1814 634 1508 1586 59 39 147 16 211 173
Total
Methods
Parameter
Primitive 199 145 40 145 154 82 11 5 2 0 11 19
Simple 441 289 198 64 549 100 1 1 32 1 18 15
Complex 148 89 29 106 117 100 3 0 1 0 5 3
Derived 450 619 296 86 183 272 12 23 29 6 27 35
Complexity
Rate
3325 3466 1707 935 2335 1670 70 99 185 26 170 198
Method Complexity 9423 8225 5242 2619 5980 5092 256 204 540 69 707 668
Table 5: Class Complexity and Correlation between LOC and Class Complexity.
Developers System LOC
Attribute
Complexity
Method
Complexity
Class
Complexity
Correlation (LOC and
Class Complexity)
Each
S
y
stem
Average
High-Trending
Repository
DataWave 24233 2908 9423 12331 0.85
0.85
Pai 12813 1988 8225 10213 0.85
Copybara 14636 1905 5242 7147 0.85
Java 10054 614 2619 3233 0.88
Nacos 15148 1913 5914 7827 0.76
Kafka 11547 1788 5092 6880 0.91
Low-trending
Repository
Arrays and ArrayLists 1094 155 256 411 0.51
0.7
Cool Cats Pro Final 1147 344 204 548 0.89
Address book 1744 327 540 867 0.73
CITIC06a 249 47 67 114 0.57
Attendance App 2271 1912 6033 7945 0.84
Multitask downloader 1723 375 668 1043 0.71
MODELSWARD 2020 - 8th International Conference on Model-Driven Engineering and Software Development
144
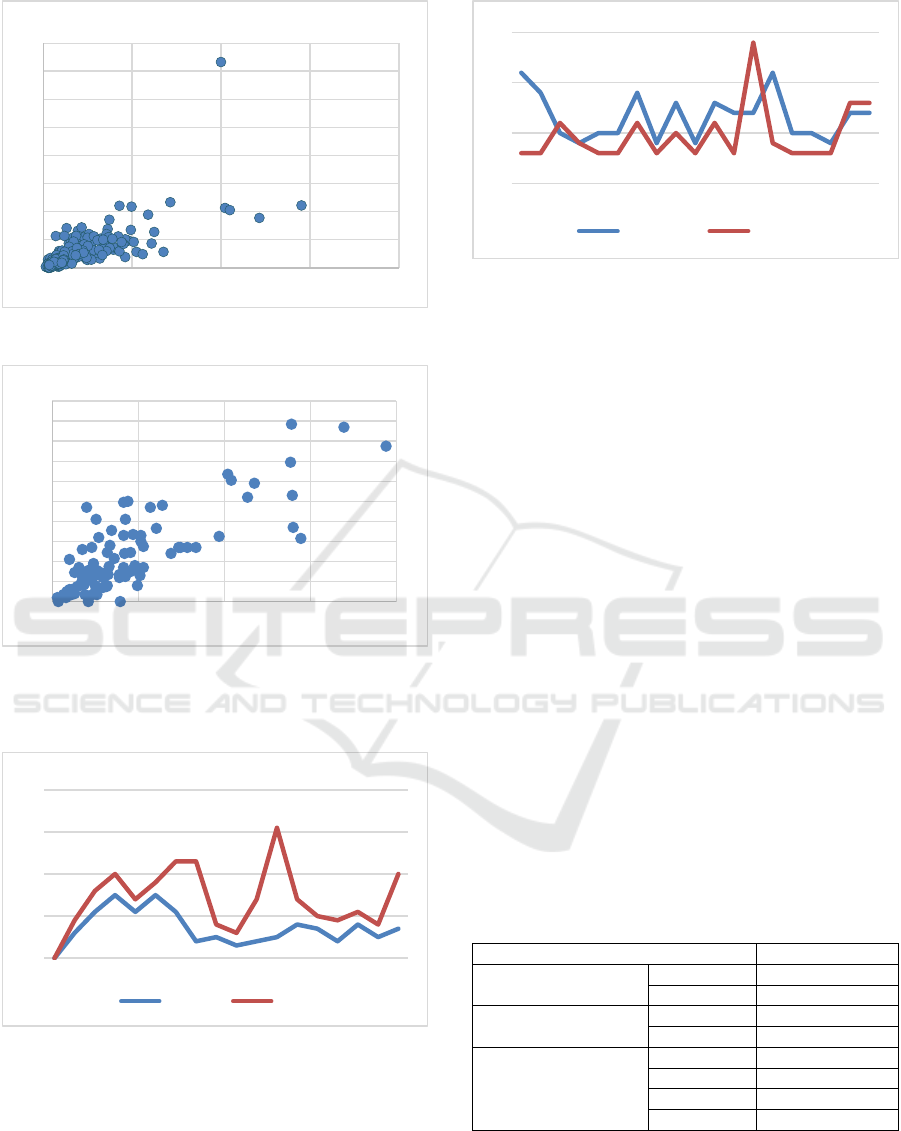
Figure 2: Correlation in High-Trending Repository.
Figure 3: Correlation in Low-Trending Repository.
6.2 Method Complexity Analysis
Figure 4: Methods Complexity and LOC in Class1.
We have applied the proposed method complexity
approach on the same code repositories. For example,
in the method number 8 in class 1 from DataWave
project (Figure 4), the total method complexity is 4
and the LOC is 3. Also, in the second class, method
number 5 there are 14 LOC and we can see that the
method complexity is 11 (Figure 5).
Figure 5: Relationship between Methods Complexity and
Methods LOC in Class 2.
Accordingly, we can feel the strong relationship
between method complexity and the number of lines
of code for that method.
7 ESTIMATING FUZZY
METRICS
To estimate the fuzzy code quality metrics, we need
to find a pattern to explain the relationship between
class complexity and the LOC for that class, and
between method complexity and LOC for that
method.
7.1 Fuzzy Metric (Large Class)
We estimated the factor (
) that we
need to be used in expecting the lines of code in the
class (ELOC(Class)) by the following steps. First, in
our case study, we selected 758 classes from 12
projects. The total number of the LOC for all those
classes is 97,986 with an average 129 LOC per class
as shown in Table 6.
Table 6: Estimating Class LOC Factor.
Number of Classes 758
LOC of the selected
classes
Total 97968
Average 129
Class Complexity
Total 22561
Average 29.76
Estimating factor
(average)
2 -69.72
3 -39.95
4 -10.19
5 19.57
The next step is to calculate the class complexity
of all selected classes which is 22,561, and the
average is 29.76 per class. Then, we found that the
average of class complexity is less than the average
of LOC, so, we multiplied the average of class
0
200
400
600
800
1000
1200
1400
1600
0 500 1000 1500 2000
LOC
Class Complexity
0
20
40
60
80
100
120
140
160
180
200
0 100 200 300 400
Class Complexity
LOC
0
10
20
30
40
1 2 3 4 5 6 7 8 9 101112131415161718
Method C. M. LOC
LOC
0
5
10
15
12345678910111213141516171819
MethodC. M.LOC
LOC
Towards a Model-based Fuzzy Software Quality Metrics
145

complexity with the factor “2”. The result was -69.72
which is less than average of LOC. We increased the
factor every time until we found the first factor that
when we multiply it with the class complexity, we get
a number greater than class LOC, which is 5. This
means that we will use 5 as a class LOC factor
(
) in the expected lines of code.
∗5
Based on that, we applied (ELOC(Class)) formula to
use it to measure the fuzzy large class code smell
(FuzzyMetric(Class)) on ours dataset.
7.2 Fuzzy Metric (Long Method)
We estimated the factor (
) by
applying the same technique that we use it in
expecting the lines of code in the class
(ELOC(Class)). We found that “2” is the best number
to represent the factor for the method as shown in
Table 7.
∗2
Table 7: Estimating Factor of Method LOC Factor.
Method LOC (average) 6.8
Method Complexity (average) 7.66
Estimating
factor (average)
2 8.53
3 16.19
8 COMPARING WITH
DETECTION TOOLS
In order to evaluate our approach, we will be using
PMD (PMD, 2019) which is an Eclipse plug-in tool
used for analysing source code and detecting code
smells such as large class and long method. We found
that 7.22% of the high trending projects and 9.41% of
the low trending projects considered as large class
code smell after applying fuzzy metric. Moreover,
only 1.36% of the high trending repositories methods
are smelly methods and 5.17% of the low trending
repositories. In total, 50 methods are long method
code smell which is 0.42%.
After comparing the results of our design driven
fuzzy metrics with PMD results, we can see the
differences between them in term of large class and
long method code smells. The toll PMD discovered
only 0.86% of large class code smell and 0.43% of
long method from the high trending repositories. In
addition, from the low trending repositories, PMD
discovered 3.23% smelly classes and 2.85% smelly
methods.
By comparing our metrics to the existing code
smell detection tools, we can find that in both of them,
less smelly classes and methods in the high trending
projects, which designed by professionals and
expected to be a high quality with less code smells,
than the low trending projects. Accordingly, using
software quality fuzzy metrics provides high level
and adequate characterization based on software
design.
9 THREATS TO VALIDITY
In this section we will discuss construct, internal and
external validity threats to this study.
9.1 Construct Validity
In our case study, we analysed open source code from
various sources and made assumptions on code
quality. We attributed specific quality characteristics
primarily based on the developers of the code base. It
is possible that the case study construct is not valid
due to the assumption about code quality
characteristics. To minimize this risk, we analysed a
significantly large number of lines of code and
included code fragments from different code
repositories. We also analysed sample code elements
to evaluate our assumptions.
9.2 Internal Validity
For the threats that could have influenced our dataset
extraction process, we include project stars, commits,
and the number of contributors as criteria to classify
the quality level of the projects form open source
communities. However, these criteria could be
changed from time to time. This means that the
projects that we selected as a top trending project in
GitHub on the time that we performed the research,
we could not find some of them any time later.
Another internal validity refers to the extent to which
the study makes sure that the two class factors,
variables and methods, are the only factors that can
be measured and has an effect on the class. Future
work will add to the formula a third factor that related
to the class, which is the association.
9.3 External Validity
The external validity concerns applying our findings.
The study is limited to limit number of classes from
MODELSWARD 2020 - 8th International Conference on Model-Driven Engineering and Software Development
146

12 Java projects. The reason is that we analysed the
systems manually since we do not have a software
tool to perform the analysis automatically. However,
our decision to analyse few systems was also due to
the need for manually validating class complexity,
rather than just relying on tool output (Bavota, 2015).
Moreover, since the commercial source code is not
available, we targeted open source systems for our
analysis.
10 RELATED WORK
It has been argued that code metrics are too sensitive
to context and that metrics appropriate for one project
are not an adequate predictor for another. (Gil and
Lalouche, 2016) has demonstrated this phenomenon
by applying both statistical and visual analysis of
code metrics. Fortunately, they demonstrate that
context dependency can be neutralized by applying
Log Normal Standardization (LNS) technique. In a
similar study, (Zhang, 2013) demonstrated that code
metrics are dependent on six factors, namely,
application domain, programming language, age,
lifespan, the number of changes, and the number of
downloads. (Aniche, 2016) investigated the effect of
architecture on code metrics. They proposed SATT
(Software Architecture Tailored Thresholds), an
approach that detects whether an architectural role is
considerably different from others in the system in
terms of code metrics and provides a specific
threshold for that role. Our work presented in this
paper is similar, in the sense that it aims at improving
the accuracy of code metrics thresholds. However,
while the SATT approach derives a unique threshold
only if the architectural role of the module is deemed
to be significantly different, our approach derives the
unique thresholds even in cases where the
architectural role may only be slightly different.
There is sizable evidence that prevalent standard
code metrics are in fact ineffective even in standard
cases. (Concas, 2007) investigated 10 properties
related to classes, methods and the relationships
between them and found that distributions are often
Pareto or long-normal distributions. As such, they
argued that standard evaluations that are often based
on means and standard deviations are misleading.
Another study has found a manifestation of Power
law, a law that is very common in natural and social
phenomenon, in source code (Wheeldon, 2003). A
power law implies that small values are extremely
common, whereas large values are extremely rare. In
that study, the authors identify twelve new power
laws relating to the static graph structures of Java
programs. (Yao, 2009) apply complex network theory
to lar object-oriented software system. They
demonstrated that large object-oriented software
network is a scale-free network with power-law
distribution of degree, low shortest path length and
high clustering coefficient. In particular, with
increase of softwarepsilas scale, scale-free property is
more and more evident. In a survey study (Badreddin,
2018) they found that there are some increase in
formal and informal modeling platforms and tools
In a related work, (Herraiz, 2011) analyzed the
size of a large collection of software (the Debian
GNU/Linux distribution version 5.0.2) and found that
the statistical distribution of its source code file sizes
follows a double Pareto distribution. Because
identifying appropriate metrics and their threshold is
challenging, many have proposed using experience as
a primary source for metric definition (Lanza, 2007)
(Coleman, 1995) (Nejmeh, 1988). Resorting to
experience is in fact related to the proposed approach
in this paper. Software design is a formalization of the
expertise of the software developer team, their
domain expertise, and the software context under
development.
11 CONCLUSION
In this article, we introduced a new approach to
measure software quality by using fuzzy metrics that
are derived from the software design. This metrics
starts by estimating complexity rating for each class,
which itself is estimated from the complexity rating
of the class attributes, and the complexity rating of the
class methods. Next, for estimating the fuzzy code
quality metrics, we followed a pattern to explain the
relationship between class complexity and the LOC
for that class, and between method complexity and
LOC for that method.
To evaluate our new approach, we used a case
study constructs two points of analysis, analysis of a
stable codebase developed by experienced
professionals from high trending repositories, and
analysis of a stable codebase developed by non-
professionals from low trending repositories. We
found that our new metrics works better with the high
trending repositories that developed by professional
developers. We can observe that the correlation
between class complexity and class’s lines of code is
extremely high, r = 0.85, in average of high trending
repositories. Finally, we compared the results of our
metrics with the results of a code smell detection tool
to evaluate our approach. We discovered that both of
our approach and the detection tool leading to almost
Towards a Model-based Fuzzy Software Quality Metrics
147

the same results which validate our approach. In
future work, we are going to apply our metrics to a
large number of projects implemented with different
programming languages.
REFERENCES
Alibaba, Nacos, Accessed: March 2019. Available: https://
github.com/alibaba/nacos.
Aniche, M., Treude, C., Zaidman, A., Van Deursen, A.,
Gerosa, M. A., 2016. SATT: Tailoring code metric
thresholds for different software architectures,
presented at IEEE 16th International Working
Conference on Source Code Analysis and Manipulation
(SCAM). Raleigh, NC, USA.
Apache, Kafka, Accessed: March 2019. Available: https://
github.com/apache/kafka.
Badreddin, O., 2018. Powering Software Sustainability
with Blockchain. In Proceedings of 28th ACM Annual
International Conference on Computer Science and
Software Engineering (CASCON).
Badreddin, O., Hamou-Lhadj, W., Chauhan, S., 2019.
Susereum: Towards a Reward Structure for Sustainable
Scientific Research Software, In Proceedings
International Workshop on Software Engineering for
Science.
Badreddin, O., Khandoker, R., 2018. The Impact of Design
and UML Modeling on Codebase Quality and
Sustainability. In Proceedings of 28th Annual
International Conference on Computer Science and
Software Engineering (CASCON).
Badreddin, O., Khandoker, R., Forward, A., Masmali, O.,
Lethbridge, T., 2018. A Decade of Software Design and
Modeling: A Survey to Uncover Trends of the Practice.
In proceedings of ACM/IEEE 21st International
Conference on Model Driven Engineering Languages
and Systems (MODELS).
Bakker, P., Cool Cats Project Final. Available:
https://github.com/pascalbakker/CoolCatsProjectFinal.
Accessed: March 2019.
Bavota, Gabriele, Andrea De Lucia, Massimiliano Di
Penta, Rocco Oliveto, and Fabio Palomba 2015. An
Experimental Investigation on the Innate Relationship
Between Quality and Refactoring, Journal of Systems
and Software, Volume 107 Issue C, September 2015,
Pages 1-14.
Coleman, D., Lowther, B., Oman, P., 1995. The application
of software maintainability models in industrial
software systems, Journal of Systems and Software,
vol. 29, no. 1.
Concas, Giulio, Michele Marchesi, Sandro Pinna, and
Nicola Serra, 2007. Power-laws in a large object-
oriented software system, IEEE Transactions on
Software Engineering 33, no. 10: 687-708.
Formoso, P., CITIC06a, Accessed: March 2019. Available:
https://github.com/pabloformoso/CITIC06a.
Gil, Joseph Yossi, and Gal Lalouche, 2016. When do
Software Complexity Metrics Mean Nothing? When
Examined out of Context." Journal of Object
Technology 15, no. 1: 2-1.
GitHub. Available: https://github.com/
Glin1, unit4 Arrays Array Lists, Accessed: March 2019.
Available:
https://github.com/glin1/unit4ArraysArrayLists.
Google, Copybara, Accessed: March 2019. Available:
https:// github.com/google/copybara.
Herraiz, Israel, Daniel M. German, and Ahmed E. Hassan,
2011. On the distribution of source code file sizes. In
ICSOFT (2), pp. 5-14.
Kumar A., Attendance-App. Available:
https://github.com/ghoshkumararun/Attendance-App.
Accessed: March 2019.
Lanza, Michele, and Radu Marinescu, 2007. Object-
oriented metrics in practice: using software metrics to
characterize, evaluate, and improve the design of
object-oriented systems. Springer Science & Business
Media.
Mario, F., Multitask downloader. Available:
https://github.com/feng0403/multitask_downloader.
Accessed: March 2019.
Microsoft, pai, Accessed: March 2019. Available: https://
github.com/Microsoft/pai.
National Security Agency (NSA), Datawave. Available:
https://github.com/NationalSecurityAgency/datawave
Nejmeh, B. A., 1988. Npath: a measure of execution path
complexity and its applications, Communications of the
ACM, vol. 31, no. 2.
PMD Code Analysis Tool, Accessed: May, 2019.
Available: https://pmd.github.io/.
Pryadarshi, S., Address Book. Available:
https://github.com/sampryadarshi/address-book.
Accessed: March 2019.
Scitools, Understand. Accessed: March 2019, Available:
https://scitools.com/
Taibi, D., Janes, A., Lenarduzzi, V., 2017. How developers
perceive smells in source code: A replicated study,
Information and Software Technology, Volume
92, December 2017, Pages 223-235.
The Algorithms, Java, Accessed: March 2019. Available:
https:// github.com/TheAlgorithms/Java.
Vidal, S.A., Marcos, C., Díaz-Pace, J., 2016. An approach
to prioritize code smells for refactoring. Automated
Software Engineering, September 2016, Volume
23, Issue 3, pp 501–532.
Wheeldon, Richard, and Steve Counsell, 2003. Power law
distributions in class relationships, In Proceedings
Third IEEE International Workshop on Source Code
Analysis and Manipulation, pp. 45-54.
Yao, Yi, Song Huang, Zheng-ping Ren, and Xiao-ming Liu,
2009. Scale-free property in large scale object-oriented
software and its significance on software engineering,
In Second International Conference on Information and
Computing Science, vol. 3, pp. 401-404.
Zhang, Feng, Audris Mockus, Ying Zou, Foutse Khomh,
and Ahmed E. Hassan, 2013. How does context affect
the distribution of software maintainability metrics? In
2013 IEEE International Conference on Software
Maintenance, pp. 350-359.
MODELSWARD 2020 - 8th International Conference on Model-Driven Engineering and Software Development
148
