
Image Reconstruction by the Method of Convex Projections
Tomohiro Aoyagi
*
, Kouichi Ohtsubo and Nobuo Aoyagi
Faculty of Information Sciences and Arts, Toyo University, 2100 Kujirai, Saitama, Japan
Keywords: Computerized Tomography, Convex Projection, Closed Convex Set.
Abstract: In medical imaging modality, such as X-ray computerized tomography (CT) and positron emission
tomography (PET), image reconstruction from projection is to produce an image of a two dimensional object
from its line integrals along a finite number of lines. Given some subsets of a priori knowledge about the
problem in Hilbert space, a formalized problem is to find the object from observed vector. If the subsets are
closed and convex sets, given the convex projections onto the sets, the problem can be solved by using the
method of projections onto convex sets (POCS). In this paper, we apply the method of projection onto convex
sets to image reconstruction problems and evaluate the image quality in computer simulations. Also, we
evaluate the influence of the noise in reconstructed image.
1 INTRODUCTION
In medical imaging modality, such as X-ray
computerized tomography (CT) and positron
emission tomography (PET), image reconstruction
from projection is to produce an image of a two
dimensional object from estimates of its line integrals
along a finite number of lines of known locations
(Herman, 2009; Kak et al., 1998; Imimya, 1985). If
is an observed function,
,
is a known
kernel and
is unknown function or object to be
determined, then image reconstruction problem can
be formulated by
,
.
This is known as a Fredholm integral equation of the
first kind. Because of the ill-posed nature, it is
difficult to solve strictly this integral equation. Since
observed function can be discretized experimentally,
it is necessary to discretize the integral kernel and
object to solve it in computer. This leads to the
problem of seeking the inverse of some matrix
(Bertero et al., 1985; Bertero et al., 1988). In finite
dimensional vector space, if an observed data is a
vector in dimensional space and an object data is a
vector in dimensional space, the integral kernel
can be expressed by matrix. If and the
*
https://www.toyo.ac.jp/
matrix is nonsingular, there exist an inverse. Then,
object vector to be reconstructed can be obtain by
using observed vector and an inverse. However, in
general, because the matrix is not always nonsingular,
there is no guarantee of existence and uniqueness for
the solution. Given some subsets of a priori
knowledge about the problem in Hilbert space, a
formalized problem is to find the object or element f
from observed vector. If the subsets are closed and
convex sets, given the convex projections onto the
sets, the problem can be solved by using the method
of projections onto convex sets (POCS) (Stark et al.,
1998). POCS is an iterative algorithm for solving a
Fredholm equation of the first kind. Up to now it has
been used in CT, electron microscope, pattern
recognition, phase retrieval, image compression,
image restoration and so on (Sezan et al., 1984; Sezan
et al., 1982; Oskoui-fard et al., 1988; Kudo et al.,
1991; Bauschke et al., 2003). Algebraic
reconstruction techniques (ART) is also one of POCS
for solving a system of simultaneous equation. In this
paper, we apply the method of projection onto convex
sets to image reconstruction problems and evaluate
the image quality in computer simulations. Also, we
evaluate the influence of the noise in reconstructed
image.
26
Aoyagi, T., Ohtsubo, K. and Aoyagi, N.
Image Reconstruction by the Method of Convex Projections.
DOI: 10.5220/0008912000260032
In Proceedings of the 8th International Conference on Photonics, Optics and Laser Technology (PHOTOPTICS 2020), pages 26-32
ISBN: 978-989-758-401-5; ISSN: 2184-4364
Copyright
c
2022 by SCITEPRESS – Science and Technology Publications, Lda. All rights reserved

2 IMAGE RECONSTRUCTION
FROM PROJECTIONS
Let us consider the problem of computerized
tomography that is to reconstruct an object on the
orthogonal coordinate system of 2 dimensional
Euclidean space
2
. Let
,
be the orthogonal
coordinates of any point in the plane. Let
,
be
the orthogonal coordinates of any point which are
rotated through θ degrees around the origin. And, let
,
be an object which is, for example, X-ray
absorption coefficient or the distribution of the
nuclide. For this setting, we can define the integral of
the function
,
along θ direction, such that,
,
,
∞
∞
.
(2)
This is known as a parallel projection, the ray-sum of
,
, the Radon transform or the X-ray transform.
Figure 1 shows an object, its coordinate system and a
parallel projection. The real problem in CT is to
reconstruct f from a finite number of its line integrals,
and the reconstruction procedure has to be adapted to
the scanning geometry. The settings of finite
sampling and scanning geometry on resolution and
accuracy is one of the main problems in CT (Natterer,
2001).
3 THE METHOD OF CONVEX
PROJECTIONS
Assume that
1
,
2
,⋯,
denote closed convex
sets in Hilbert space , and
0
denotes their
intersection set.
0
1
.
(3)
Figure 1: An object,
,
, and its projection,
,
, are
shown for an angle of θ.
For each 1,2,⋯,, let
denote the projection
operator onto the set
, and
denote the
corresponding relaxed projector, such that,
,
∈
0,2
.
(4)
The
are called relaxation parameters, and can be
adjusted to accelerate the rate of convergence.
Moreover, we define the composition of the relaxed
projectors.
1
⋯
1
.
(5)
Then, we have the following theorem.
Theorem (Fundamental Theorem of POCS).
Assume that
0
is non-empty. Then for every ∈
and for every
∈
0,2
,1,2,⋯,, the
sequence
converges weakly to a point of
0
.
This theorem was proved with the fixed point
theorem of non-expansive mappings by Youla et al.
in 1982(Youla et al., 1982). In a finite dimensional
vector space, the sequence
converses strongly
to ∈
0
(Takahashi, 2000).
Constraint sets used by this paper are listed below.
The derivation of the projection operators is given
in (Youla et al., 1982).
1
:
∈
,
,
0for
,
∉
.
(6)
In other words,
is the set of all functions in that
are spatially band-limited in finite region . In short,
it is compact support. The projection
onto
is
given by
,
,
,
∈
0
,
∉
.
(7)
2
:
∈
,
,
0
for all
,
∈
.
(8)
In other words,
is the set of all function in that
are nonnegative. The projection
onto
is given
by
,
,
if
0
0if
0
. (9)
3
:
∈
,
,
.
(10)
In other words,
is the set of all function in that
are amplitude-limited in the range
,
. The
projection
onto
is given by
,
,
,
,
,
.
(11)
Let us consider the set that are obtained by the line
integral. It is inner product in Hilbert space , that is,
Image Reconstruction by the Method of Convex Projections
27

:
〈
,a
〉
. (12)
Let g
1
,g
2
∈, g
3
g
1
1
g
2
,for ∈
0,1
.
Then,
〈
g
3
,a
〉
〈
g
1
1
g
2
,a
〉
(13)
〈
g
1
,a
〉
1
〈
g
2
,a
〉
α
1
.
Hence, g
3
∈ and is convex.
Next, let
be a sequence in such that
→
∗
. By the Schwarz inequality, we obtain
|〈
,a
〉
〈
∗
,a
〉|
|〈
∗
,a
〉|
‖
∗
‖
∙
‖
a
‖
→0.
(14)
Thus,
〈
∗
,a
〉
lim
→∞
〈
,a
〉
.
(15)
Hence,
∗
∈ and set is closed. Therefore, is
closed convex set.
The projection of an arbitrary onto the set is
driven. We need to find a ∈, for an arbitrary ∈
, that minimizes
‖
‖
. Let a
0
a/
‖
a
‖
. Then,
each vector ∈ has the following orthogonal
decomposition, that is,
〈
,a
0
〉
a
0
.
(16)
Hence,
〈
,a
0
〉
a
0
.
(17)
Clearly
〈
,a
0
〉
0 so is orthogonal to a
0
. Since
each ∈ satisfies
〈
,a
〉
, i.e.,
〈
,a
0
〉
/
‖
a
‖
,
we can write according to eq. (16) as
‖
a
‖
a
0
,
(18)
where is a vector that is orthogonal to a
0
.
Let us consider ∉ and ∈. From eq. (16)
and (18) we have
‖
‖
2
〈
,a
0
〉
a
0
‖
a
‖
a
0
2
(19)
〈
,a
0
〉
‖
a
‖
a
0
2
Since a
0
is orthogonal to ,
〈
a
0
,
〉
0.
Then, we write
‖
‖
2
〈
,a
0
〉
‖
a
‖
a
0
2
‖
‖
2
.
(20)
We need to minimize
‖
‖
2
. Since
‖
‖
2
0, . From eq. (18), we can write
‖
a
‖
a
0
(21)
‖
a
‖
a
0
〈
,a
0
〉
a
0
‖
a
‖
〈
,a
0
〉
a
0
〈
,a
〉
‖
a
‖
2
a.
We conclude that
y
〈
,a
〉
‖
a
‖
2
a,
(22)
which is the projection of onto the set .
4 COMPUTER SIMULATIONS
To confirm the effectiveness of the method, computer
simulations were carried out. A Cartesian grid of the
square observation plane, called pixels, is introduced
into the region of interest (ROI) so that it covers the
whole observation plane that has to be reconstructed.
The pixels are numbered in some manner. We set the
top left corner pixel 1and bottom right corner pixel M
with Raster scanning. The object to be reconstructed
is approximated by one that takes a constant uniform
value f
throughout the -th pixel, for 1,2,⋯,M.
Thus the vector f
1
in
is the discretized
version of the object (Censor et al., 2008).
For our simulations we assumed the parallel mode
of data collection. The set of all lines for which line
integrals are estimated is divided into V sets of /V
lines in each. The lines within a set are parallel and
equidistant. The total number of all discretized line is
. We assumed projection angle θ
0,
, and it is
discretized at even. We set the left detector element
to 1 at θ0 and the right detector element to N at
last View. Thus indicates any detector elements and
1,2,⋯,. We denote the length of intersection of
the -th line with the -th pixel by a
, for all
1,2,⋯,, 1,2,⋯,. Therefore, in this model,
each line integral is approximated by a finite sum and
represented by a system of linear equations, such that,
a
f
1
g
,1,2,⋯,.
(23)
Thus the vector
g
1
in
is the discretized
version of the line integral or parallel projection.
Using vector notation, it can be expressed by
A. (24)
PHOTOPTICS 2020 - 8th International Conference on Photonics, Optics and Laser Technology
28
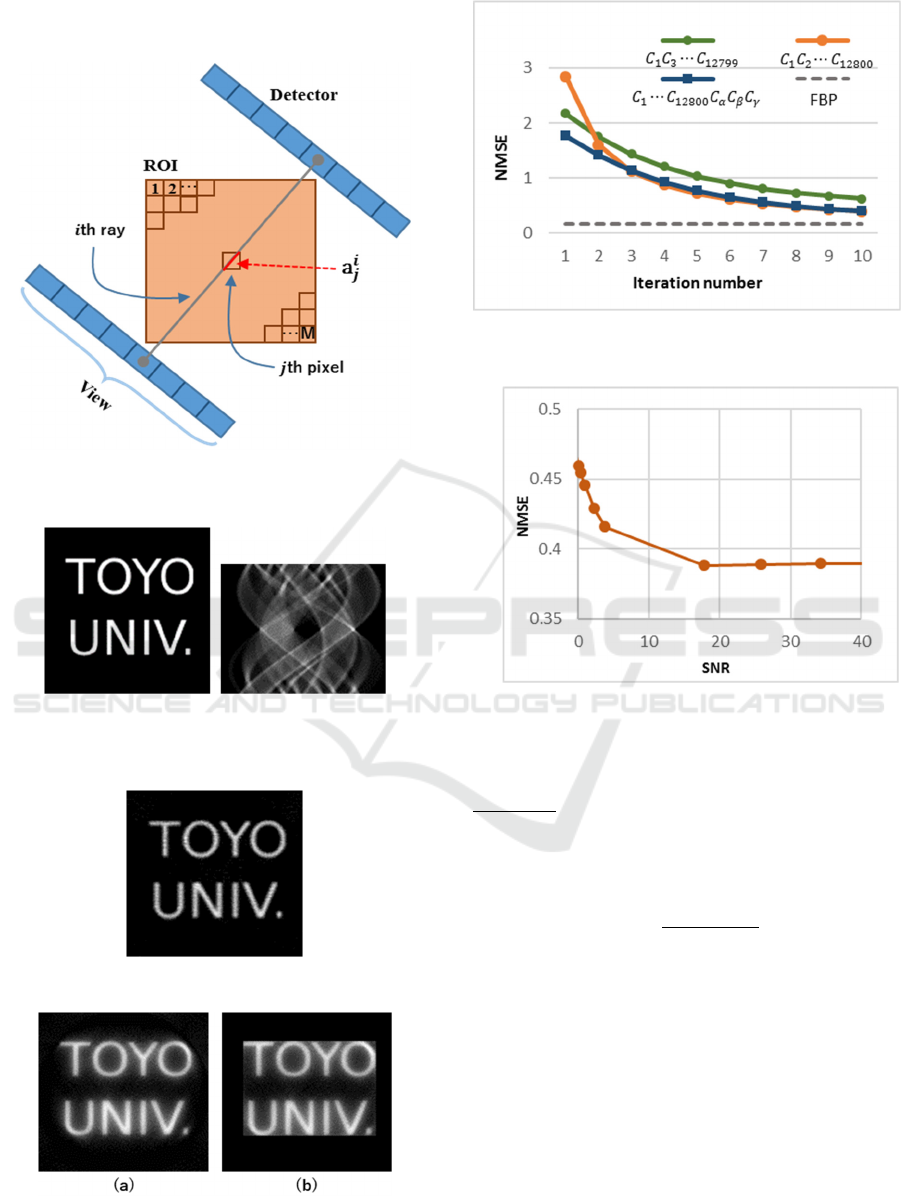
Figure 2 shows the discretized model of the image
reconstruction problem.
Figure 2: The fully-discretized model of the image
reconstruction problem.
Figure 3: The original test image 1 (128×128pixel, 8bpp)
and its projection data (Sinogram: 128 Detectors, 100
Views and 8bpp).
Figure 4: The reconstruction image using FBP.
Figure 5: The reconstructed image using (a) ART (10
iterations), (b) ART with
,
and
(10 iterations).
Figure 6: Plots of the normalized mean square error versus
iteration number.
Figure 7: Plot of the normalized mean square error versus
SNR.
The ART is the following iterative scheme.
Algorithm.
Step 1 (Initialization):
f
0
∈
and the relaxation
parameter
is arbitrary.
Step 2 (Iterative Step): Given
compute
〈
,
k
〉
‖
‖
,
(25)
where
k∈
0
and
∈
0,2
.
‖
∙
‖
2
indicates the ℓ
2
-
norm.
〈
a
,f
〉
a
f
1
.
(26)
Having identified the ART as convex projection
algorithm, we can describe the ART algorithm by
f
1
ART
f
,
(27)
where
ART
is defined as following.
ART
⋯
2
1
. (28)
Image Reconstruction by the Method of Convex Projections
29
It means that
is constituted by a composition of
projection operators
that project onto the closed
convex sets
,1,2,⋯,.
Our first image is a text based phantom. Figure 3
shows its original test image, discretized 128128
pixels, and its parallel projection data, called
sinogram. In this case we set 100 projections with 128
line per projection. The sinogram is shown 128
100 pixels. Figure 4 shows the reconstructed image
with the filtered backprojection algorithm (FBP) for
reference. FBP is an important reconstruction
algorithm in tomography. It can be viewed as a
numerical implementation of the inversion formula of
the Radon transform. Figure 5 shows the
reconstructed image with the method of convex
projections after 10 iterations. Fig.5 (a) is the
reconstructed image by ART without a priori
constraints. It can be written as
f
1
⋯
2
1
f
.
(29)
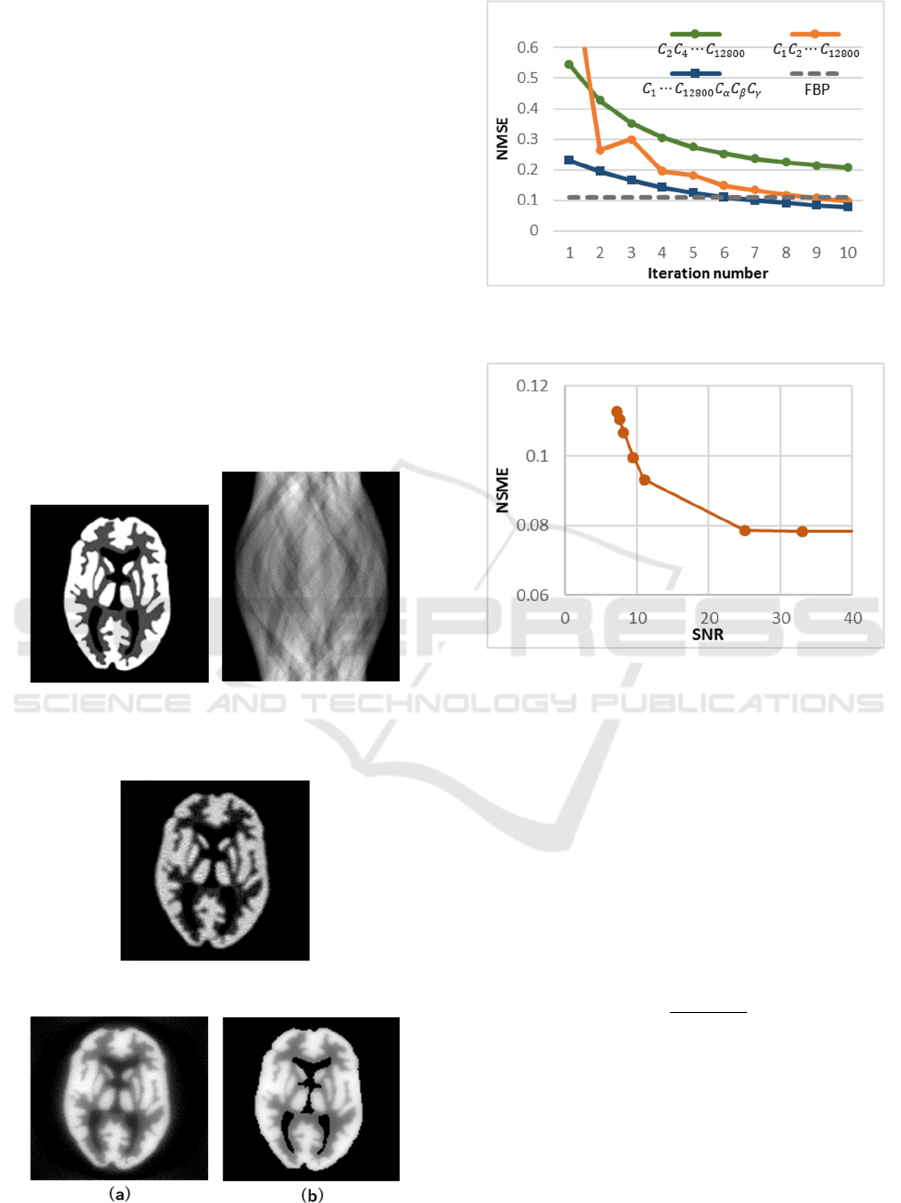
Figure 8: The original test image 2 (128×128pixel, 8bpp)
and its projection data (Sinogram: 128 Detectors, 150
Views and 8bpp.)
Figure 9: The reconstruction image using FBP.
Figure 10: The reconstructed image using (a) ART (10
iterations), (b) ART with
,
and
(10 iterations).
Figure 11: Plots of the normalized mean square error versus
iteration number.
Figure 12: Plot of the normalized mean square error versus
SNR.
Fig. 5 (b) is the reconstructed image by ART with
three prior constraints. It can be written as
f
1
⋯
2
1
f
.
(30)
In this case we set the starting data to the origin, 0
f
0
∈
, and the relaxation parameter
to 0.01.
Figure 6 illustrates the plots of the normalized mean
square error versus iteration number to compare the
error of the reconstruction. The normalized mean
square error is defined by
NMSE
f
f
2
2
‖
f
‖
2
2
,
(31)
where
is the image after ’th iteration step and is
the original image. In Fig. 6 the green line shows the
NMSE by using the convex projections
12799
12797
⋯
3
1
.
The reconstruction was updated
by
f
1
12799
12797
⋯
3
1
f
.
(32)
The total number of tis projections is
6400.
The orange
line shows the NMSE by using the convex projections
PHOTOPTICS 2020 - 8th International Conference on Photonics, Optics and Laser Technology
30

12800
12799
⋯
2
1
. The reconstruction was updated
by
f
1
12800
12799
⋯
2
1
f
.
(33)
The total number of tis projections is 12800. The blue
line shows the NMSE by using the convex projections
12800
⋯
2
1
. The gray dotted line shows the
NMSE by FBP for reference. From Fig. 6 we can see
that the error decreases with increasing the number of
projections and the number of iterations.
To confirm the influence of the noise, noises are
added the projection data. Using vector notation, it
can be expressed by
A,
(34)
where q indicates noise and is a normally distributed
deviate with zero mean and unit variance (Press et al.,
1992).
To measure the effect of noise on the
reconstruction images, we use the signal-to-noise
ratio (SNR) (Trussel, 2008). This is usually defined
as the ratio of signal power
g
2
, to noise power
2
,
SNR
g
2
2
,
(35)
and in decibels
SNR
dB
10log
10
g
2
2
.
(36)
In projection data, the function power is usually
estimated by the simple summation
g
2
1
128100
g
g
2
,
128100
1
(37)
where
g
is the mean of the projection data.
Figure 7 illustrates the plots of the normalized
mean square error versus SNR. From Fig. 7 we can
see that the error decreases with increasing SNR.
Our second image is 2-demensional numerical
phantom which is modeled on Hoffmann brain
phantom. Figure 8 shows its test image 2, discretized
128128pixels, and its parallel projection data. In
this case we set 150 projections with 128 line per
projection. The sinogram is shown 128150 pixels.
Figure 9 shows the reconstructed image with FBP for
reference. Figure 10 shows the reconstructed image
with the method of convex projections after 10
iterations. Fig.10 (a) is the reconstructed image by
ART without a priori constraints. Fig.10 (b) is that
with three prior constraints. Figure 11 illustrates the
plots of the normalized mean square error versus
iteration number with test image 2. In Fig. 11 the
green line shows the NMSE by using the convex
projections
19200
19198
⋯
4
2
. The reconstruction
was updated by
f
1
19200
19198
⋯
4
2
f
.
(38)
The total number of tis projections is 9600. The
orange line shows the NMSE by using the convex
projections
19200
19199
⋯
2
1
The total number of
tis projections is 19200. The blue line shows the
NMSE by using the convex projections
19200
⋯
2
1
. The gray dotted line shows the
NMSE by FBP for reference. From Fig. 11 we can see
that the error decreases with increasing the number of
projections and the number of iterations. Figure 12
illustrates the plots of the normalized mean square
error versus SNR with the test image 2. From Fig. 12
we can see that the error decreases with increasing
SNR.
5 CONCLUSIONS
By discretizing the image reconstruction problem, we
applied the method of projection onto convex sets to
the problem and evaluated the image quality. Also,
we evaluated the influence of the noise in
reconstructed image. We showed that the error
decreases with increasing the number of projections
and the number of iterations. Also, we showed that
the error decreases with increasing SNR. However,
by increasing the number of the projections and the
iteration step, time consuming problem arise. And, by
increasing the pixel size of object and the data size of
sinogram, this method requires more computational
time. If we get more priori information with respect
to an object, this method can decrease the normalized
mean square error in comparison to FBP.
In this study, there are many prior constraints
except for our constraints used. If prior constraints are
closed and convex set, these sets can be incorporated
in this method. Therefore, it is necessary to create
mathematically the subset in Hilbert space.
Moreover, there are many parameters, such as initial
data, the relaxation parameter and the pixel size of
reconstructed image. The image quality of
reconstructed image and the speed of the convergence
in this method are affected by these. It is necessary to
find the optimal parameters. These become the future
problems.
REFERENCES
Herman, G., 2009. Fundamentals of Computerized
Tomography, Springer-Verlag. London, 2
nd
edition.
Image Reconstruction by the Method of Convex Projections
31

Kak, A., Slaney, M., 1988. Principles of computerized
tomographic imaging, IEEE Press. New York.
Imiya, A., 1985. A direct method of three dimensional
image reconstruction form incomplete projection, Dr.
Thesis, Tokyo Institute of Technology, Tokyo. (in
Japanese)
Bertero, M., Mol, C., Pike, E., 1985. Linear inverse
problems with discrete data. I: General formulation and
singular system analysis, Inverse Problems, 1, pp.301-
330.
Bertero, M., Mol, C., Pike, E., 1988. Linear inverse
problems with discrete data: II. Stability and
regularization”, Inverse Problems, 4, pp.573-594.
Stark, H., Yang, Y., 1998. Vector Space Projection, John
Wiley & Sons Inc. NY.
Sezan, M., Stark, H., 1984. Tomographic image
reconstruction from incomplete view data by convex
projections and direct Fourier inversion, IEEE Trans.
Med. Imaging, 3, pp. 91-98.
Sezan, M., Stark, H., 1982. Image restoration by the method
of convex projections: part 2-applications and
numerical results, IEEE Trans. Med. Imaging, 1,
pp.95-101.
Oskoui-fard, P., Stark, H., 1988. Tomographic image
reconstruction using the theory of convex projections,
IEEE Trans. Med. Imaging, 7, pp.45-58.
Kudo, H., Saito, T., 1991. Sinogram recovery with the
method of convex projections for limited-data
reconstruction in computed tomography, J. Opt. Soc.
Am. A, 8, pp. 1148-1160.
Bauschke, H., Combettes, P., Luke, D., 2003. Hybrid
projection-refrection method for phase retrieval, J. Opt.
Soc. Am. A, 20, pp.1025-1034.
Natterer, F., 2001. The Mathematics of Computerized
Tomography, SIAM. Philadelphia.
Youla, D., Webb, H., 1982. Image restoration by the
method of convex projections: part 1-theory, IEEE
Trans. Med. Imaging, 1, pp.81-94.
Takahashi, W., 2000. Nonlinear Functional Analysis,
Yokohama Publishers, Inc. Yokohama.
Censor, Y., Elfving, T., Herman, G., Nikazad, T., 2008. On
diagonally-relaxed orthogonal projection methods,
SIAM J. Sci. Comput. 30, pp.473-504.
Press, W., Teukolsky, S., Vetterling, W., Flannery, B., 1992.
Numerical Recipes in C, Cambridge University Press.
Cambridge, 2
nd
edition.
Trussel, H., Vrhel, M., 2008. Fundamentals of Digital
Imaging, Cambridge University Press. Cambridge.
Simmons, G., 1963. Topology and Modern Analysis,
McGraw-Hill Inc. Singapore.
Wouk, A., 1979. A Course of Applied Functional Analysis,
John Wiley & Sons Inc. NY.
APPENDIX
Here, the definition of closed and convex sets and
weakly convergent used by this paper are described
below (Simmons, 1963, Wouk, 1979).
Definition A.
Let be an arbitrary Hilbert space. A convex set in
is a non-empty subset with the property that if
and are in , then
1
is also in for every real number such that 0
1.
Definition B.
A subset of metric space is called a closed set if
it contains each of its limit points.
Definition C.
Let be a normed linear vector space,
′
its dual,
and
a sequence in . The sequence
is called
a weak Cauchy sequence if
〈
,
′
〉
is a Cauchy
sequence for every
′
in
′
. We say
is weakly
convergent to , written
→, →∞, if
〈
,
′
〉
→
〈
,
′
〉
, →∞ for every
′
∈
′
.
PHOTOPTICS 2020 - 8th International Conference on Photonics, Optics and Laser Technology
32
