Classification, Localization and Captioning of Dangerous Situations
using Inception-v3 Network and CAM
Sichen Zhang
1
, Axel Heßler
2
and Ming Zhang
3 a
1
Department of Electrical Engineering and Computer Science, Technische Universit
¨
at, Berlin, Germany
2
DAI-Labor, Technische Universit
¨
at Berlin, Berlin, Germany
3
Department of Mechanical Engineering, Tsinghua University, Beijing, China
Keywords:
Dangerous Situation, Object Detection, CNN, Inception-v3, CAM, Machine Learning.
Abstract:
An early situation assessment is an important aspect during emergency missions and provides useful informa-
tion for fast decision making. However, many situations can be dangerous and visually hard to analyze due
to the complexity. With the recent development in the field of artificial intelligence and computer vision there
exists a wide range of application possibilities including automatic situation detection. However, many related
works focused either on event captioning or on dangerous object detection. Therefore in this paper, a novel ap-
proach for simultaneous recognition and localization of dangerous situation is proposed: Two different CNN
architectures are used, whereas one of the CNN, the Inception-v3, is modified to generate Class Activation
Map (CAM). With CAM it is possible to generate bounding boxes for recognized objects without being ex-
plicitly trained for it. This eliminates the need for large image dataset with manually annotated boxes. The
information about the detected objects from both networks, their spatial-relationships and the severity of the
situation are then analyzed in the situation detection module. The detected situation is finally summarized in
a short description and made available for the emergency managers to support them in fast decision makings.
1 INTRODUCTION
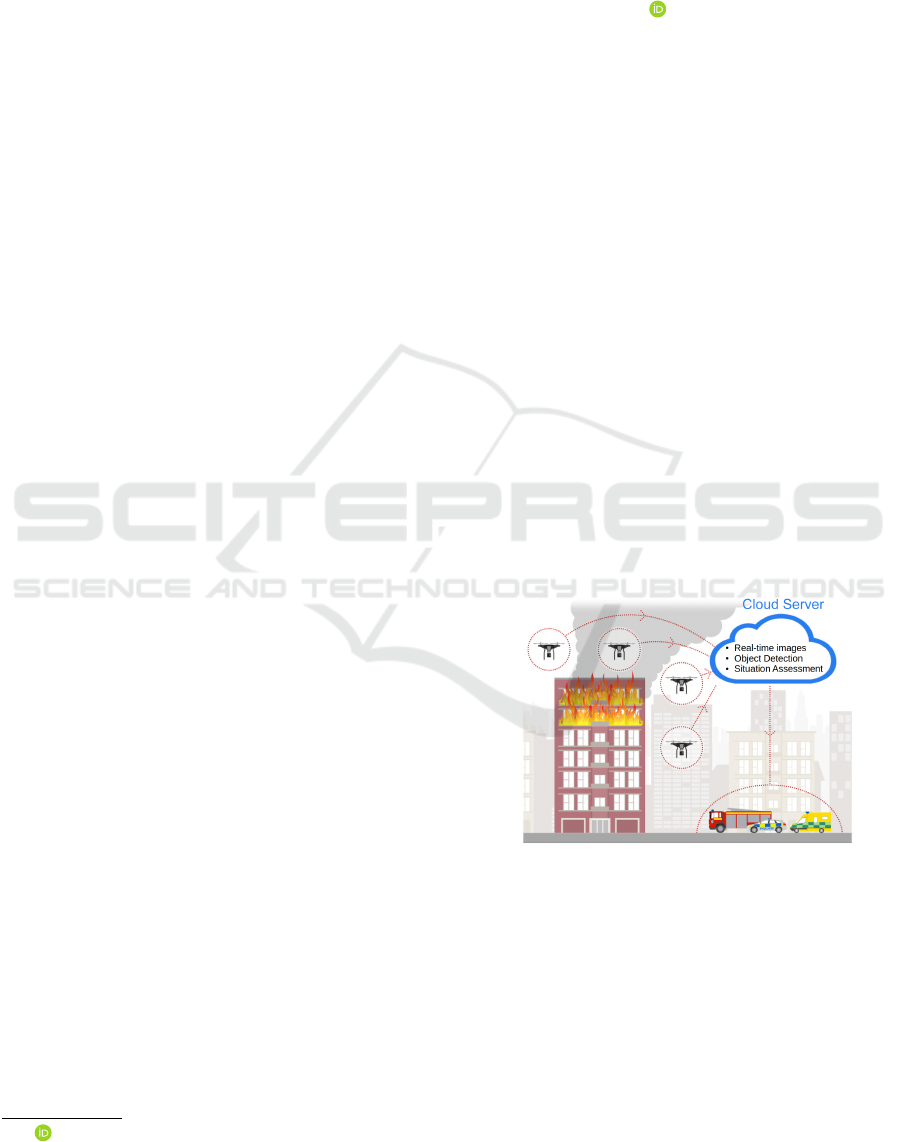
Hazardous situations happen everywhere and every-
time, which may cause damages to its surroundings.
For such situations UAVs like drones equipped with
cameras are increasingly used in the past few years.
They have the advantage to capture the dangers from
a safe distance without humans being exposed to the
hazards. Recorded real-time images are processed on
cloud server and the analyzed information is given
back to the ground operators to support them in sit-
uation assessment and monitoring (Figure 1).
However, the biggest challenge of the situation as-
sessment is analyzing and extracting important infor-
mation, especially in emergency cases and dangerous
situations. Detecting objects captured by cameras can
be difficult with traditional computer vision methods
due to the many image features to be known before-
hand. Therefore, solving this problem with AI-based
methods brings more advantages, because image fea-
tures are learned on its own during the training phase.
In this paper an AI-based model is presented for
a
https://orcid.org/0000-0001-5803-5140
Figure 1: Example use of drones in emergency operations
(Russon, 2019).
detecting and captioning dangerous situations.
In detail, the proposed model consists of two
parts: object detection and situation detection. In ob-
ject detection part, two different Convolutional Neu-
ral Networks (CNN) for recognizing different object
classes are implemented. While the pretrained SSD
MobileNet V2 (Liu et al., 2015) is responsible for de-
tecting normal neutral objects, the Inception-v3 net-
work is retrained for identifying dangerous objects.
In addition, the Inception-v3 is modified to generate
48
Zhang, S., Heßler, A. and Zhang, M.
Classification, Localization and Captioning of Dangerous Situations using Inception-v3 Network and CAM.
DOI: 10.5220/0008911800480057
In Proceedings of the 12th International Conference on Agents and Artificial Intelligence (ICAART 2020) - Volume 2, pages 48-57
ISBN: 978-989-758-395-7; ISSN: 2184-433X
Copyright
c
2022 by SCITEPRESS – Science and Technology Publications, Lda. All rights reserved
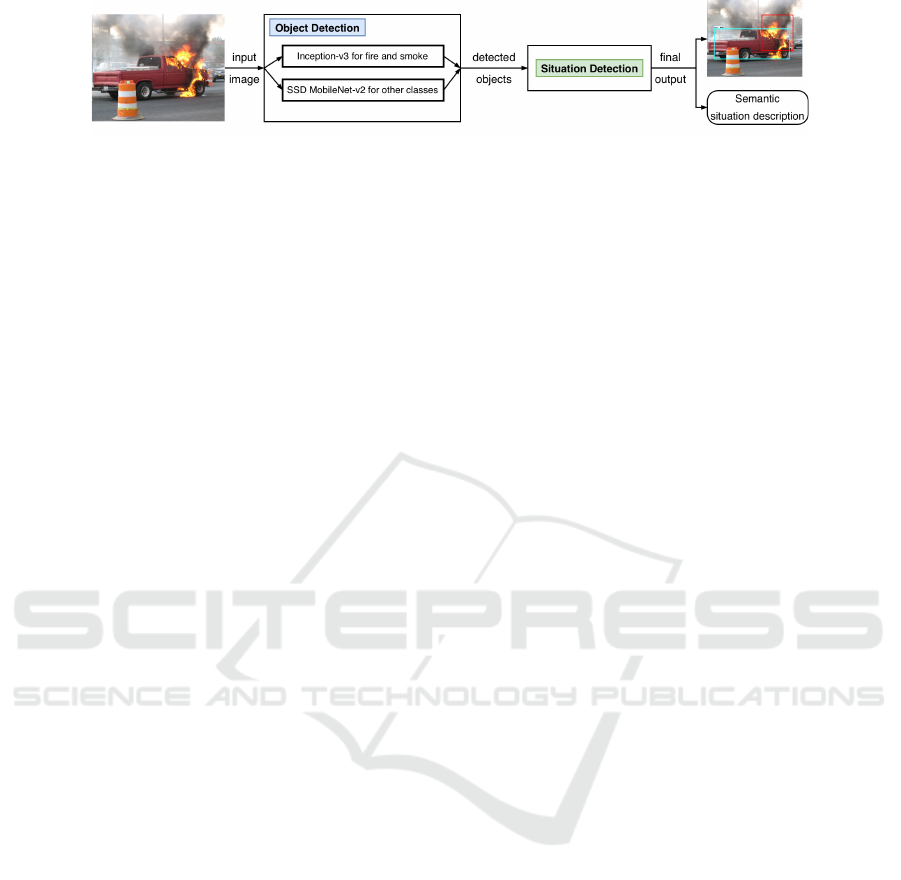
Figure 2: Proposed model architecture for detecting and describing dangerous situation.
Class Activation Map (CAM) based on the work of
Zhou et al. (2015). It gives the network the ability
to locate objects by drawing a bounding box around
the predicted object without being explicitly trained
with annotated ground truth boxes. This significantly
reduces the time and effort in creating an annotated
image dataset. Afterwards, the outputs from both net-
works are joined and passed forward to the situation
detection part, where the correlation between the lo-
cation of the detected objects is analyzed and their
size roughly estimated. Finally, the model outputs a
semantic description about the detected situation. The
developed model is evaluated with test dataset on their
effectiveness and detection performance.
The main contribution of this paper is the de-
velopment of a model, which is able to detect, lo-
cate and describe dangerous situation simultaneously
only with image-level annotations in the training
dataset. Also, the results shows, that the performance
achieved similar results to related works, which are
trained explicitly with large annotated dataset con-
taining bounding boxes.
2 RELATED WORK
Fundamental image captioning and object detection
with CNN is well researched and applied success-
fully on different fields. Most of the related work
focused either on image event captioning or locating
dangerous objects with CNN, but not simultaneously.
For example in Muhammad et al. (2018), Wang et al.
(2015), Ahsan et al. (2017), Arriaga et al. (2017), they
are able to recognize situations and events captured
in the images, but they lack the information about
the location of the dangerous objects. In order to
achieve that, the network needs to be trained with
large annotated datasets like ImageNet (Russakovsky
et al., 2014), Places Dataset (Zhou et al., 2016) and
OpenImages (Kuznetsova et al., 2018). Existing well-
known object detection networks are SSD (Liu et al.,
2015), Faster R-CNN (Ren et al., 2015) and YOLO
(Redmon and Farhadi, 2016), which are trainined
with those large datasets. Furthermore, many papers
have shown, that the feature maps in deep CNNs are
actually highlighting the parts in the images, which
are responsible for the high classification score (Zeiler
and Fergus, 2013), (Yosinski et al., 2015), (Zhou
et al., 2014). Some works, like Muhammad et al.
(2018) and Zhou et al. (2015) use the feature maps to
locate the detected objects, although both used meth-
ods are different. In Muhammad et al. (2018) they
produced a binary image highlighting the location by
averaging different feature maps from the SqueezeNet
CNN (Iandola et al., 2016). They achieved a F1-
score of 91%. Zhou et al. (2015) instead used global
average pooling to calculate weighted feature maps
for generating Class Activation Maps (CAM). They
achieved 42.9% top-5 error for object localization
without explicitly trained on any annotated bounding
boxes and thus, saving timing and efforts.
3 METHODOLOGY
3.1 Proposed Model
The proposed model consists of two parts as depicted
in Figure 2: object detection and situation detection.
In object detection part, two different CNN are used.
Fire and smoke objects are detected with Inception-
v3 network (Szegedy et al., 2015) and other neu-
tral objects with SSD MobileNetV2 (Sandler et al.,
2018). SSD MobileNetV2 comes as pretrained model
and detects normal images containing people, car and
house objects. Inception-v3 is retrained on self-made
image dataset containing fire and smoke classes. At
the same time, the Inception-v3 is modified based on
the work of Zhou et al. (2015) by generating CAM.
By combining the advantages of CAM and the high
accuracy classification performance of Inception-v3
network, it is possible to locate class-specific im-
age regions in a single forward-pass without provid-
ing annotated bounding box in the training dataset.
A bounding box is then drawn directly from CAM
around the segmented area with predefined threshold
value.
Classification, Localization and Captioning of Dangerous Situations using Inception-v3 Network and CAM
49
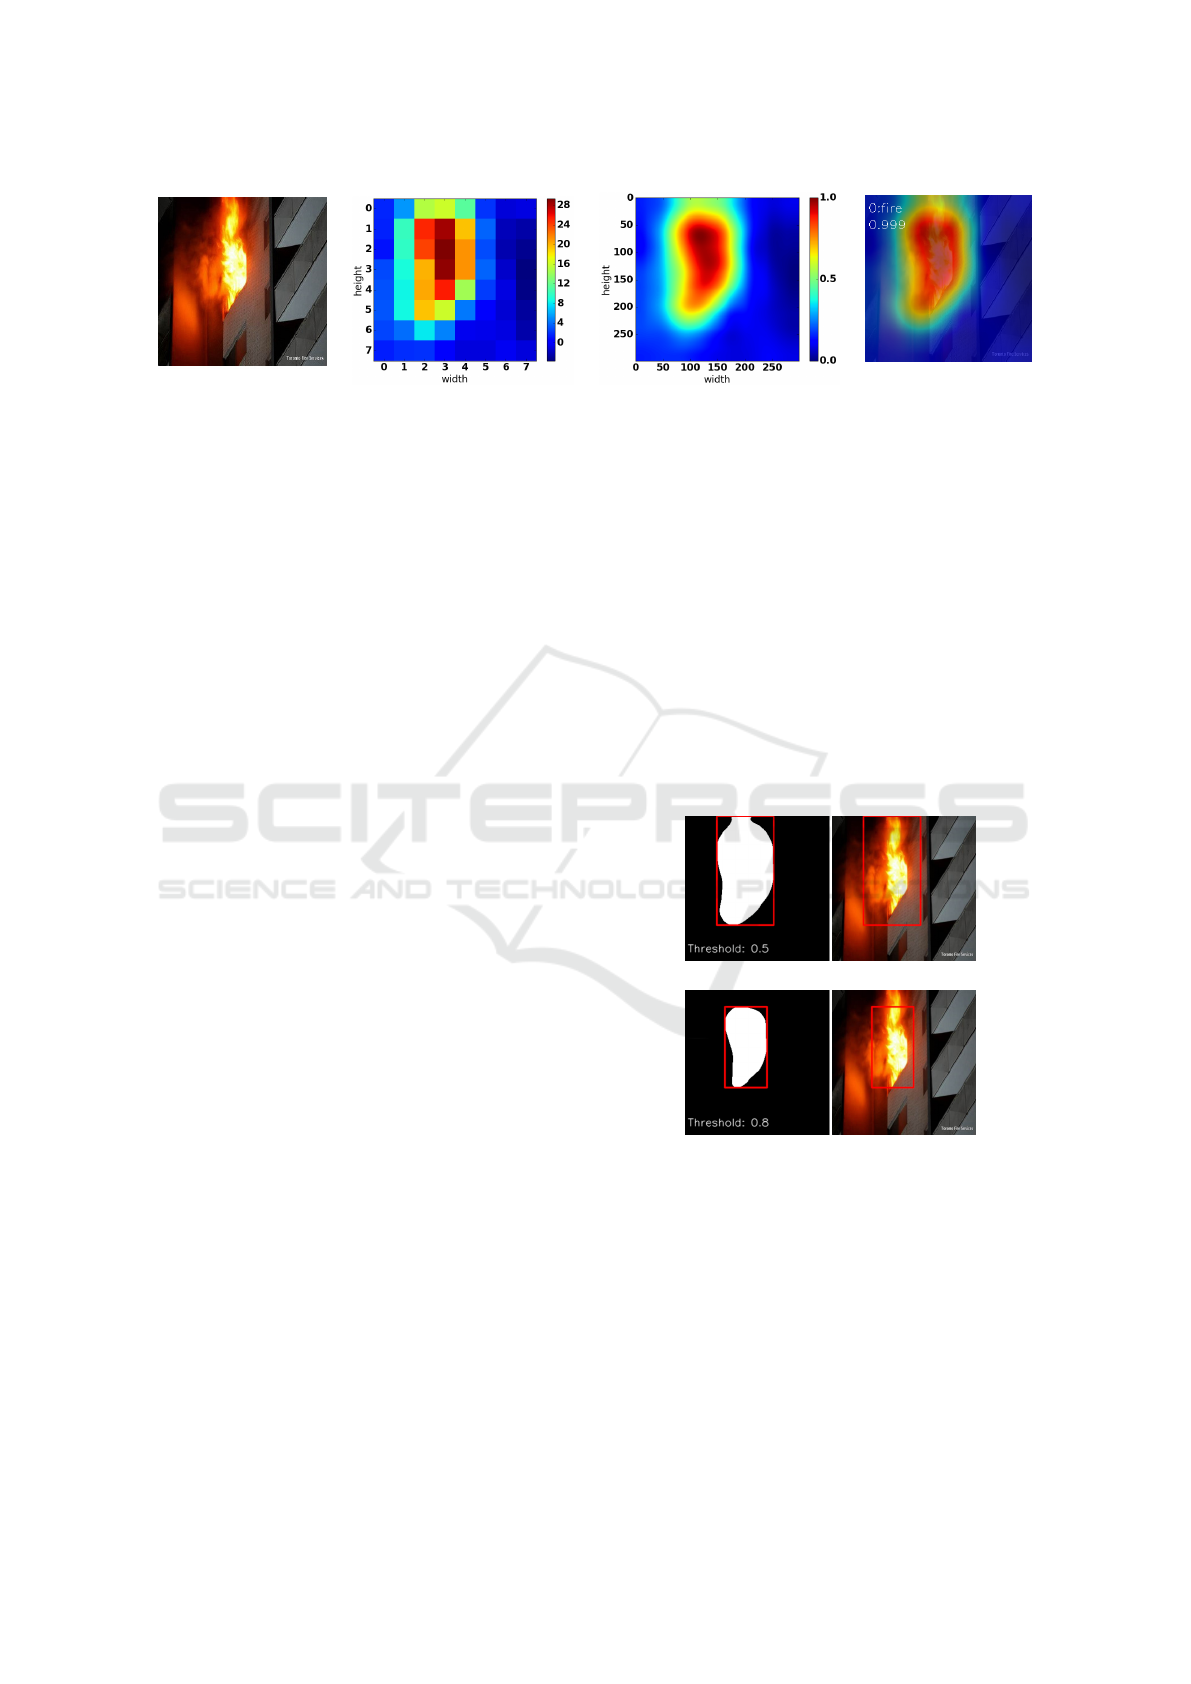
(a) Input image 299 ×
299 pixel
(b) CAM 8 × 8 pixel (c) CAM 299 × 299 pixel (d) CAM overlay
Figure 3: The initial CAM is calculated from the feature maps in the last convolutional layer and has the dimension 8 × 8
pixel (b), which is then upscaled with bicubic interpolation to 299 × 299 pixels (c). The final CAM is overlaid on the input
image along with the predicted class and probability (d).
3.2 Modifying Inception-v3 with CAM
The last prediction layer of Inception-v3 is modified
for classifying three classes: fire, smoke and non-
fire-smoke. The pretrained weight parameters before
the last layer are maintained. In order to generate
CAM based on Zhou et al. (2015) the original average
pooling layer in Inception-v3 network is changed to
global average pooling layer. In mathematical form,
the CAM is then calculated as follows:
CAM
c
(x, y) =
N
∑
n=0
w
c
n
f
n
(x, y) (1)
where w
c
n
is the weight corresponding to one class c
and n for the number of feature maps computed in the
previous convolution layer. f
n
(x, y) denotes the acti-
vation values of the n-th feature map stored in spatial
form (x, y). The sum of weights and the activation
values over all feature maps yields in the CAM. In the
last prediction layer, the probability for a given class
is calculated with sigmoid function instead with soft-
max, because the probability of each class needs to
be predicted independently with its own score. In this
way multiple objects in the image can be detected at
the same time.
3.3 Localization with modified
Inception-v3
The resolution of the initial CAM with 8 × 8 pix-
els created from Inception-v3 is very low and inac-
curate for localization tasks. Thus, it is upscaled to
299 × 299 pixels using bicubic interpolation to match
the input image size of Inception-v3 network. At last,
the normalized CAM is overlaid on the input image
together with the predicted class and probability. The
image processing steps are pictured in Figure 3. In
order to locate objects from CAM, the regions as-
sociated with predicted class are segmented, where
the activation value is above a predefined threshold
value. For example a threshold value of 0.5 means,
that CAM activation values, which are above 0.5, are
extracted. A straight bounding box is then drawn
around the borderline of the smallest possible area en-
closing the segmented contour. By varying the thresh-
old value, the size of the bounding box also changes,
which would directly affect the localization perfor-
mance. In Figure 4, the different size of segmented
area and the corresponding bounding box is shown
with example threshold value 0.5 and 0.8.
(a) Threshold value: 0.5
(b) Threshold value: 0.8
Figure 4: Creating different bounding box sizes with seg-
ment threshold value 0.5 (a) and 0.8 (b) from the CAM.
3.4 Situation Description
After the fire and smoke objects have been classified
and located through Inception-v3 and CAM, the de-
tection of other non-hazardous objects like houses,
cars and people is done with pretrained SSD Mo-
bileNetV2 model, which also outputs object bound-
ing box coordinates. The given information of both
networks are then processed in the situation detection
ICAART 2020 - 12th International Conference on Agents and Artificial Intelligence
50
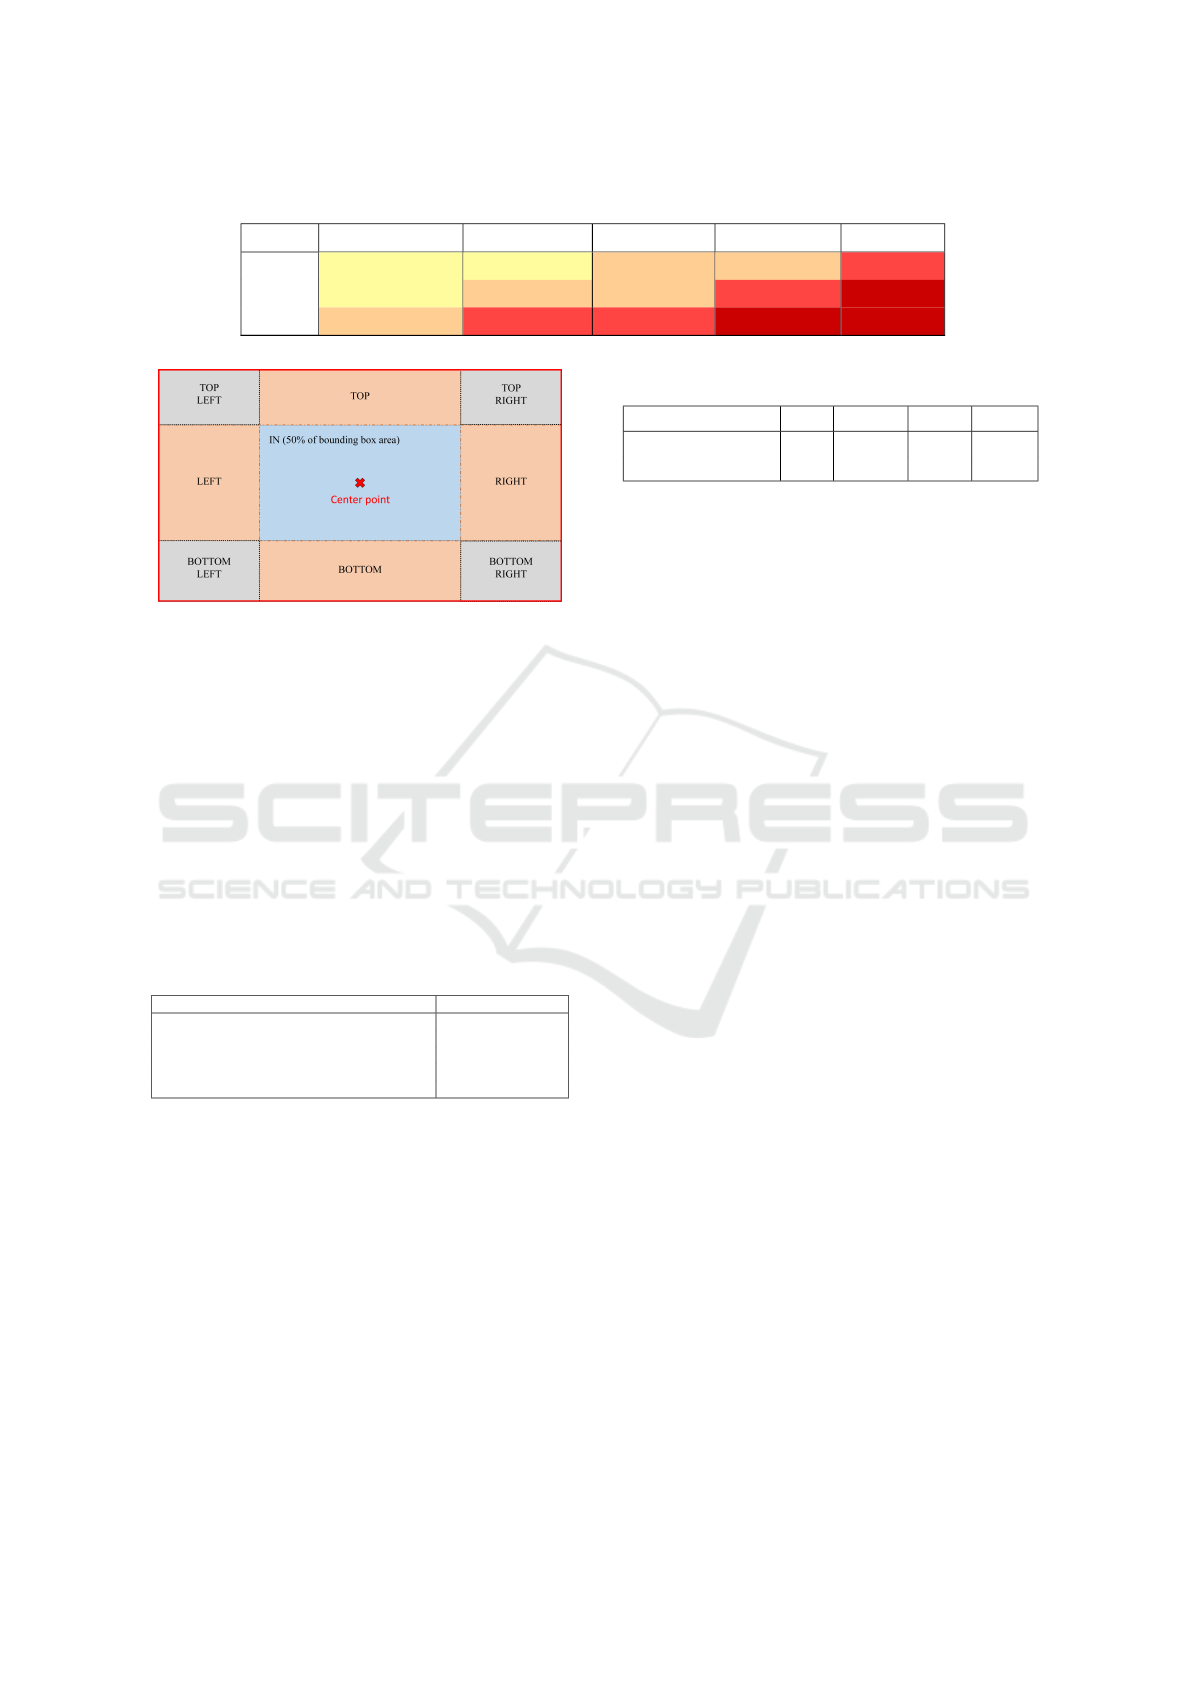
Table 1: Categorization of severity based on reference objects and their size percentage differences.
(-100%, -50%) (-50%,-10%) (-10%,10%) (10%,100%) (100%,∞)
person small a small a small b small b medium
car small a small b smallb medium large
house small b medium medium large large
Figure 5: Comparing the center point of the object bounding
box to determine their spatial relationship.
part, where the composition of dangerous and nor-
mal objects are estimated and analyzed as well as the
severity of the detected situation. The size of fire and
smoke is measured firstly by taking a non-hazardous
objects as a reference object. For instance, the bound-
ing box of a car can be specified as a reference box
and the size of other dangerous objects like fire are
then compared to it. The percentage size difference of
a dangerous object to the reference object defines the
size difference description. The assignment is listed
in Table 2.
Table 2: Description of object size according to the percent-
age size difference to the reference object.
Percentage size difference to reference object Description
below -50% half as small than
-50% to -10% smaller than
-10% to 10% about the same size
+10% to +100% bigger than
above +100% twice as big than
Next, the situation description can be extended with
defining the severity of fire or smoke based on the
standard DIN 14010. In DIN 14010 the severity of
fire are categorized by the number of water hoses
used for extinguishing the fire. The categorization of
smoke severity is assumed to be identical as fire. The
severity categorization is shown in the Table 1. For
simplicity, only three major objects are considered as
reference objects: person, car and house. They also
represent three major average size magnitudes.
With the size and severity described, the spatial
relationship between dangerous and normal objects
in the image are then measured by analyzing their
bounding box positions. There exists five elemen-
Table 3: Statistics of used dataset.
Dataset fire smoke other Total
Train / validation 200 100 500 800
Test 60 60 80 200
tary composition cases in the image plane, which can
be combined together: left, right, top, bottom and in-
side. In detail, the center points of all detected object
bounding boxes in the image are obtained beforehand
and the position relative to each other are then com-
pared. Boxes, which center points lies outside the in-
ner box, are then assigned to the preposition descrip-
tion according to their occupied areas shown in Fig-
ure 5. Furthermore, objects of the same class closely
to each other are grouped together.
4 EXPERIMENTS
4.1 Dataset Overview
The dataset for training and evaluating the model con-
tains a total of 1000 images, which is divided into
80% training/validation and 20% test dataset. The im-
ages are mainly collected from Sharma et al. (2017),
but extra images with different resolutions were added
from the internet. Table 3 gives an overview about the
number of used image data and its distribution over
the two datasets. The image classes are imbalanced
in order to reproduce real world occurrences, i.e. fire
and smoke occur much less frequently than normal
objects. Figure 6 shows some sample images from the
training/validation dataset for each class. Various fire
and smoke shapes, sizes, colors under different light
conditions like daytime and nighttime are included in
the dataset in order to increase diversity. Also, some
images contain different view angles like aerial views,
which were captured from drones or helicopters dur-
ing emergency operations. The negative image subset
contains humans, pets, cars and other ordinary non-
hazardous items.
Also images, which resemble fire and smoke in
shape and color, such as sunsets, orange light bulbs
and autumn leaves, were added to the negative image
dataset. At last, the model is evaluated with the test
Classification, Localization and Captioning of Dangerous Situations using Inception-v3 Network and CAM
51
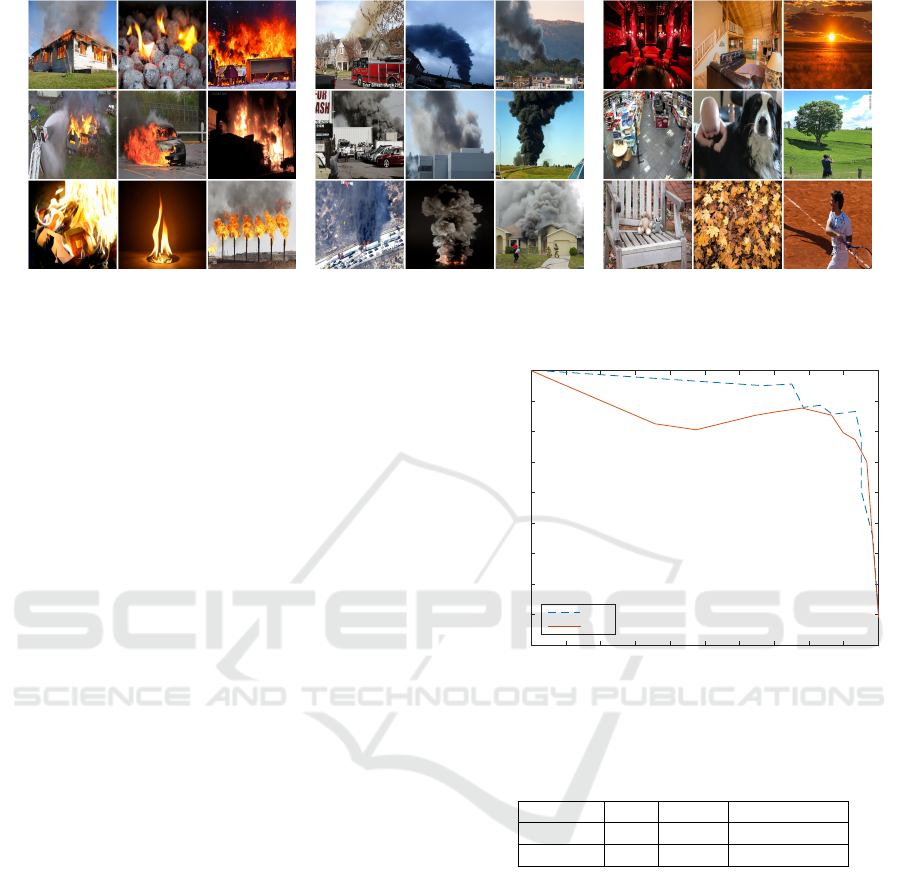
(a) fire (b) smoke (c) negative (no fire and smoke)
Figure 6: Sample images from the training dataset containing fire, smoke and other objects.
dataset, which contains 60 images each for fire and
smoke and 80 images for negative objects, totaling
200 images. For evaluating the localization perfor-
mance, each positive image from the test dataset was
manually labeled with bounding boxes whereas neg-
ative images do not contain any boxes. The labeling
tool used for this work is LabelImg (Lin, 2015).
4.2 Training
The final layers of the modified Inception-v3 net-
work are retrained with RMSprop optimizer and a
batch size of 8 using cross-validation. The pretrained
weights were loaded from the Tensorflow Model Zoo
(Silberman and Guadarrama, 2016). The learning rate
is initially set to 0.001, but decreases exponentially
with decay factor of 0.94. The loss in the predic-
tion layer is computed with the sigmoid cross entropy
function. During the cross-validation training, the
model achieved the highest accuracy, lowest training
loss and lowest evaluation loss at around 3300 global
training steps, where the final model is also selected
and evaluated.
5 RESULTS
5.1 Results of Image Classification
In Figure 7 the image classification precision-recall
curve is shown for fire and smoke objects respectively.
The model achieved in image classification an AP of
0.938 for fire and 0.907 for smoke class respectively.
The overall mAP score is 0.923, which is calculated
by averaging both AP values of both classes. The Ta-
ble 4 lists both AP and mAP scores along with the
corresponding F1-score.
recall
0 0.1 0.2 0.3 0.4 0.5 0.6 0.7 0.8 0.9 1
precision
0.55
0.6
0.65
0.7
0.75
0.8
0.85
0.9
0.95
1
Precision-Recall-Curve for fire and smoke
fire
smoke
Figure 7: Classification precision-recall curve for fire (blue)
and smoke (orange).
Table 4: AP of image classification for each class and the
mAP.
fire smoke mean value
AP 0.94 0.91 0.925 (mAP)
F1-score 0.90 0.85 0.875
5.2 Results of Object Detection
As prerequisite, images with a confidence score over
0.5 in classification task are considered for generat-
ing bounding boxes from the resulting CAM. The
Intersection-over-Union (IoU) scores of the predicted
bounding boxes are determined against the ground
truth. The localization results from the CAM is mea-
sured by adjusting the threshold value for segmenting
the regions (Section 3.3). The segmentation thresh-
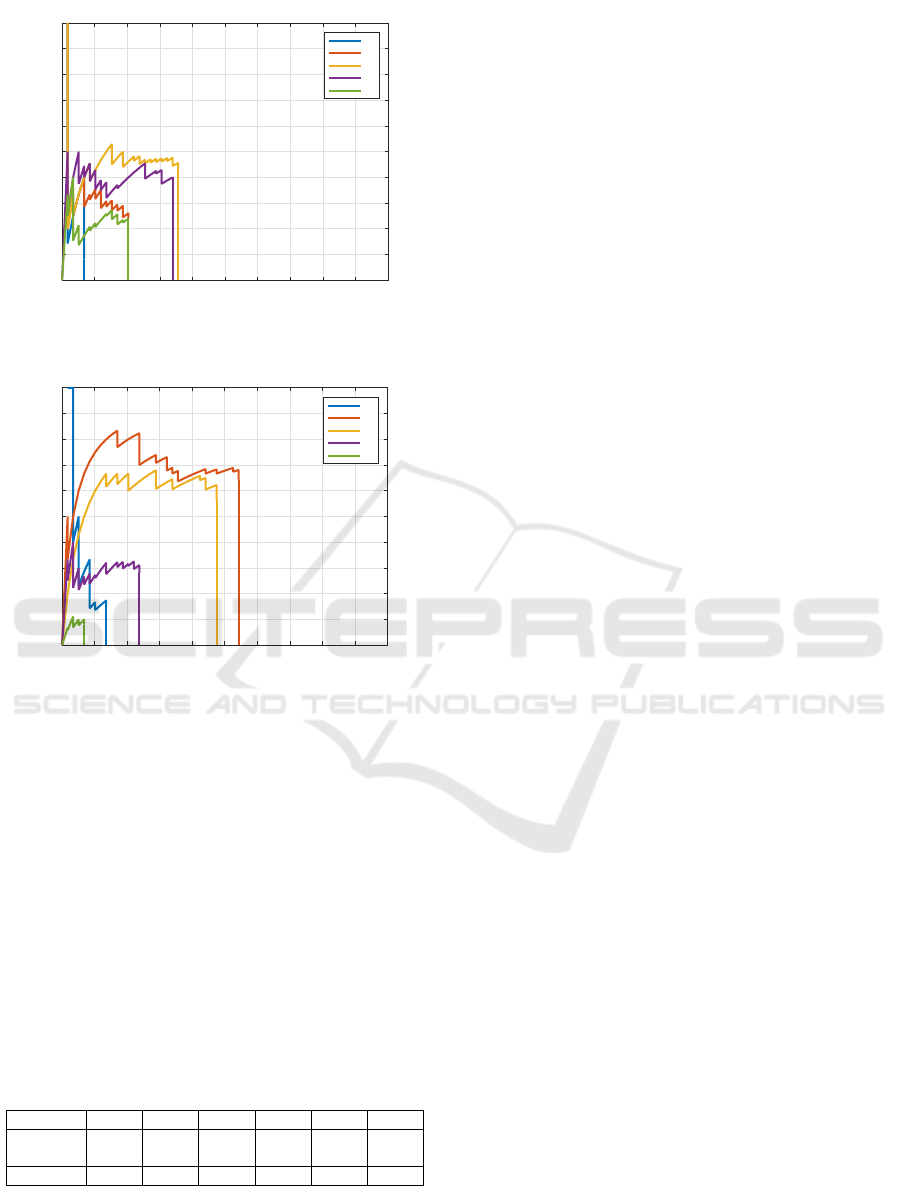
old moves between 0.1 to 0.9 in 0.2 steps. Figure 8
shows the precision-recall curve for fire and smoke
class respectively. It can be seen from the figures,
that the threshold value affects the localization per-
formance in general. The best performance can be
ICAART 2020 - 12th International Conference on Agents and Artificial Intelligence
52
recall
0 0.1 0.2 0.3 0.4 0.5 0.6 0.7 0.8 0.9 1
precision
0
0.1
0.2
0.3
0.4
0.5
0.6
0.7
0.8
0.9
1
fire
0.1
0.3
0.5
0.7
0.9
(a) fire
recall
0 0.1 0.2 0.3 0.4 0.5 0.6 0.7 0.8 0.9 1
precision
0
0.1
0.2
0.3
0.4
0.5
0.6
0.7
0.8
0.9
1
smoke
0.1
0.3
0.5
0.7
0.8
(b) smoke
Figure 8: Precision-recall curve at different segmentation
thresholds for fire (a) and smoke (b).
found at threshold of 0.5 for fire and 0.3 for smoke.
Further increase of the threshold value cause the per-
formance to drop significantly. The AP scores for the
localization task are listed in the Table 5 along with
the corresponding mAP scores. For smoke objects
the model achieved the best AP score of 0.42 at the
threshold 0.3. On the contrary, the best AP score for
fire object is 0.23 at the threshold 0.5, which is nearly
55% less than the AP score for smoke. By consider-
ing both classes, the model performed the best at the
threshold 0.3 with an overall score of 0.285.
Table 5: AP and mAP for fire and smoke at different seg-
mentation threshold value.
threshold 0.1 0.3 0.5 0.7 0.8 0.9
fire 0.10 0.15 0.23 0.17 0.17 0.08
smoke 0.11 0.42 0.31 0.10 0.01 0.00
mAP 0.105 0.285 0.270 0.135 0.090 0.040
In Figure 9 and Figure 10 the generated bounding
boxes are shown for fire and smoke respectively. The
red rectangle represents the predicted bounding box
and the green one is the ground truth which is anno-
tated manually. The CAM along with the classifica-
tion score is illustrated at the right side, visualizing
the segmented region. In Figure 9b and Figure 10b
the segmented regions from the CAM is inaccurate,
resulting in an IoU score lower than 0.5. But on closer
inspection, the center of the ROI actually shows accu-
rately the location of fire and smoke, even though the
size of the predicted bounding box does not match
the ground truth. For false positive images, the CAM
highlights locations, where it thinks the predicted ob-
ject should be. For example the pizza salami as fire in
Figure 9c and clouds as smoke in Figure 10c.
5.3 Results of Situation Detection
The output results from object detection part are
passed forward to the situation detection part, where
these information are analyzed for object size, their
spatial relationship and the severity of the situation.
The accuracy and logical plausibility of the situation
description output therefore depends on the outputs in
the previous part and are evaluated manually. Some
of the best outputs from the model are given for fire
in Figure 11 and smoke in Figure 12. The predicted
bounding boxes from fire and smoke are marked as
red, whereas the blue boxes locate non-hazardous ob-
ject. The dark blue box represents the detected object
group of the same class and the number of these ob-
jects is given in the description. It can be seen from
the figures, that based on the correct object detection,
the given situation is described accurately. Also, the
severity is assigned properly according to the defini-
tion in DIN 14010. When the detection is inaccurate,
the model then gives a wrong description, which can
be seen in the first image of Figure 13a.
6 DISCUSSION
The classification of dangerous objects achieved high
accuracy, even after the pretrained Inception-v3 net-
work is modified with CAM and sigmoid prediction
layer. Furthermore, it can be observed in Figure 9b
and Figure 10b, that the model has problems in de-
tecting small or distorted objects, like instead seg-
menting the smoke in vertical way, the CAM shows
a round area, which is not accurate. However, the
main location of smoke in the image is identified cor-
rectly, when the center points of the boxes are con-
sidered. The network also has difficulties in distin-
guishing fire and smoke from other neutral objects,
which have a high resemblance in shape and color
Classification, Localization and Captioning of Dangerous Situations using Inception-v3 Network and CAM
53
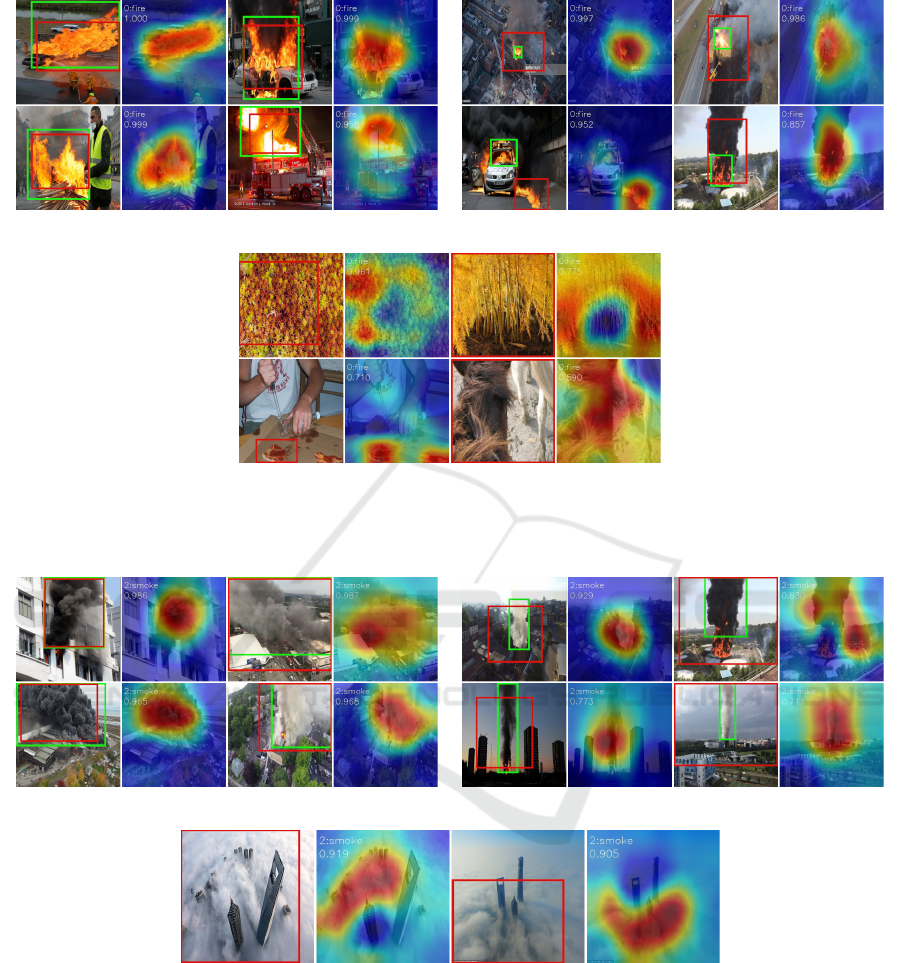
(a) Bounding boxes with IoU scores over 0.5 (b) Bounding boxes with IoU scores below 0.5
(c) Bounding boxes with IoU scores over 0.5 on false posi-
tive images
Figure 9: Bounding boxes generated for fire objects.
(a) Bounding boxes with IoU scores over 0.5 (b) Bounding boxes with IoU scores below 0.5
(c) Bounding boxes with IoU scores over 0.5 on false positive images
Figure 10: Bounding boxes generated for smoke objects.
such as autumn leaves or clouds. To increase the num-
ber of correct classifications and the accuracy of the
predicted bounding boxes, more images with differ-
ent object sizes, view angles and similarities to fire
and smoke can be added to the training dataset. Using
CNNs as an approach for detecting objects brings sig-
nificant improvement in the performance compared to
color and texture based detection (Chino et al., 2015).
The proposed model even achieved only 1% lower
F1-score than the fine-tuned AlexNet in Muhammad
et al. (2018), for which they reached a 0.89 F1-score.
However, they trained their network with ten times
more images than the training dataset used in this
work. Even though the results in fire classification
are surpassed by methods developed in Frizzi et al.
(2016) and Mao et al. (2018), but their work could
only predict one single object class. The proposed
model on the contrary is able to detect two dangerous
ICAART 2020 - 12th International Conference on Agents and Artificial Intelligence
54
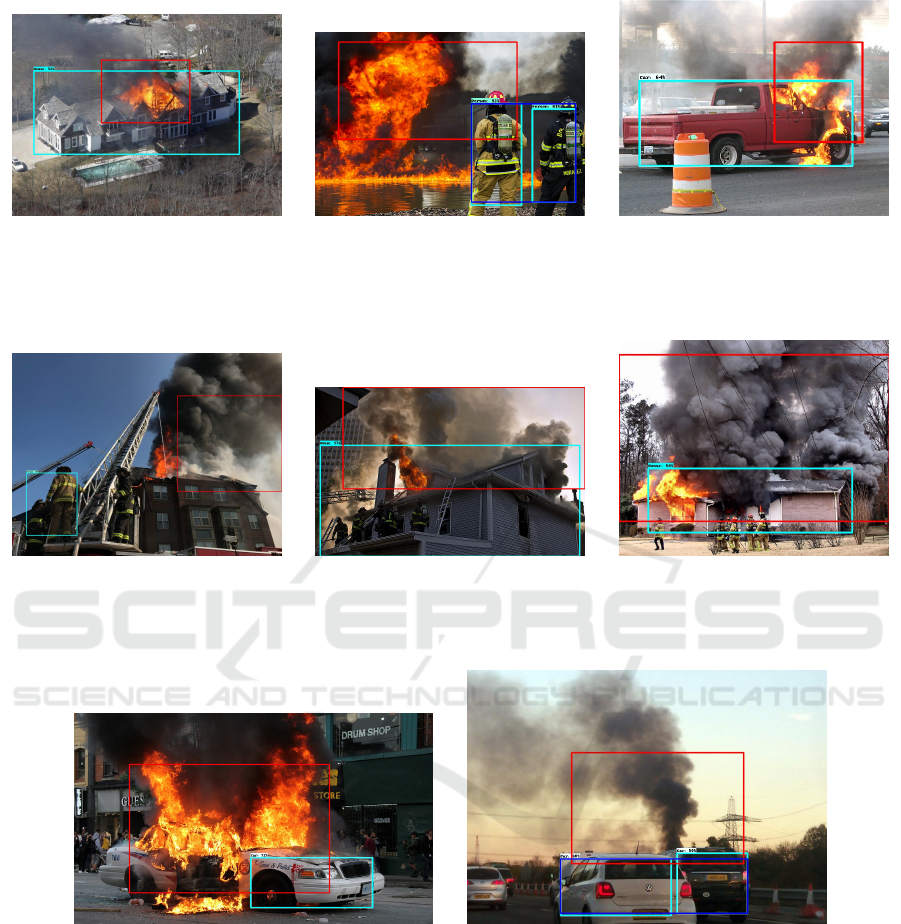
(a) ”Situation: fire is located TOP of
1 House and is smaller than House.
Severity: medium”
(b) ”Situation: fire is located TOP
LEFT of 2 Person and is twice as big
as Person. Severity: medium”
(c) ”Situation: fire is located TOP
RIGHT of 1 Car and is smaller than
Car. Severity: small b”
Figure 11: Situation description for fire images.
(a) ”Situation: smoke is located TOP
RIGHT of 1 Person and is twice as big
as Person. Severity: medium”
(b) ”Situation: smoke is located TOP
of 1 House and is smaller than House.
Severity: medium”
(c) ”Situation: smoke is located TOP of
1 House and is twice as big as House.
Severity: large”
Figure 12: Situation description for smoke images.
(a) ”Situation: fire is located TOP LEFT of 1 Car
and is twice as big as Car. Severity: large”
(b) ”Situation: smoke is located TOP LEFT of 2
Car and is twice as big as Car. Severity: large”
Figure 13: Example of bad situation descriptions.
objects independently and with much smaller dataset.
The localization performance of the model is
highly affected by the classification performance, be-
cause it involves segmenting the regions of detected
object classes and deriving the bounding box from
it. Thus higher confidence scores in the classifica-
tion part results in higher accuracy in locating objects,
which can be seen in the Figure 9a and Figure 10a. On
the contrary, the localization results becomes worse
when predicting small or large objects. This can be
explained through the low resolution of the feature
map of the CAM, which originally has 8 × 8 pixel
size. Smaller objects can be easier identified with
higher feature map resolution.
In Table 6 the overall detection mAP scores for
two mainstream CNN models with COCO dataset are
listed: Faster R-CNN and SSD 300. Although the
overall mAP score of the modified Inception-v3 with
0.29 is not comparable with any of the listed net-
works, but the score for one smoke class with 0.42
Classification, Localization and Captioning of Dangerous Situations using Inception-v3 Network and CAM
55
Table 6: Comparison of the mAP scores of different neural
networks in object detection.
Method mAP (IoU ≥ 0.5)
SSD 300 Liu et al. (2015) 0.412
Faster R-CNN Ren et al. (2015) 0.427
Inception-v3 with CAM 0.285 (fire: 0.23, smoke: 0.42)
is still competitive. The fact, that the proposed net-
work is trained without using any bounding box anno-
tations, underlines the good performance even more.
The situation description is based on the accuracy
of both detection output from the classification and
localization. A good object detection leads to a better
situation description as can be seen in Figure 11 and
Figure 12, otherwise the situation description would
not be correct by giving the wrong spatial expression
(see Figure 13). Additionally, it is not possible for the
model to differentiate, whether the detected objects is
positioned in the foreground or background, leading
to wrong spatial relationship description. This can
be seen in the description in Figure 13b: the smoke
should be “BEHIND the car” and not “TOP left of
the car”.
In addition, it is not possible for the model to de-
termine the depth information of the objects, because
it can not differentiate the foreground from the back-
ground in normal planar images. This problem can
be seen in the description of the Figure 13b. In or-
der to obtain the depth information of the objects, the
drones can be equipped with additional sensors like
time-of-flight cameras or LiDAR.
Ultimately, the developed model is meant for de-
tecting situations in still images and, thus, not very
suitable for real-time video detection due to the com-
plexity and the large Inception-v3 network. A possi-
ble solution to optimize the speed and reduce the com-
plexity is using network pruning (Molchanov et al.,
2016) or light-weighted network such as SSD, YOLO
for detection and MobileNet vor classification. Typ-
ically, a little accuracy is then sacrificed for faster
speed.
7 CONCLUSION AND FUTURE
WORKS
The results show, that the proposed model is able to
recognize, locate and describe fire and smoke with
CAM in the modified Inception-v3 network. Com-
pared to other related works, only a small image
dataset is required for this model, because the net-
work is retrained only for the last layer. For clas-
sification task, the retrained Inception-v3 is able to
achieve similar results compared to fully trained net-
works. The high classification performance allows the
model to generate CAM precisely and enabled more
than acceptable results in localization task, even out-
performs the Faster R-CNN for smoke objects. The
performance of the situation description is highly af-
fected by the accuracy of the object classification and
localization parts, because they are involved in pro-
viding necessary information for situation analyzing.
Furthermore, a thorough search of the relevant litera-
ture yielded almost no papers, which are able to de-
tect fire and smoke by providing small image-level
dataset and describe the underlying dangerous situ-
ation in the same time. At this point, the proposed
model provides a valuable contribution for solving
those different tasks. For future works, the model per-
formance can be improved by a larger image training
dataset containing different object classes (e.g. ma-
terial spills, hazard symbols etc.), sizes, light condi-
tions and view angles. To apply the model on UAV
for real-time situation detection tasks, the Inception-
v3 needs to be pruned or exchanged with smaller net-
works like MobileNets. At last, further research can
be conducted on the explanatory power of the situ-
ation description by evaluating the sentences against
human annotated descriptions.
REFERENCES
Ahsan, U., Sun, C., Hays, J., and Essa, I. A. (2017). Com-
plex event recognition from images with few training
examples. CoRR, abs/1701.04769.
Arriaga, O., Pl
¨
oger, P., and Valdenegro-Toro, M. (2017).
Image captioning and classification of dangerous situ-
ations. CoRR, abs/1711.02578.
Chino, D. Y. T., Avalhais, L. P. S., Jr., J. F. R., and Traina, A.
J. M. (2015). Bowfire: Detection of fire in still images
by integrating pixel color and texture analysis. CoRR,
abs/1506.03495.
Frizzi, S., Kaabi, R., Bouchouicha, M., Ginoux, J.-M.,
Moreau, E., and Fnaiech, F. (2016). Convolutional
neural network for video fire and smoke detection. In
Industrial Electronics Society, IECON 2016-42nd An-
nual Conference of the IEEE, pages 877–882. IEEE.
Iandola, F. N., Moskewicz, M. W., Ashraf, K., Han, S.,
Dally, W. J., and Keutzer, K. (2016). Squeezenet:
Alexnet-level accuracy with 50x fewer parameters and
<1mb model size. CoRR, abs/1602.07360.
Kuznetsova, A., Rom, H., Alldrin, N., Uijlings, J., Krasin,
I., Pont-Tuset, J., Kamali, S., Popov, S., Malloci, M.,
Duerig, T., and Ferrari, V. (2018). The Open Im-
ages Dataset v4: Unified image classification, object
detection, and visual relationship detection at scale.
arXiv:1811.00982.
Lin, T. T. (2015). LabelImg - git code.
https://github.com/tzutalin/labelImg.
Liu, W., Anguelov, D., Erhan, D., Szegedy, C., Reed, S. E.,
ICAART 2020 - 12th International Conference on Agents and Artificial Intelligence
56

Fu, C., and Berg, A. C. (2015). SSD: single shot multi-
box detector. CoRR, abs/1512.02325.
Mao, W., Wang, W., Dou, Z., and Li, Y. (2018). Fire recog-
nition based on multi-channel convolutional neural
network. Fire Technology, 54(2):531–554.
Molchanov, P., Tyree, S., Karras, T., Aila, T., and
Kautz, J. (2016). Pruning convolutional neural net-
works for resource efficient transfer learning. CoRR,
abs/1611.06440.
Muhammad, K., Ahmad, J., Lv, Z., Bellavista, P., Yang, P.,
and Baik, S. W. (2018). Efficient deep CNN-based fire
detection and localization in video surveillance appli-
cations. IEEE Transactions on Systems, Man, and Cy-
bernetics: Systems, pages 1–16.
Redmon, J. and Farhadi, A. (2016). Yolo9000: Better,
faster, stronger. arXiv preprint arXiv:1612.08242.
Ren, S., He, K., Girshick, R. B., and Sun, J. (2015). Faster
R-CNN: towards real-time object detection with re-
gion proposal networks. CoRR, abs/1506.01497.
Russakovsky, O., Deng, J., Su, H., Krause, J., Satheesh, S.,
Ma, S., Huang, Z., Karpathy, A., Khosla, A., Bern-
stein, M. S., Berg, A. C., and Li, F. (2014). Ima-
genet large scale visual recognition challenge. CoRR,
abs/1409.0575.
Russon, M.-A. (2019). Drones to the rescue.
https://www.bbc.com/news/business-43906846.
Sandler, M., Howard, A. G., Zhu, M., Zhmoginov, A., and
Chen, L. (2018). Inverted residuals and linear bottle-
necks: Mobile networks for classification, detection
and segmentation. CoRR, abs/1801.04381.
Sharma, J., Granmo, O.-C., Olsen, M. G., and Fidje, J. T.
(2017). Deep convolutional neural networks for fire
detection in images. In EANN.
Silberman, N. and Guadarrama, S. (2016). Tensorflow-
Slim image classification model library.
https://github.com/tensorflow/models/tree/master/
research/slim.
Szegedy, C., Vanhoucke, V., Ioffe, S., Shlens, J., and Wojna,
Z. (2015). Rethinking the inception architecture for
computer vision. CoRR, abs/1512.00567.
Wang, L., Wang, Z., Du, W., and Qiao, Y. (2015). Object-
scene convolutional neural networks for event recog-
nition in images. CoRR, abs/1505.00296.
Yosinski, J., Clune, J., Nguyen, A. M., Fuchs, T. J., and
Lipson, H. (2015). Understanding neural networks
through deep visualization. CoRR, abs/1506.06579.
Zeiler, M. D. and Fergus, R. (2013). Visualizing
and understanding convolutional networks. CoRR,
abs/1311.2901.
Zhou, B., Khosla, A., Lapedriza,
`
A., Oliva, A., and Tor-
ralba, A. (2014). Object detectors emerge in deep
scene cnns. CoRR, abs/1412.6856.
Zhou, B., Khosla, A., Lapedriza,
`
A., Oliva, A., and Tor-
ralba, A. (2015). Learning deep features for discrimi-
native localization. CoRR, abs/1512.04150.
Zhou, B., Khosla, A., Lapedriza,
`
A., Torralba, A., and
Oliva, A. (2016). Places: An image database for deep
scene understanding. CoRR, abs/1610.02055.
Classification, Localization and Captioning of Dangerous Situations using Inception-v3 Network and CAM
57
