
Interrelations between Drug Prescriptions and Diagnoses for SHI
Diabetes Patients using Graph Theoretic Methods and a Markov Model
Reinhard Schuster
1
, Marc Heidbreder
2
, Timo Emcke
3
and Martin Schuster
4
1
Chair of Department of Health Economics, Epidemiology and Medical Informatics,
Medical Advisory Board of Statutory Health Insurance in Northern Germany (MDK), 23554 L
¨
ubeck, Germany
2
Department of Health Economics, Epidemiology and Medical Informatics,
Medical Advisory Board of Statutory Health Insurance in Northern Germany (MDK), 23554 L
¨
ubeck, Germany
3
Chair of Department of Prescription Analysis, Association of Statutory Health Insurance Physicians,
Bismarckallee 1-6, 23812 Bad Segeberg, Germany
4
Faculty of Epidemiology, Christian-Albrechts University Kiel, 24105 Kiel, Germany
Keywords:
Diabetes, Drugs, Diagnoses, Outpatient Treatment, SHI, Graph Communities, Manhattan Distance, ILP,
CPLEX, Markov Model.
Abstract:
We analyze large data sets of diabetes patients in order to get new insights into the dependencies between
drug groups and diagnoses using age, polypharmacy and multimorbidity as covariates. Diagnostic data using
the ICD-10 classification are available with the resolution of quarters. For drugs the exact day of prescription
is available. The analysis uses all co-medication and all diagnoses of all physicians a patient has consulted
within a quarter and is thereby wider than the point of view related to a special physician. The communication
between physicians may be confounded by information deficits due to informal self-diagnostics by the patients.
Differently specialized physicians may apply different guidelines which point to specific diseases. Interactions
between different drugs and different therapy schemes may lead to new diseases for multimorbid patients.
Large data sets create opportunities to detect such interactions. We use a graph theoretic approach with drug
groups as nodes. Using a diagnose vector edges are given by therapeutic neighborhood using the Manhattan
distance. A graph clustering determines drug groups for similarly sick patients which contains indirectly age
and multimorbidity. This can explain cost effects due to the degree of sickness. The graph clustering uses the
modularity method. The underlying algorithm leads to an integer linear program (ILP) which is in general NP-
hard. For the calculations we use Mathematica from Wolfram Research in combination with a python program
using CPLEX from IBM. Drug innovations may lead to changes in drug therapy. Therefore we compare the
steady state solution of the related Markov model with the status quo of drug prescription.
1 INTRODUCTION
In 2017, 425 million people were suffering from dia-
betes worldwide, risen up steadily from an estimated
382 million people in 2013, cf. (International Dia-
betes Federation, 2017), (Shi and Hu, 2014), (World
Health Organization, 2016). Diabetes mellitus crea-
tes a significant clinical and economic burden on so-
ciety, cf. (Songer et al., 1998), (American Diabetes
Association, 1998), (Klein, 2007). Given those num-
bers and economic effects, improving care for patients
with diabetes mellitus has become a priority to natio-
nal health plans, payers, and patients in many coun-
tries. The number and complexity of services requi-
red to manage such patients in accord with the ac-
cepted guidelines chose diabetes mellitus to become
the target of multiple disease management efforts and
initiatives, as well in the fields of professional edu-
cation as in case management. In the present analy-
sis comorbidities for diabetic patients and their re-
lation to the drugs prescribed are considered using
the ICD-10- (International Statistical Classification
of Diseases and Related Health Problems 10th Re-
vision) and ATC-classifications (Anatomic Therapeu-
tic Chemical). We consider how the related diagno-
ses differ with respect to different antidiabetic drugs
at ATC 5th level (Chemical substance). On the one
hand the drug treatment quality depends on the dia-
Schuster, R., Heidbreder, M., Emcke, T. and Schuster, M.
Interrelations between Drug Prescriptions and Diagnoses for SHI Diabetes Patients using Graph Theoretic Methods and a Markov Model.
DOI: 10.5220/0008911603450352
In Proceedings of the 13th International Joint Conference on Biomedical Engineering Systems and Technologies (BIOSTEC 2020) - Volume 5: HEALTHINF, pages 345-352
ISBN: 978-989-758-398-8; ISSN: 2184-4305
Copyright
c
2022 by SCITEPRESS – Science and Technology Publications, Lda. All rights reserved
345

gnoses related national and international guidelines.
On the other hand one has to pay attention to aspects
of drug prescription efficiency is of crucial importan-
ce. Both result in management tools for the statutory
health insurance like regional target agreements. Mo-
dels should help to find optimal solutions with respect
to both aspects. The considered drugs are taken as no-
des of a graph and edges are given by the most equal
diagnostic structure. Starting with the local neighbor-
hood, we get a global graph structure and analyze cha-
racteristics such as graph center or graph periphery
and the graph community structure, cf. (Schuster and
Emcke, 2018). Multimorbidity and polypharmacy are
major problems in elderly patients. On average, pati-
ents above 70 years of age have drugs from more than
seven drug groups at 3rd ATC level (four digits) ad-
ministrated as a daily regime. We analyze the change
of the prescriptions from one quarter to the next by a
Markov Model in order get information about the sta-
bility of the present medication in 2018 and compare
the years 2013 and 2018 with respect to the patients
age and sex.
2 MATERIAL AND METHODS
We analyze all treatments and prescriptions of phy-
sicians for patients of the statutory health insurance
(SHI) by SHI physicians in Schleswig-Holstein, an
administration district in northern Germany (Bundes-
land). Thereby, we compare treatment and prescrip-
tion data from the first and second quarter of 2018
(two successive quarters with respect to the Markov
model) and the second quarter of 2013 in order to
get a five year comparison. The analysis is patient-
centered, meaning that the datasets of all treatments
and prescriptions of all physicians regarding an in-
dividual patient are used. The dataset of the second
quarter of 2018 covers 1,690,683 patients with dia-
gnoses and 1,383,489 patients with drug prescripti-
ons using a pseudonymized patient identity with age
and sex informations. We utilize the three-character
level of the International Statistical Classification of
Diseases and Related Health Problems [ICD]. The sa-
me diagnoses for the same patient by different phy-
sicians are not counted repeatedly. For the prescrip-
tion analysis the International Anatomic Therapeu-
tic Chemical (ATC) classification system with Ger-
man specifications provided by the German Institute
of Medical Documentation and Information (DIMDI)
is used. As antidiabetic drugs, we define the drugs of
the ATC drug groups A10A (insulins and analogues)
and A10B (blood glucose lowering drugs, excl. insu-
lins). There are 208,265 patients with diabetes E10-
E14 (Diabetes mellitus) or O24 (Diabetes mellitus in
pregnancy) and 131,296 patients of 65 years of age
and older among them. Thereby the diabetes preva-
lence regarding all patients within the statutory health
insurance and diagnosed with diabetes is 8.4 % and
the rate of persons insured benefitting from antidiabe-
tic drug therapy is 4.7 %, respectively. For persons of
65 years of age and older, we obtain prevalence values
of 23.5 % regarding diagnoses and 18.3 % regarding
antidiabetic drug therapy. For each drug d by ATC 5th
level we consider which fraction of patients has cer-
tain diagnoses (ICD at the three digit level). Thereby
we get an n-dimensional vector v
d
(n the number of
diagnoses) and a Manhatten distance of two such vec-
tors. We use drugs d by ATC 5th level(7 digits) as
vertices of a graph. With respect to each drug d we
can select m=1, 2, 3 other drug(s) at that ATC 5th le-
vel with smallest distance and get the top 1 to top 3
directed graphs with edges determined by that distan-
ce neighborhood and the induced undirected graphs
G. For these graphs we construct graph communities
using the modularity method. This is done by an ILP
(integer linear program) which is NP-hard. A related
LP (linear program) can be solved in polynomial time
and finally we have to apply a post-processing step:
the rounding of the LP to an ILP result, cf. (Shinano
et al., 2003), (Newman, 2006), (Agarwal and Kem-
pe, 2008). Further graph characteristics are the ver-
tex eccentricity which gives the length of the longest
shortest path from the source u to every other vertex
v in the graph G, the graph periphery gives vertices
that are maximally distant to at least one vertex in the
graph G and the graph center gives the set of verti-
ces with minimum eccentricity in the graph G. If we
use transition coefficients for the change of antidia-
betic drugs of patients from one quarter the next, we
obtain a Markov model. We solve the related eigenva-
lue problem for the resulting 32-dimensional matrix.
We look for an eigenvector of a maximal eigenvalue
with components of the same sign in order to get a
stable solution, which we can compare with the pre-
sent fractions of antidiabetic drugs. These drugs will
be considered in relation to patients’ diagnoses, age,
multimorbidity and polypharmacy.
3 RESULTS
36.8 % of the diabetes patients with drug therapy are
treated with metformin having average drug costs of
18.73 Euro per quarter (2nd quarter of 2018). 41.6
% of the patients are treated with cost rising up to
50.00 Euros using glibenclamide (A10BB01), metfor-
min (A10BA02), glimepiride (A10BB12), gliquidone
HEALTHINF 2020 - 13th International Conference on Health Informatics
346

(A10BB08) and gliclazide (A10BB09) in ascending
order to their costs. All these are in the drug group
of sulfonylureas. The next interval from 50 to 100
Euro of pharmakological costs includes only 0.3 %
of the patients. In the range of 100 to 150 (150 to
200, above 200) Euros of drug costs, there are 29.5 %
(15.1 %, 13.5 %) of the patients. Mean drug costs per
quarter above 200 Euros are needed for empagliflozin
(A10BK03), insulin aspart fast-acting (A10AB05),
insulin lispro intermediate- or long-acting combi-
ned with fast-acting (A10AD04), insulin lispro fast-
acting (A10AB04), dulaglutide (A10BJ05), exenatide
(A10BJ01) and liraglutide (A10BJ02) again in ascen-
ding order to their cost per quarter. The inequality of
costs is described with a Lorentz curve (cf. figure 1
right) having a Gini coefficient of 0.428. If different
drug groups have been prescribed for the same pati-
ent she or he is assigned to the drug group with the
highest costs.
0.2 0.4 0.6 0.8 1.0
frac.patients
0.2
0.4
0.6
0.8
1.0
frac.costs
Figure 1: Lorentz curve for fractions of costs and patients
for antidiabetic drug treatment.
The drugs differ in mean age and mean polyphar-
macy degree (number of different ATC codes at four
digit level) for the related patient group. We consi-
der the convex hull in the age-polypharmacy-plane
for drugs which are prescribed at least 1,000 times
per quarter. The convex hull (cf. Figure 2) is span-
ned by insulin aspart fast-acting (A10AB05), met-
formin and dapagliflozin (A10BD15), glibenclamide
(A10BB01), insulin (human) intermediate- or long-
acting combined with fast-acting (A10AD01) and du-
laglutide (A10BJ05). The most frequently prescribed
metformin (A10BA02) has a middle age und a lower
polypharmacy position in the convex hull, cf. Figure
2.
The correlation between degree of multimorbidity
(number of different ICD codes at three digit level)
and polypharmacy (number of different ATC codes at
four digit level (3rd level of ATC)) is 0.52. Multmor-
bidity and polypharmacie are related, but do not fol-
low a linear relationship. Not every disease had to be
treated by drugs and interaction of drugs may result
A10AB01
A10AB04
A10AB05
A10AB06
A10AC01
A10AD01
A10AE04
A10AE05
A10BA02
A10BB01
A10BB12
A10BD07
A10BD15
A10BH01
A10BJ02
A10BJ05
A10BK01
A10BK03
A10AB01
A10AB04
A10AB05
A10AB06
A10AC01
A10AD01
A10AE04
A10AE05
A10BA02
A10BB01
A10BB12
A10BD07
A10BD15
A10BH01
A10BJ02
A10BJ05
A10BK01
A10BK03
55 60 65 70 75
age
5.5
6.0
6.5
7.0
7.5
8.0
polypharmacy
Figure 2: Diabetic ATC codes in dependence of mean age
and mean polypharmacy.
in complications, therefore the physicians try to redu-
ce the number of drugs as much as possible. We look
at the number of diabetes patents with i drugs and j
diseases at the mentioned level in Figure 6.
A10AB01
A10AB04
A10AB06
A10AC01
A10AE04
A10AE05
A10BA02
A10BB01
A10BB12
A10BD07
A10BH01
A10BJ02
A10BJ05
A10BK01
A10BK03
A10AB01
A10AB04
A10AB05
A10AB06
A10AC01
A10AD01
A10AE04
A10AE05
A10BA02
A10BB01
A10BB12
A10BD07
A10BD15
A10BH01
A10BJ02
A10BJ05
A10BK01
A10BK03
5.5 6.0 6.5 7.0 7.5 8.0
Polypharmazie
12
14
16
18
Multimorbidität
Figure 3: Diabetic ATC codes in dependence of mean mul-
timorbidity and mean polypharmacy.
In Figure 3 we consider the substances at the 5th
level of ATC prescribed at least 1,000 times per quar-
ter in the multimorbidity-polypharmacy plane again
with its convex hull. With the aggregation on the
substance level, we obtain a correlation coefficient
of 0.85 which is much higher than on the indivi-
dual level. Extreme low positions of multimorbidity
and polypharmacy show the combination treatment
by metformin and dapagliflozin (A10BD15) and in-
sulin aspart fast-acting (A10AB05). The highest posi-
tion in polypharmacy and multimorbidity has insulin
human intermediate- or long-acting combined with
fast-acting (A10AD01). Sometimes, in one quarter a
patient is prescribed different antidiabetic drugs. In
this case, we chose the drug at the 5th level of ATC
with the highest cost per quarter as main drug label.
Interrelations between Drug Prescriptions and Diagnoses for SHI Diabetes Patients using Graph Theoretic Methods and a Markov Model
347

We compare the drug cost per day with respect to the
main antidiabetic drug, with respect to all other anti-
diabetic drugs and with respect to all other drugs. The
total drug cost is an economic measure of illness and
can be compared with polypharmacy and multimor-
bidity. The characteristic values are shown in Table 1.
In Figure 4 the convex hull in the plane spanned by
costs per day for antidiabetic drugs on one axis and
costs of other drug on the other.
Table 1: Daily patient costs for main antidiabetic drug, other
antidiabetic drugs and other drugs in Euro.
ATC cost.
main
anti.
diab.
other
anti.
diab.
cost
other
drugs
number
pati-
ents
drug
A10AB01 1.68 0.60 6.30 6,449 insulin (human) fast-
acting
A10AB04 3.01 0.68 6.05 4,718 insulin lispro fast-acting
A10AB05 2.70 0.85 4.98 5,620 sulin aspart fast-acting
A10AB06 2.64 1.20 5.07 1,123 insulin glulisin fast-acting
A10AC01 1.15 2.23 2.81 2,019 insulin (human)
intermediate-acting
A10AD01 1.49 0.19 5.76 4,268 insulin (human)
intermediate- or long-
acting
A10AE04 2.00 0.79 5.08 12,973 insulin glargin long-
acting
A10AE05 2.08 1.05 5.26 3,225 insulin detemir long-
acting
A10BA02 0.20 0.11 2.74 42,149 metformin
A10BB12 0.31 0.34 2.44 3,021 glimepiride
A10BD07 1.49 0.38 2.78 8,795 metformin and sitagliptin
A10BH01 1.42 0.33 4.24 11,394 sitagliptin
A10BJ02 5.79 0.39 5.27 1,276 liraglutid
A10BJ05 3.62 0.57 5.11 1,057 dulaglutide
A10BK01 1.41 1.53 1.63 1,350 dapagliflozin
A10BK03 2.25 0.67 3.88 3,655 empagliflozin
A10AB01
A10AB04
A10AB05
A10AB06
A10AC01
A10AD01
A10AE04
A10AE05
A10BA02
A10BB12
A10BD07
A10BH01
A10BJ02
A10BJ05
A10BK01
A10BK03
A10AB01
A10AB04
A10AB05
A10AB06
A10AC01
A10AD01
A10AE04
A10AE05
A10BA02
A10BB12
A10BD07
A10BH01
A10BJ02
A10BJ05
A10BK01
A10BK03
1 2 3 4 5 6
antidibetics
1
2
3
4
5
6
other drugs
Figure 4: Diabetic ATC codes: dependence of costs per day
for antidiabetic drugs and other drugs.
The related graph structure of Figure 5 illustra-
tes which other antidiabetic drugs are most frequently
prescribed if another antidibetic drug for the same pa-
tient in the same quarter is already administrated to
the patient. The graph has two components.
A10AB01
A10AC01
A10AB04
A10AB05
A10AB06
A10AE04
A10AD01
A10AD04
A10BA02
A10AE05
A10BB01
A10BB12
A10BD07
A10BH01
A10BH03
A10BJ02
A10BJ05
A10BK01
A10BK03
Figure 5: Pairs of different antidiabetic drugs prespribed for
the same patient in the same quarter (top position).
One can aggregate the drug costs of a patient on
the 3rd level of ATC. The top position in this procedu-
re is called (basic) Morbidity Related Group (MRG),
cf. (Schuster et al., 2016), (Schuster et al., 2018). With
respect to drug efficieny review of physicians, this
is usually done with respect to fix pairings of phy-
sicians and patients. In our context, it is worthwile to
use the patient centered consideration without a refe-
rence to a physician. If we analyse, in which MRG
groups the considered antidibetics will be assigned,
the top position is always occupied by the antidiabe-
tic MRG groups A10A (insulines and analogues) and
A10B (blood glucose lowering drugs, excl. insulines).
The next two positions are assigned to comorbidities
related to drug groups. In descending order we get
B01A (antitrombotic agents), V04C (other diagnostic
agents, here tests for diabetes), C09D (angiotensin II
receptor blocjers, combinations), R03A (adrenergics,
inhalants), N02A (opioids), C10B (lipid modifying
agents, combinations), L04A (immunosuppressants),
C01E (other cardic preparations), J05A (direct ac-
ting antivirals), L01X (other antineoplastic agents),
R03B (other drugs for obstructive airway diseases,
inhalants) and S01E (antiglaucoma preparations and
miotics).
For each age i we consider the vector v(i) of frac-
tion v(i)
k
of diabetes patient with diagnose k, the di-
mension of the vector is determined by the number of
ICD codes at three digit level. Figure 7 describes the
Manhattan diagnostic distance of diabetes patients of
HEALTHINF 2020 - 13th International Conference on Health Informatics
348
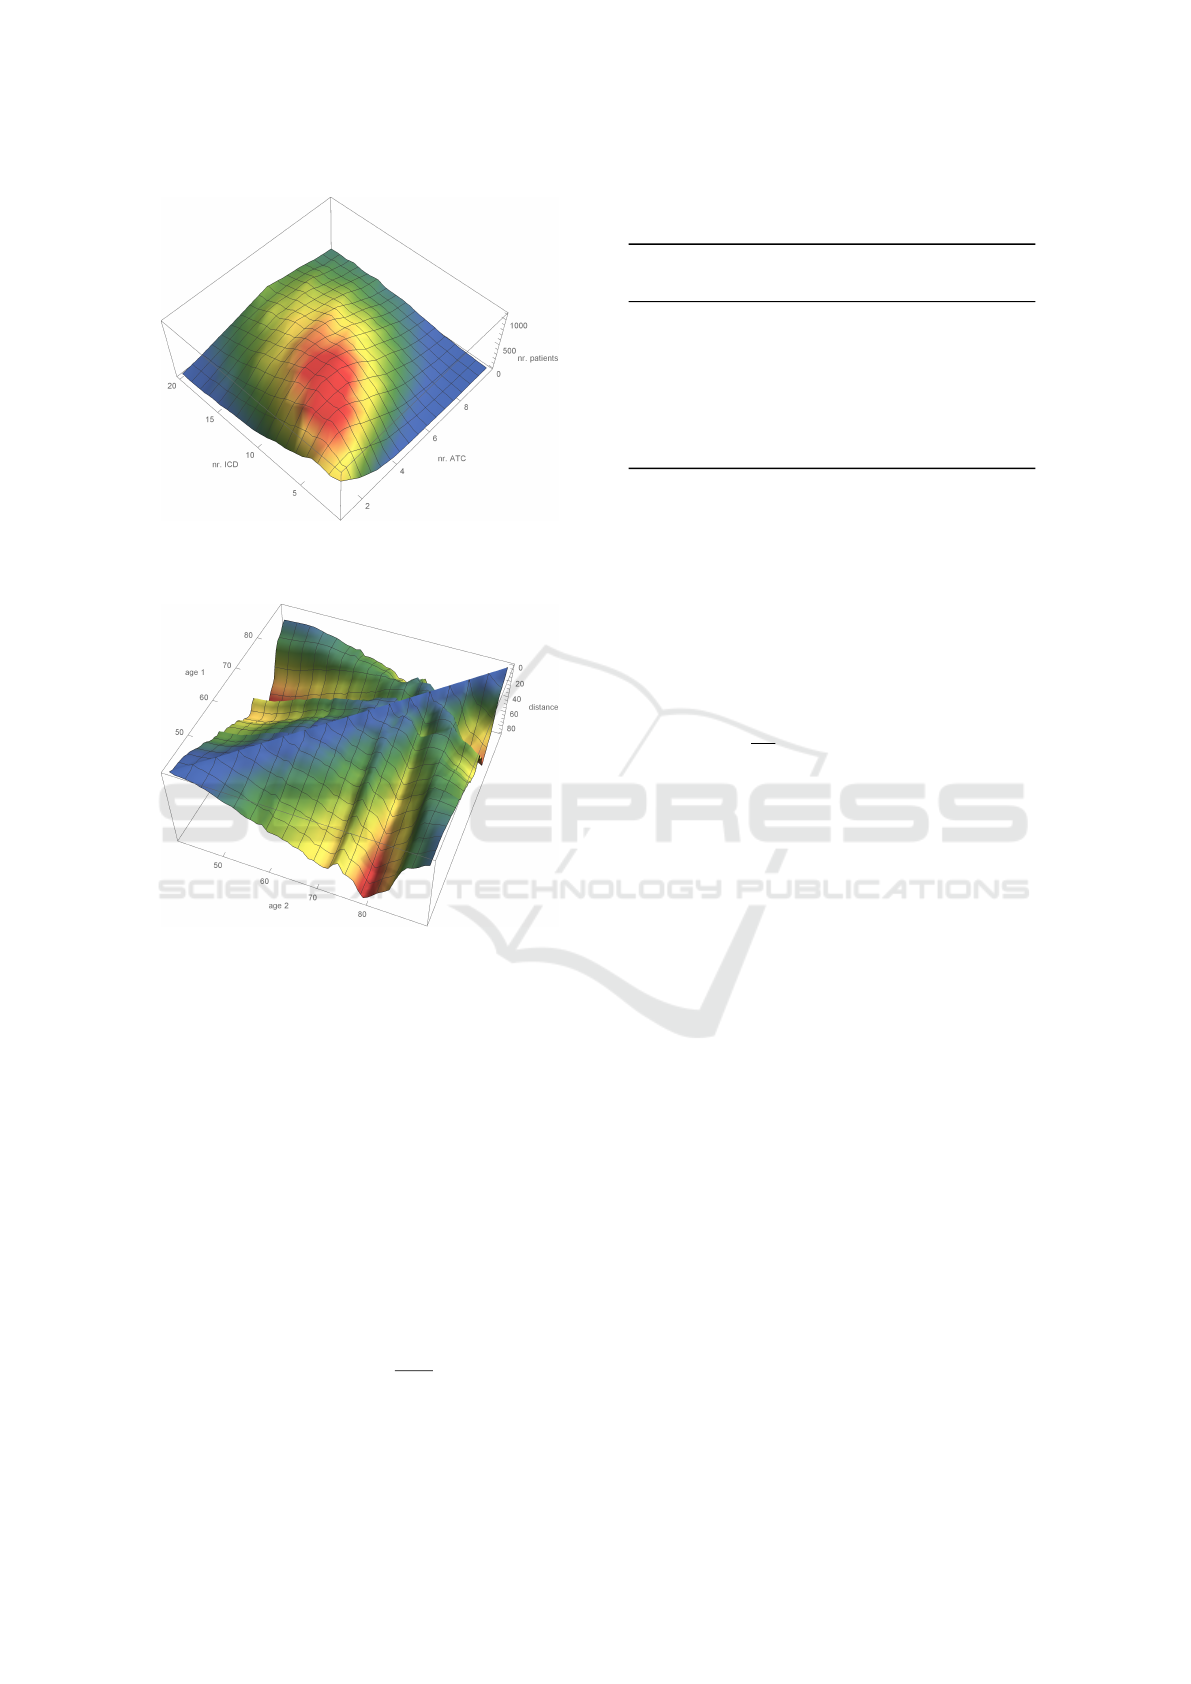
Figure 6: Number of patients with combinations of drugs
and diseases.
Figure 7: Age determined diagnostic Manhattan distance.
age 40 ≤ i, j ≤ 90.
We look for diagnoses, which appear more fre-
quently for diabetes patients than for all patients. The
same question can be adressed to consider subgroups
with respect to the patients age or sex. One can arran-
ge the results in a proper order with respect to relative
or absolute increase or a combination of both (cf. Ta-
ble 2).
We consider the graph with diabetes drugs as no-
des which are related to other top one and top three
drugs with the most similar diagnostic spectra of the
related patient group and graph communities by the
modular method (cf. figure 3).
The modularity matrix of a undirected graph G =
(V, E) with vertices V and edges E has the entries
m
u,v
= a
u,v
−
d
u
d
v
2m
with the adjacency matrix a
u,v
of G, the degree d
u
of
vertex u and m as the total number of edges. We look
Table 2: Increased possibilities of diagnoses for diabetes pa-
tients.
no. ICD frac.
diab.
pat.
frac.
all
pat.
diff.
rel.
diff.
abs.
diagnoses
1 G63 22.8 % 2.2 % 1019.2 % 20.6 % Polyneuropathy in diseases
classified elsewhere
2 E66 33.4 % 10.7 % 312.5 % 22.7 % Obesity
3 E79 13.0 % 4.4 % 296.6 % 8.6 % Disorders of purine and py-
rimidine metabolism
4 I25 24.6 % 8.6 % 285.9 % 16.0 % Chronic ischaemic heart disea-
se
5 E78 43.2 % 18.8 % 229.4 % 24.3 % Disorders of lipoprotein meta-
bolism and other lipidaemias
for a partition of V into k clusters. For each pair (u, v)
of vertices we consider a variable x
u,v
with value 0 if
u and v are in the same cluster and value 1 otherwi-
se. One can easily prove that the consistency of the
clustering is guaranteed by the triangle inequality
x
u,w
≤ x
u,v
+ x
v,w
for each triple (u, v, w) of vertices. The modularitiy
methods maximizes
1
2m
∑
u,v
m
u,v
(1 − x
u,v
)
under the mentioned constraint of triangle inequality
and x
u,v
∈ {0, 1} as an integer linear problem (ILP).
Solving ILP is NP-hard and thus it is unlikely to sol-
ve it in polynomial time. We use the modularity im-
plementation in Mathematica by Wolfram research
and alternatively the commercial package CPLEX by
IBM, cf. (Shinano et al., 2003)). Integer linear pro-
grams (ILP) allows us to formulate an optimization
problem with a linear objective function and cons-
traints given by a series of linear inequalities. Then,
an integer value assignment of the variables is deter-
mined that fulfills all the constrains. Although solving
ILP problems is computationally hard (NP-hard to be
more specific), there are powerful solvers available
that perform well regarding our precise problem for-
mulations, cf.(Shinano et al., 2003).
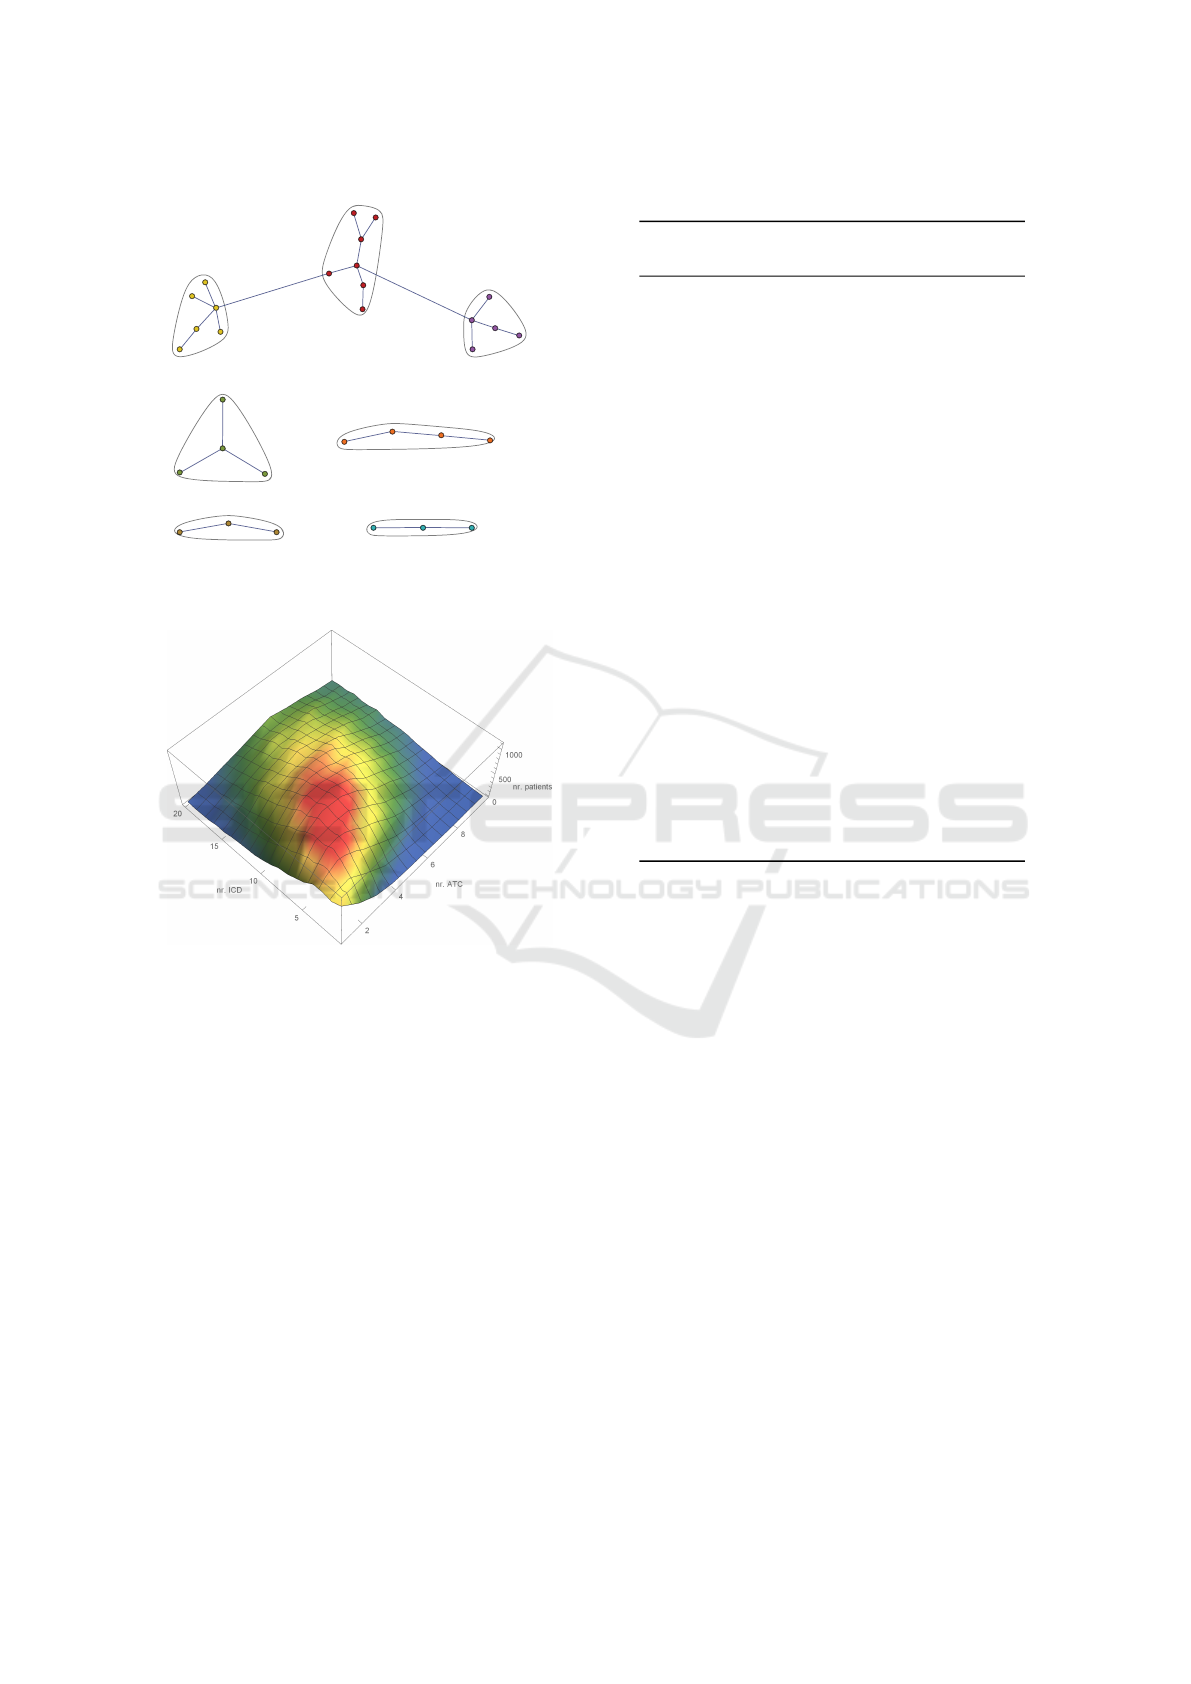
At the top one level, there are five connected
components, one of them splits into three commu-
nities. At the top 3 level the graph is connected
and has five graph communities. It has a graph dia-
meter of 6. The graph center consists of metfor-
min (A10BA02), the most frequently used drug and
glimepiride (A10BB12) another low cost drug. The
graph periphery consist of six drugs (insulin human
intermediate-acting, insulin lispro fast-acting, insulin
detemir long-acting, insulin aspart fast-acting, insulin
glulisine fast-acting, insulin aspart intermediate- or
long-acting combined with fast-acting) out of the drug
group A10A (insulins and analogues) and two drugs
Interrelations between Drug Prescriptions and Diagnoses for SHI Diabetes Patients using Graph Theoretic Methods and a Markov Model
349
A10AB01
A10AC01
A10AB04
A10AE05 A10AB05
A10AB06
A10AE04
A10AD01
A10AD04
A10AD05
A10BA02
0
0
A0
A
0
A10BD07
A10BB01
A10BB12
A10BB08
A10BB09
A10BX03
A10BD05
A10BD10
A10BD15
A10BK01
A10BD24
A10BF01
A10BF02
A10BG03
A10BH01
A10BH03
A10BJ01
A10BJ05
A10BJ02
A10BK03
A10BX02
Figure 8: Diabetes drug neighborhood graph with commu-
nities given by the modular method at top 1 level.
Figure 9: Diabetes drug neighborhood graph with commu-
nities given by the modular method at top 3 level.
from the group A10B (blood glucose lowering drugs,
excl. insulins). Table 3 compares mean age, polyphar-
macy, mulimorbidity, pharmacotherapeutic costs and
the number of prescriptions of the drug groups and
their cluster components.
Patients of cluster 1 have the smallest mean value
of multomorbidity, followed by cluster 3. In cluster 2
the fraction of patients with ICD code G63 (Polyneu-
ropathy in diseases classified elsewhere) is increased
by 31%. In cluster 4 there are increased fractions of
patients with E78 ICD code (disorders of lipoprote-
in metabolism and other lipidaemias, 11%) and E66
(obesity, 30%). Cluster 5 has an increased value in
F32 code (depressive episode, 31%).
A Markov model with transition coefficients from
quarter 1 of 2018 to quarter 2 of 2018 with respect
to drug changes of patients leads to an eigenvalue 1
and the related eigenvalue has components of the sa-
Table 3: Interaction parameters for antidiabetic drugs.
ATC clu-
ster
age poly-
phar.
mul-
ti-
morb.
nr.
pre-
scr.
cost
Eu-
ro
drug
A10AB01 2 68.6 7.4 16.4 10,020 135.45 insulin (human) fast-
acting
A10AB04 2 56.2 6.0 12.2 6,628 241.78 insulin lispro fast-
acting
A10AB05 2 53.0 5.6 11.2 8,681 211.64 sulin aspart fast-
acting
A10AB06 2 62.0 6.6 14.1 2,017 196.90 insulin glulisin fast-
acting
A10AC01 2 67.0 6.8 14.9 6,178 101.90 insulin (human)
intermediate-acting
A10AD01 5 76.8 8.2 18.4 4,987 132.43 insulin (human)
intermediate- or
long-acting combi-
ned with fast-acting
A10AE04 2 64.3 6.9 14.7 19,134 173.93 insulin glargin long-
acting
A10AE05 2 60.2 6.3 13.5 5,140 180.39 insulin detemir long-
acting
A10BA02 3 67.1 5.6 13.6 64,886 18.73 metformin
A10BB01 1 72.5 5.4 13.1 1,877 17.53 glibenclamide
A10BB12 3 70.2 5.5 14.1 6,397 28.31 glimepiride
A10BD07 1 65.6 5.4 13.0 11,131 136.04 metformin and sitag-
liptin
A10BD15 1 60.4 5.2 12.1 1,159 132.30 metformin and da-
pagliflozin
A10BH01 3 69.9 6.6 16.0 14,426 126.80 sitagliptin
A10BJ02 4 58.4 6.3 15.4 1,403 516.78 liraglutid
A10BJ05 4 58.2 6.4 15.8 1,272 320.82 dulaglutide
A10BK01 4 61.6 5.5 13.3 2,979 122.76 dapagliflozin
A10BK03 4 62.3 6.1 14.5 4,885 201.45 empagliflozin
me sign which thereby can be adjusted to the total
number of diabetes patients. The sum of absolute dif-
ferences of the model result and the observed data is
4.15 % of the total size. The observed data are almost
at equilibrium. The differences in edge distributions
of the diabetes patients are caused mainly by popu-
lation changes in elderly people (decline in the birth
rate nearby the end of World War II in 1945).
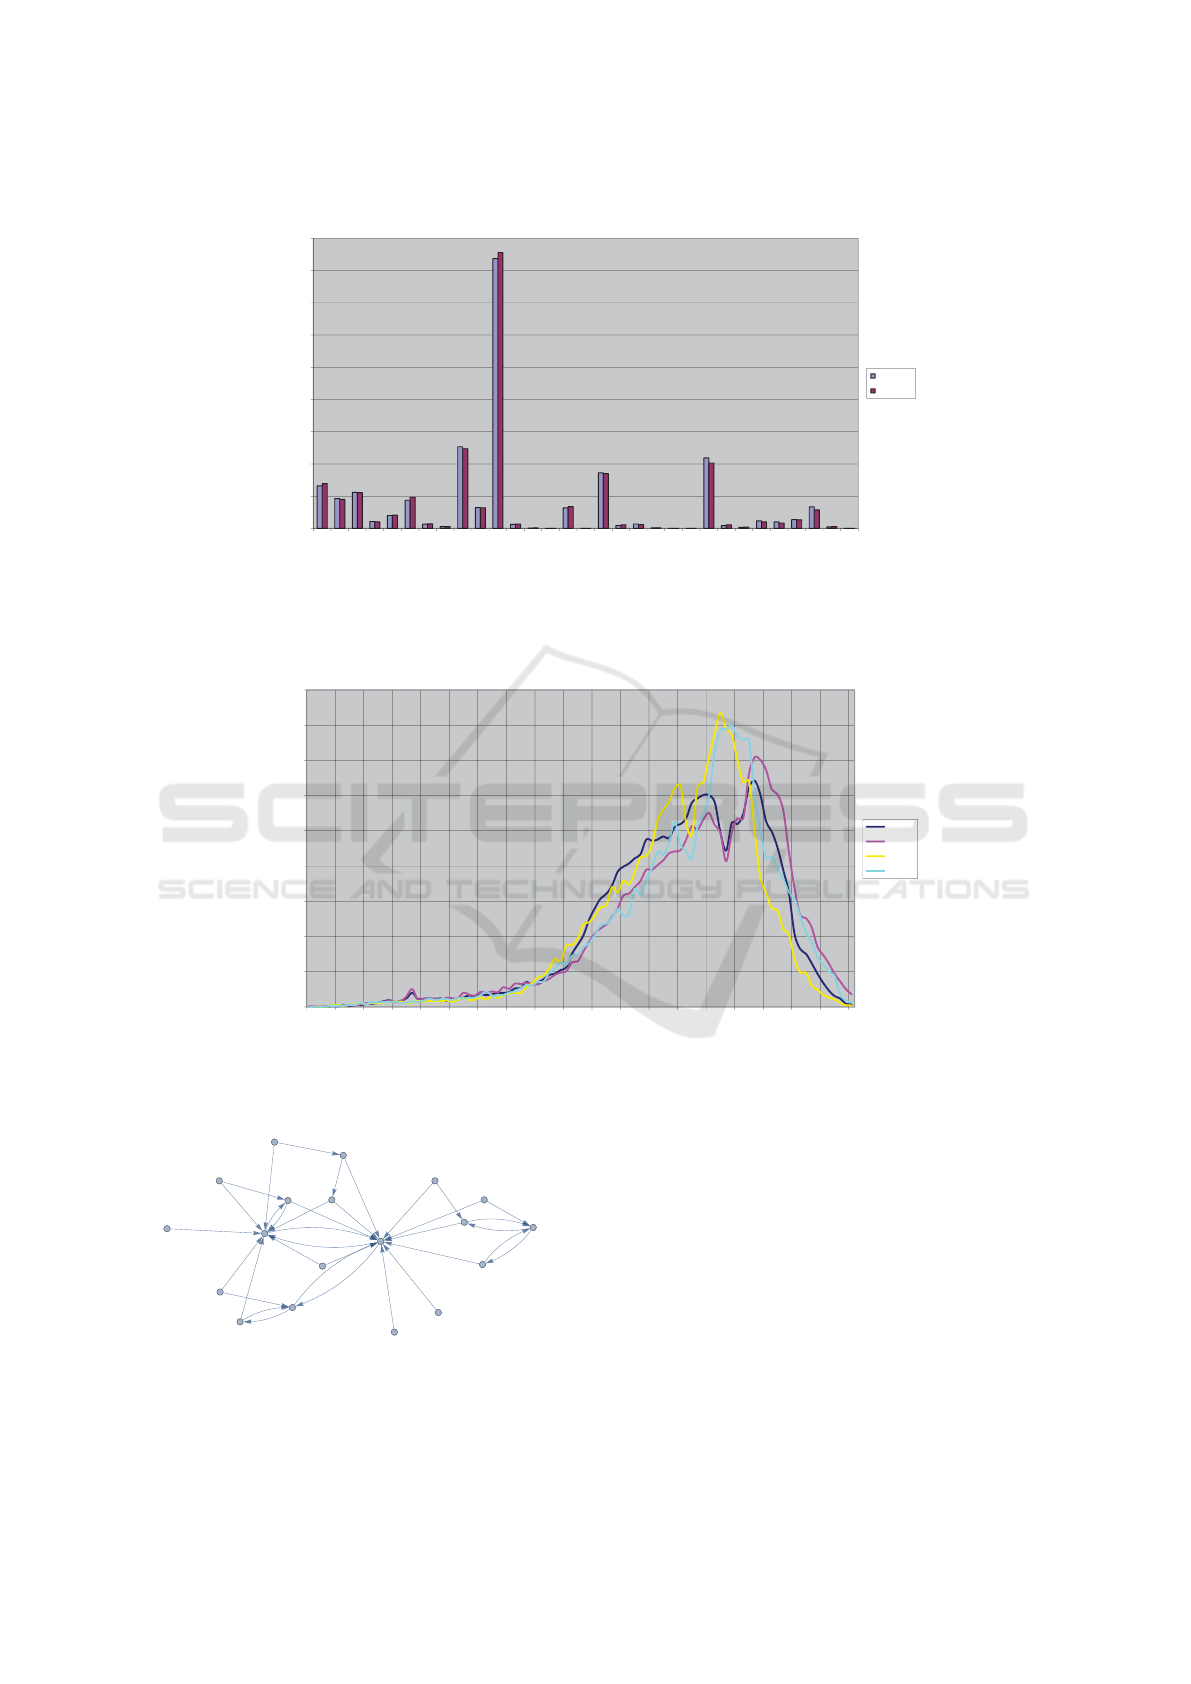
Even though transitions are nearly stable, there
are much less transitions from one substance to ano-
ther substance without loops with at least 30 patients
within the top two transitions (cf. Figure 12). The
top target substances are A10BA02 (metformin) and
A10AE04 (insulin glargin long-acting).
The related undirected graph has four graph com-
munities using the modularity method (cf. Figure 13).
The graph periphery only consists of A10AE04
(insulin glargin long-acting), the graph periphery con-
tains A10BK01 (dapagliflozin), A10BB12 (glimepi-
ride), A10BB01 (glibenclamide), A10AE05 (insu-
lin detemir long-acting), A10AD01 (insulin (human)
intermediate- or long-acting combined with fast-
acting) and A10AC01 (insulin (human) intermediate-
acting).
HEALTHINF 2020 - 13th International Conference on Health Informatics
350
0
5.000
10.000
15.000
20.000
25.000
30.000
35.000
40.000
45.000
A10AB01
A10AB04
A10AB05
A10AB06
A10AC01
A10AD01
A10AD04
A10AD05
A10AE04
A10AE05
A10BA02
A10BB01
A10BB08
A10BB09
A10BB12
A10BD05
A10BD07
A10BD10
A10BD15
A10BF01
A10BF02
A10BG03
A10BH01
A10BH03
A10BJ01
A10BJ02
A10BJ05
A10BK01
A10BK03
A10BX02
A10BX03
no of patients
drug
markov result
observed
model
Figure 10: Markov stable solution compared with the observed data.
0,0%
0,5%
1,0%
1,5%
2,0%
2,5%
3,0%
3,5%
4,0%
4,5%
0 5 10 15 20 25 30 35 40 45 50 55 60 65 70 75 80 85 90 95
fraction
adge
adge distribution of diabetes patient in dependence of sex (m,f ) for 2013 and 2018
m 2018
f 2018
m 2013
f 2013
Figure 11: Edge distribution with respect to sex for 2013 and 2018.
A10BK03
A10BA02
A10AE04
A10BK01
A10BD07
A10BJ05
A10AB04
A10BJ02
A10BH03
A10BH01
A10BD15
A10BB12
A10BB01
A10AE05
A10AB05
A10AB01
A10AD01
A10AC01
A10AB06
Figure 12: Changes of substances from quarter one to quar-
ter two in 2018.
4 CONCLUSIONS
Community structures of graphs offer new insights in
therapeutic backgrounds of prescribed drugs. This of-
fers the opportunity to improve health care decisions
at the negotiation level, to improve medical decisi-
ons from a patient centered point of view and to ad-
apt national and international guidelines from a uni-
fied point of view. Patients’ age, sex, multimorbidi-
ty and further parameters can be used to get neigh-
borhood information as a informational base to opti-
mize personal and health political decisions within a
global context. Network analysis with graph theoretic
methods against the background of big data combi-
Interrelations between Drug Prescriptions and Diagnoses for SHI Diabetes Patients using Graph Theoretic Methods and a Markov Model
351

A10BK03
A10BA02
A10AE04
A10BK01
A10BD07
A10BJ05
A10AB04
A10BJ02
A10BH03
A10BH01
A10BD15
A10BB12
A10BB01
A10AE05
A10AB05
A10AB01
A10AD01
A10AC01
A10AB06
Figure 13: Graph communities for changes of substances
from quarter one to quarter two in 2018.
ned with therapeutic innovations are a powerful tool
for theoretical analyzes as well as for practical acti-
ons. The analysis was done as a patient centered point
of view with the background of the entire informa-
tion with respect to drugs and diseases of all physi-
cians that treated an individual patient in the conside-
red quarter. But the information background of a spe-
cial physician may be informationally rather scare in
comparison. There are principal limitations with re-
spect to data protection. Missing information about
other drugs and other diseases may restrain or pre-
vent the treatment success with substantial risks for
the patient and resulting follow-up costs for complica-
tion treatment further burdening financially the health
system. Further research is necessary especially for
identification of critical situations. The possibilities of
sharing information with modern digital communica-
tion structures are currently underused. Most guide-
lines are geared towards special diseases and drugs.
Multimorbidity and polypharmacie require priorities
and compromises between benefits and side effects.
Further research is necessary to use the analyzed dif-
ferent degrees of multimorbidity and polypharmacy
for individual informed decision making. The analy-
sis shows that large differences in drug costs can lar-
gely be explained by different diseases and multimod-
bidity. It should be analyzed in which situations large
differences of therapeutic decisions made by an indi-
vidual physician that differ from other physicians at
a statistically assured level are related to drug econo-
mic problems or if they are related to more innovative
treatment at the currently secured scientific level.
REFERENCES
Agarwal, G. and Kempe, D. (2008). Modularity-
Maximizing Graph Communities via Mathematical
Programming. The European Phisical Journal B,
66:409–418.
American Diabetes Association (1998). Economic conse-
quences of diabetes mellitus in the us in 1997. Diabe-
tes Care, 21:296–309.
International Diabetes Federation (2017). IDF Diabetes At-
las, 8th edn. Brussels, Belgium: International Diabe-
tes Federation 2017.
Klein, B. E. (2007). Overview of epidemiologic studies
of diabetic retinopathy. Ophthalmic Epidemiology,
14:179–183.
Newman, M. (2006). Finding community structure in net-
works using the eigenvectors of matrices. Physical
Review E, 74.
Schuster, R. and Emcke, T. (2018). Graph-theoretic network
analysis of interactions between patients, physicians
and prescribed drugs. submitted to Archives of Data
Science, Series A.
Schuster, R., Emcke, T., Arnstedt, E., and Heidbreder, M.
(2016). Morbidity Related Groups (MRG) for epide-
miological analysis in outpatient treatment. IOS Press,
pages 783–787.
Schuster, R., Ostermann, T., Heidbreder, M., and Emcke,
T. (2018). Relations of Morbidity Related Groups
(MRG), ICD-10 Codes and Age and Gender Structure
in Outpatient Treatment. In Proceedings of the 11th
International Joint Conference on Biomedical Engi-
neering Systems and Technologies - Volume 5: HEAL-
THINF, pages 322–328.
Shi, Y. and Hu, F. (2014). The global implications of diabe-
tes and cancer. Lancet, 383(9933):1947–8.
Shinano, Y., Fujie, T., and Kounoike, Y. (2003). Effectiven-
ess of Parallelizing the ILOG-CPLEX Mixed Integer
Optimizer in the PUBB2 Framework. In Euro-Par
2003 Parallel Processing, pages 451–460. Springer
Berlin Heidelberg.
Songer, T., L, E., and of Diabetes Project Panel, E. (1998).
Studies on the Costs of Diabetes. Atlanta, Ga: Centers
for Disease Control and Prevention.
World Health Organization (2016). Report on Diabetes
(PDF). WHO.
HEALTHINF 2020 - 13th International Conference on Health Informatics
352
