
Deep Learning from Heterogeneous Sequences of Sparse Medical Data
for Early Prediction of Sepsis
Mahbub Ul Alam
1
, Aron Henriksson
1
, John Karlsson Valik
2,3
, Logan Ward
4
, Pontus Naucler
2,3
and Hercules Dalianis
1
1
Department of Computer and Systems Sciences, Stockholm University, Stockholm, Sweden
2
Division of Infectious Disease, Department of Medicine, Karolinska Institute, Stockholm, Sweden
3
Department of Infectious Diseases, Karolinska University Hospital, Stockholm, Sweden
4
Treat Systems ApS, Aalborg, Denmark
Keywords:
Sepsis, Early Prediction, Machine Learning, Deep Learning, Health Informatics, Healthcare Analytics.
Abstract:
Sepsis is a life-threatening complication to infections, and early treatment is key for survival. Symptoms of
sepsis are difficult to recognize, but prediction models using data from electronic health records (EHRs) can
facilitate early detection and intervention. Recently, deep learning architectures have been proposed for the
early prediction of sepsis. However, most efforts rely on high-resolution data from intensive care units (ICUs).
Prediction of sepsis in the non-ICU setting, where hospitalization periods vary greatly in length and data is
more sparse, is not as well studied. It is also not clear how to learn effectively from longitudinal EHR data,
which can be represented as a sequence of time windows. In this article, we evaluate the use of an LSTM net-
work for early prediction of sepsis according to Sepsis-3 criteria in a general hospital population. An empirical
investigation using six different time window sizes is conducted. The best model uses a two-hour window and
assumes data is missing not at random, clearly outperforming scoring systems commonly used in healthcare
today. It is concluded that the size of the time window has a considerable impact on predictive performance
when learning from heterogeneous sequences of sparse medical data for early prediction of sepsis.
1 INTRODUCTION
Sepsis is a leading cause of hospital morbidity and
mortality (Singer et al., 2016). It is also one of
the most serious forms of healthcare associated in-
fections, many of which are considered avoidable
(Cassini et al., 2016). The survival of sepsis patients
is dependent on initiating appropriate antimicrobial
treatment as early as possible (Ferrer et al., 2014). To
facilitate this, prompt detection of sepsis patients is
crucial. It has been shown that early identification of
sepsis significantly improves patient outcomes. For
instance, mortality from septic shock has been found
to increase by 7.6% for every hour that antimicrobial
treatment is delayed after the onset of hypotension
(Kumar et al., 2006), while timely administration of
a 3-hour bundle of sepsis care and fast administration
of antibiotics was associated with lower in-hospital
mortality (Seymour et al., 2017). Unfortunately, di-
agnosing sepsis early and accurately is challenging
even for the most experienced clinicians, as there is
no standard diagnostic test (Singer et al., 2016) and
symptoms associated with sepsis may also be caused
by many other clinical conditions (Jones et al., 2010).
Clinical decision support tools have the potential
to facilitate early intervention in sepsis patients. For-
tunately, clinical data that could be used to inform
predictions about patients that are at risk of sepsis is
already being routinely collected in electronic health
records (EHRs). Today, warning scores based on such
data are calculated for early identification of clini-
cal deterioration at the bedside. Examples of early
warning scores include NEWS (Williams et al., 2012)
and qSOFA (Singer et al., 2016). These scoring tools
compare a small number of physiological variables to
normal ranges of values and generate a single com-
posite score: once a certain threshold is reached, the
system triggers an alert (Despins, 2017). However,
a serious limitation of early warning scores is that
they are typically broad in scope and were not specif-
ically developed for sepsis, which means that many
other diseases may also yield high scores. This can
cause breakdowns in the training and education pro-
cess and result in low specificity and high alarm fa-
Alam, M., Henriksson, A., Valik, J., Ward, L., Naucler, P. and Dalianis, H.
Deep Learning from Heterogeneous Sequences of Sparse Medical Data for Early Prediction of Sepsis.
DOI: 10.5220/0008911400450055
In Proceedings of the 13th International Joint Conference on Biomedical Engineering Systems and Technologies (BIOSTEC 2020) - Volume 5: HEALTHINF, pages 45-55
ISBN: 978-989-758-398-8; ISSN: 2184-4305
Copyright
c
2022 by SCITEPRESS – Science and Technology Publications, Lda. All rights reserved
45

tigue. Early warning scores, which are used in clin-
ical practice today, are also overly simplistic by as-
signing independent scores to each variable, ignoring
both the complex relationships between different vari-
ables and their evolution in time (Vincent et al., 1998;
Smith et al., 2013).
Machine learning provides the possibility of over-
coming the limitations of heuristics-based warning
scores by accounting for dependencies between a
large number of (temporal) input variables from
EHRs to predict an outcome of interest, such as sep-
sis. Using machine learning for early prediction of
sepsis has been greatly facilitated by the possibil-
ity of exploiting agreed upon definitions of clinical
sepsis criteria for identifying cases (Delahanty et al.,
2019). This allows for the large-scale creation of la-
beled datasets needed for supervised machine learn-
ing. Therefore, the primary focus of machine learning
approaches should be on early detection, i.e. to detect
sepsis as early as possible prior to sepsis onset.
In this article, the Sepsis-3 definition (Singer et al.,
2016) is used for labeling three years of EHR data
from a general university hospital population. In con-
trast, most previous efforts have focused on using data
from intensive care units (ICUs) (Mani et al., 2014;
Desautels et al., 2016; Taylor et al., 2016; Moor et al.,
2019). Data from ICUs tends to be less sparse and
hospitalization periods shorter. In this study, a re-
current neural network, in the form of a long short-
term memory (LSTM) network, is used to learn from
heterogeneous sequences of EHR data for early pre-
diction of sepsis in the non-ICU setting. In particu-
lar, different temporal representations that divide the
longitudinal EHR data into time windows of various
sizes are investigated. In previous work, a one-hour
time window was used without justification (Moor
et al., 2019; Futoma et al., 2017a,b), whereas we
wanted to investigate empirically the impact of us-
ing different window sizes. The window size has a
direct impact on the length of the sequences and the
amount of missing data: with a smaller window size,
the sequences become longer in terms of the number
of windows, and the missing rate higher; a larger win-
dow size will have the opposite effect, while also in-
creasing the likelihood of needing to summarize – or
represent in some other way – multiple values for a
given variable. We therefore investigate these inter-
connected factors: the window size vs. the length of
sequences, as well as basic approaches to handling
missingness. It is important to note that this paper
does not propose a novel deep learning architecture
for early prediction of sepsis, but rather investigates
some fundamental questions that are important to ad-
dress, the results of which are intended to inform the
design of new architectures. In summary, the main
contributions of this study are as follows:
• A deep learning LSTM model is used for early
prediction of sepsis in order to investigate differ-
ent representations of longitudinal EHR data. It is
shown that the size of the time window has a con-
siderable impact on predictive performance, mak-
ing it a particularly important design decision in
the face of sparse non-ICU data.
• Two basic approaches to missingness was inves-
tigated for handling sparse non-ICU data: assum-
ing data is missing at random and assuming data
is missing not at random. It is shown that the
latter assumption yields somewhat better perfor-
mance and indicates that missingness is some-
times a valuable indicator that should not always
be imputed.
• Predictive performance is evaluated for healthcare
episodes of various lengths, revealing consider-
ably higher performance for shorter vs. longer
sequences. The model is also evaluated in terms
of earliness, showing that more true positive pre-
dictions are made in the time windows closer to
sepsis onset.
2 METHODS AND MATERIALS
The EHR data used in this study comes from
the research infrastructure Health Bank (Dalianis
et al., 2015), that contains EHR data collected
from Karolinska University Hospital. This research
has been approved by the Regional Ethical Review
Board in Stockholm, Sweden under permission no.
2016/2309-32.
2.1 Data Selection
Patients older than 18 years admitted to the hospi-
tal between July 2010 and June 2013 were included,
and followed until first sepsis onset, discharge or
death. Patients were excluded if admitted to an ob-
stetric ward and censored during ICU care. The
dataset encompasses 124,054 patients and 198,638
care episodes from a general university hospital popu-
lation over a three-year period. The incidence of sep-
sis in the dataset is 8.9%, yielding a very uneven class
distribution.
An instance in the dataset represents a care
episode, which constitutes the period between general
admission and discharge (or death) for a particular pa-
tient. If a patient was admitted via the emergency unit,
this arrival time was considered as admission time for
HEALTHINF 2020 - 13th International Conference on Health Informatics
46

that particular episode. Additionally, if the time fol-
lowing discharge and next admission for the same pa-
tient is less than 24 hours, the two are considered to be
part of the same care episode. Care episodes may in-
volve stays in several different wards and vary greatly
in length, with a median length of around three days.
2.2 Feature Selection
Data for each care episode is collected solely from the
EHR and comprises data on microbiological cultures
and antimicrobial treatment, as well as demographic
and physiological data. The included variables were
selected by domain experts.
In the study, data defining collection of micro-
bial cultures and tests from all types of body flu-
ids is used. Data on newly administrated antimicro-
bial treatment is collected based on ATC (Anatomi-
cal Therapeutic Chemical) codes (Nahler, 2009) J01
and J04. Demographic and physiological data is col-
lected for the following 19 parameters: age, body
temperature, heart rate, respiratory rate, systolic and
diastolic blood pressure, oxygen saturation, supple-
mentary oxygen flow, mental status, leucocyte count,
neutrophil count, platelet count, C-reactive protein,
lactate, creatinine, albumin, and bilirubin. Most of
the variables are numeric, and generally extremely
sparse, with a missing rate of more than 90% in some
cases.
In addition to the aforementioned variables, early
warning scores are also used as aggregated features
in the predictive model. The output of the follow-
ing scoring tools were used: NEWS2 (Williams et al.,
2012), qSOFA (Singer et al., 2016) and SOFA (Vin-
cent et al., 1996). This is a common practice in ma-
chine learning (Raghu et al., 2017a,b). The model
was only allowed to access data that would be readily
available in the EHR – or could be computed from it
– at the time of prediction.
2.3 Care Episode Representation
To account for the temporality of the data, the care
episodes are transformed into sequences based on a
given window (bin) size. Experiments are conducted
using six different window sizes: 1, 2, 3, 4, 6 and 8
hours.
A variable in a time window can either be missing
or have multiple values associated with it. For exam-
ple, body temperature may not have been measured
in a given time window or may have been measured
multiple times. When multiple values are present in
a time window, the ”worst” value is chosen. This is
defined as the most pathological value for a particular
variable and is determined apriori by clinical experts.
For certain variables, the most pathological value can
be either high or low. For example, in the case of
body temperature, a value less than 36 is considered
the worst, but if no such value exists, the highest value
is chosen instead.
Missing data can be handled in various ways and
a fundamental decision concerns whether data for a
given variable is assumed to be missing at random or
not (Steele et al., 2018). In this study, both assump-
tions are taken into account. When data is assumed
to be missing not at random, imputation is not car-
ried out; instead, missing values are simply assigned
an integer value which is not present in the data, and
the idea is that the model may learn to treat missing-
ness as a distinct feature. When data is assumed to
be missing at random, the following simple imputa-
tion strategy was carried out. If a value exists for a
given feature in the care episode, it is carried forward
to subsequent windows until another observed value
is encountered, which is then in turn carried forward
and so on. When there is no value for a given feature
in a care episode, it is imputed globally: for categori-
cal features, the most frequent value is chosen, while
mean imputation is carried out for numeric features.
For SOFA, qSOFA, and NEWS2, missing values are
not mean-imputed; instead, the score is assumed to
be 0 – if missing – at the start of an episode and then
carried forward as described above.
Figure 1 shows the distribution of care episode
lengths with different time window sizes and the
episode-wise missing rate, i.e. the percentage of miss-
ing values in a care episode. Smaller time windows
yield longer sequences and a higher rate of miss-
ingness, while larger time windows yield shorter se-
quences but a somewhat smaller amount of missing
data. There is high variance with respect to both se-
quence length and missingness.
2.4 Sepsis Definition
The operational Sepsis-3 clinical criteria are used to
define sepsis (Singer et al., 2016; Seymour et al.,
2016). To fulfill the criteria, patients are required to
suffer from a suspected infection in combination with
organ dysfunction (Singer et al., 2016; Seymour et al.,
2016). Suspected infection is defined as having any
culture taken and at least two doses of antimicrobial
treatment newly administered within a certain time
period. If antimicrobial treatment was initiated first,
cultures had to be collected within 24 hours. If cul-
tures were collected first, antimicrobial treatment had
to be started within 72 hours after the cultures. Or-
gan dysfunction is measured by an increase in sequen-
Deep Learning from Heterogeneous Sequences of Sparse Medical Data for Early Prediction of Sepsis
47
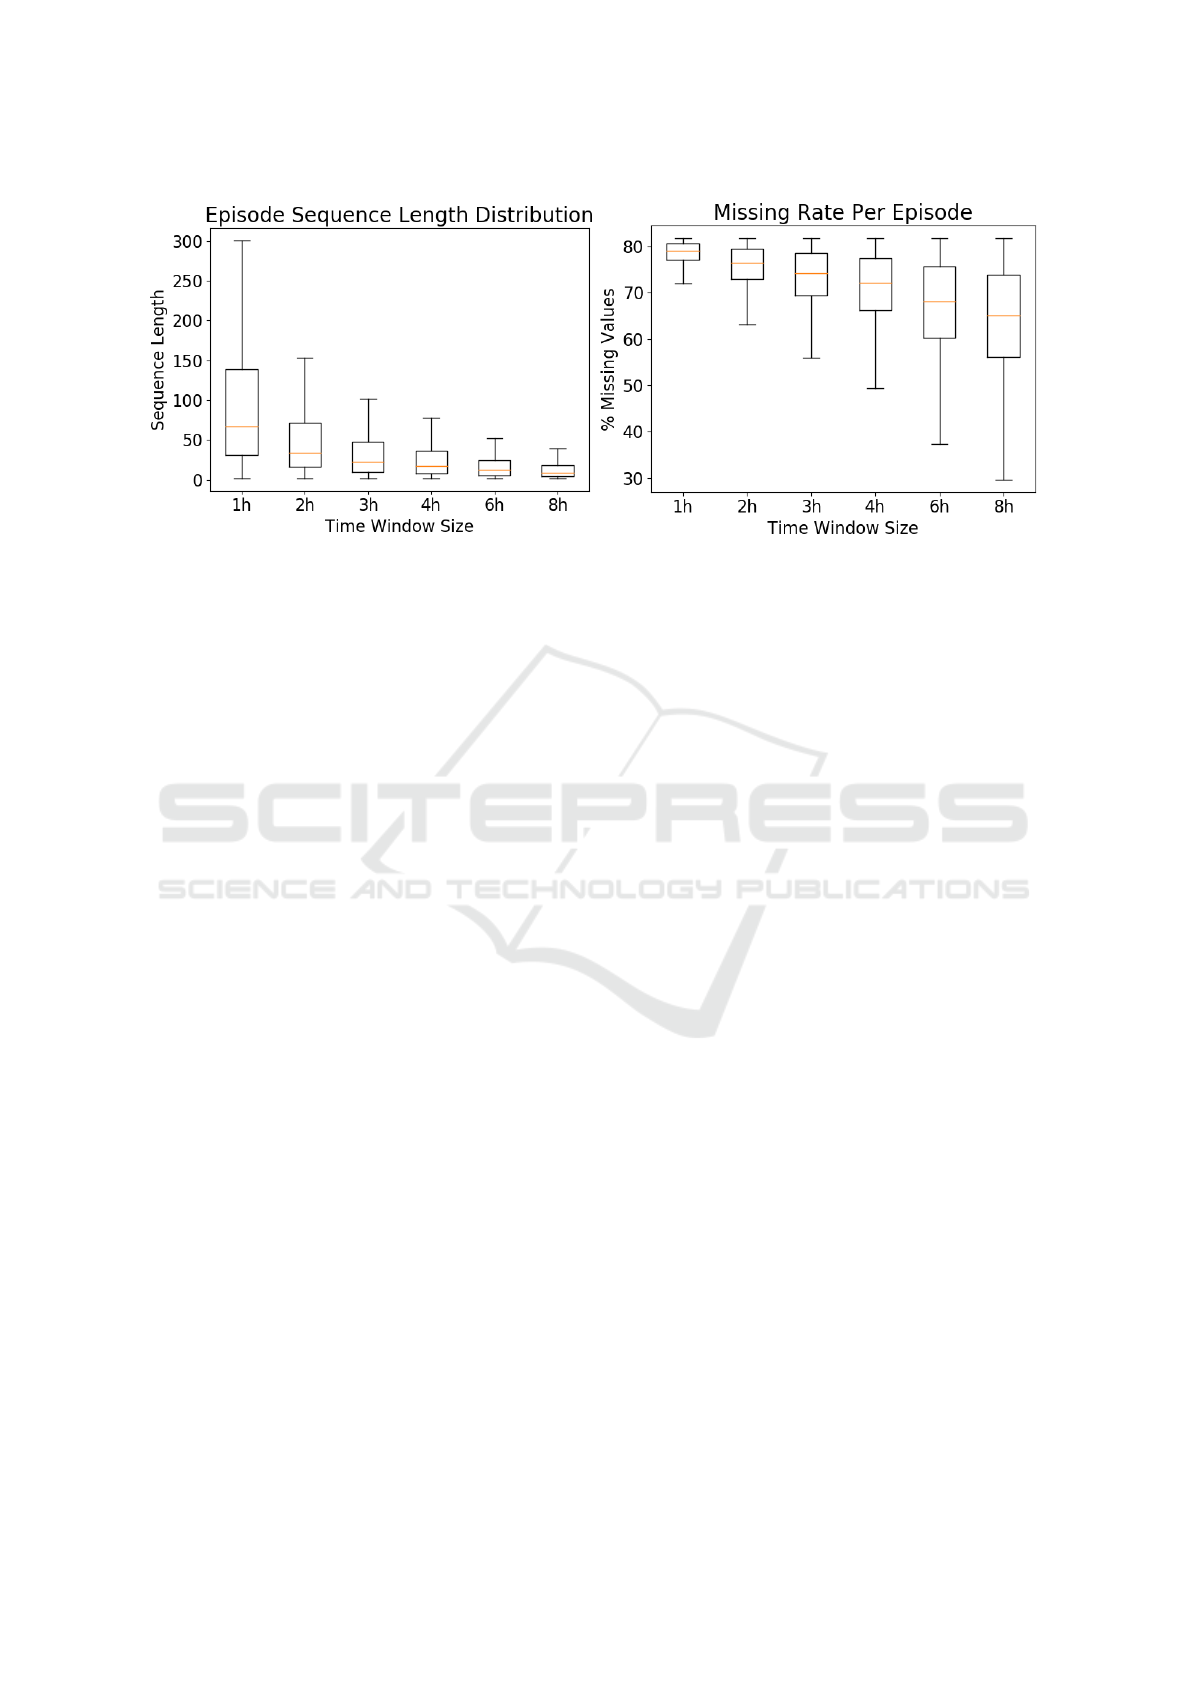
Figure 1: Distribution of sequence length (left) and episode-wise missing rate with different time window sizes (right).
tial organ failure assessment (SOFA) score by greater
than or equal to 2 points compared to the baseline.
Organ dysfunction is measured 48 hours before to 24
hours after the onset of suspected infection. The base-
line SOFA score is defined as the latest value mea-
sured before the 72-hour time window and is assumed
to be 0 in patients not known to have a pre-existing
organ dysfunction.
Sepsis onset time is regarded as the first time-
window when both organ dysfunction and suspected
infection criteria are met. As a time window is used
as a fixed length of time interval to represent the tem-
porality, the particular time window in which sepsis
onset occurs is regarded as time zero.
2.5 LSTM Model
A deep learning model learns from the input data
features, by using hierarchical representations of in-
put features, from lower level compositions to higher
level compositions. This type of abstraction at multi-
ple levels allows learning features automatically using
the complex formation of functions, which map the
input to the output straightforwardly without any need
for human feature engineering. (Goodfellow et al.,
2016).
In this study, we use a Long Short-Term Mem-
ory based Recurrent Neural Network (LSTM) model
(Hochreiter and Schmidhuber, 1997) for deep learn-
ing. The choice of model is motivated by the longi-
tudinal nature of the EHR data and the task to predict
sepsis as early as possible on the basis of current and
past information in a given care episode. LSTM mod-
els are particularly suited to this type of sequence la-
beling task, as it can retain information from previous
inputs in their internal memory. It also can learn from
a very distant past if the information is relevant by
using different gated cells (input, forget, and output)
where these cells determine what information to store
and what information to erase. From a clinical per-
spective, this is also relevant since typically clinical
measurements and observations closer to the outcome
is of higher importance in the care episode.
The PyTorch package (Paszke et al., 2017) was
used to implement the model on a Dell R730 server
with one Intel Xeon E5-2623 processor with 32 MB
cache memory extended with a GeForce GTX 1080
GPU. The server ran the operating system Linux De-
bian 9.1. One training cycle took approximately 60
minutes.
2.6 Baselines
The LSTM model is compared to two baselines in
the form of early warning scores that are commonly
used in clinical practice today: NEWS2 and qSOFA
(Singer et al., 2016). NEWS2 is an updated version of
the National Early Warning Score (NEWS) (Williams
et al., 2012) and constitutes an aggregate scoring sys-
tem for each time window in the episode based on
physiological measurements of respiration rate, oxy-
gen saturation, systolic blood pressure, pulse rate,
level of consciousness or new confusion, and tem-
perature. qSOFA (Quick SOFA) is another aggregate
scoring tool that takes into account altered mental sta-
tus, respiratory rate, and systolic blood pressure.
A score is originally only present in a time win-
dow if the data required for calculating the score is
also present. If no score is available at the beginning
of a care episode, a score of 0 is inserted in the corre-
sponding time window. Existing values are then car-
ried forward to subsequent time windows until a new
value is encountered. In order to convert the score to a
binary classification decision, a threshold of 5 is used
HEALTHINF 2020 - 13th International Conference on Health Informatics
48

for NEWS2 and 2 for qSOFA. These are standard de-
cision thresholds for NEWS2 and qSOFA (Williams
et al., 2012; Singer et al., 2016).
2.7 Experimental Setup
The dataset is split into 80% for training, 10% for tun-
ing and 10% for testing and evaluating the tuned mod-
els. The data is stratified in each split using an equal
probabilistic distribution with respect to both class
and sequence length. Care episodes of a sequence
length with five or fewer instances are discarded. Pos-
itive cases are care episodes in which Sepsis-3 crite-
ria were fulfilled and comprise data from admission
to sepsis onset.
Twelve different versions of the dataset are created
based on six different time window sizes (1h, 2h, 3h,
4h, 6h, and 8h) and two approaches to handling miss-
ing values: with imputation and without imputation.
In each time window, the model outputs a probability
score concerning the presence or absence of sepsis in
the patient based on current and previous information
in the care episode.
The models are evaluated using a number of
predictive performance metrics. In order to as-
sess the models globally, without a specific decision
threshold, we used Area Under the Receiver Operat-
ing Characteristic curve (AUROC) and Area Under
the Precision-Recall Curve (AUPRC). AUROC is an
overall measure of discrimination and can be inter-
preted as the probability that the model ranks a true
positive higher than a false positive. As the data is
highly imbalanced, AUPRC is considered the primary
metric for model selection.
The hyper-parameters of the LSTM model are pre-
sented in Table 1. To tune these parameters, fifty
points were chosen at random in order to more effec-
tively search the space instead of doing a grid search
in some restricted hyperparameter space. Oversam-
pling method was used to make the distribution even
(50% positive, and 50% negative) in each minibatch.
The model with the best AUPRC on the tuning set was
selected and evaluated on the test set.
Earliness is evaluated in one of two ways: (i) cal-
culating AUROC and AUPRC at different time points
before sepsis onset, and (ii) looking at the (median)
prediction times relative to sepsis onset (in hours) for
true positives. In order to evaluate earliness in terms
of (ii), class label predictions need to be made using
a decision threshold. We use a standard threshold of
> 0.5 and only allowed the model to make a single
positive prediction per care episode, retaining the first
one and ignoring predictions in subsequent windows.
Since earliness calculated in this way depends solely
on true positives, it should not be analyzed in isola-
tion, but in conjunction with more conventional per-
formance metrics like sensitivity and positive predic-
tive value. We therefore report F
1
-score, which is the
harmonic mean between precision (positive predictive
value) and recall (sensitivity), along with the median
earliness in hours. Three evaluation settings are used
to calculate earliness according to (ii) depending on
the time period in which the evaluation is carried out:
(a) <24 hours prior to sepsis onset, (b) <48 hours
prior to sepsis onset, or (c) at any time in the care
episode. The motivation for the more conservative
evaluation settings is to reduce the effect of extremely
early predictions, which perhaps should not be con-
sidered realistic from a clinical point of view. We
also report the temporal distribution of true positive
predictions.
Table 1: Neural Network Parameters.
Name Values / Range
alpha 0, 10
−4
beta one 0, 1 −10
−1
beta two 0, 1 −10
−3
hidden layers 2, 3, 4
neurons 64, 128, 256
drop out 0, 10,20, 30, 40, 50, 60, 70
epochs 1,2
mini-batch 100
classification function log-softmax
optimizer Adam optimizer
Note that the evaluation includes an assessment of
the models both in terms of their general predictive
performance and in terms of one possible way of em-
ploying the model in a clinical setting.
2.8 Experiments
A series of experiments were carried out with the use
of an LSTM model for early prediction of sepsis in
a general hospital population and compared to ex-
isting early warning scores in the form of NEWS2
and qSOFA. The experiments are centered around the
use of different time window sizes for representing
the temporally evolving EHR data. The size of the
time window affects (i) sequence length and (ii) miss-
ingness. The impact of these factors on the predic-
tive performance of the LSTM model was investi-
gated and two approaches are compared to dealing
with missing values. The predictive performance of
the LSTM models and the baselines is evaluated us-
ing a number of different metrics and the evaluation is
carried out in various configurations and time points
prior to sepsis onset. Naturally, particular attention is
Deep Learning from Heterogeneous Sequences of Sparse Medical Data for Early Prediction of Sepsis
49
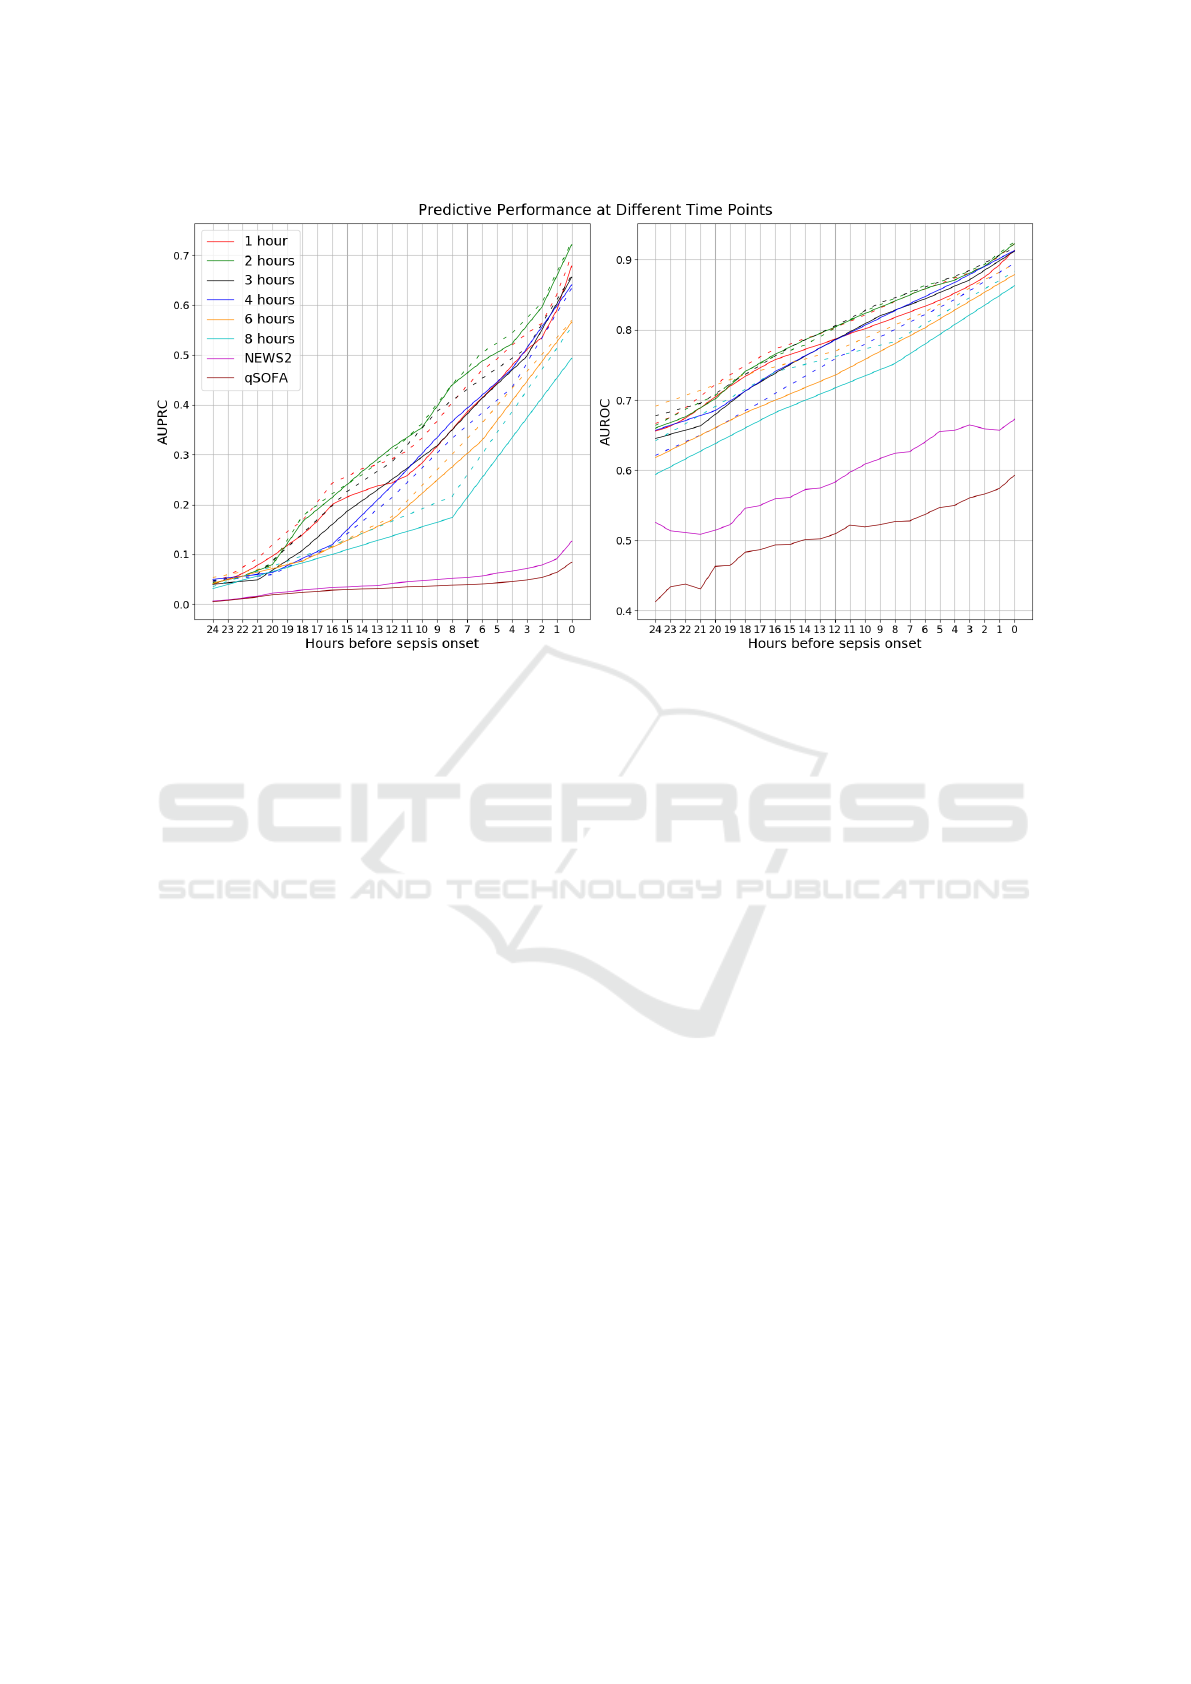
Figure 2: Left: AUPRC for each model, using test dataset, as a function of the number of hours prior to sepsis onset/discharge.
Right: AUROC for each model, using test dataset, as a function of the number of hours prior to sepsis onset/discharge. The
models are colored according to the legend in the left plot. Dotted line represents without imputation, solid line represents
with imputation.
paid to the capacity of the models to predict the out-
come as early as possible.
The following five experiments are conducted.
The first three experiments look at the predictive per-
formance of all twelve models in general, without us-
ing a specific decision threshold. The last two experi-
ments use a standard threshold of > 0.5 and only take
into account the first positive prediction, as described
earlier. Post-analyses are also conducted using the
best overall model.
Experiment 1: Different Time Window Sizes.
The impact of using different window sizes is eval-
uated on the predictive performance of the resulting
model. The choice of window size has a substan-
tial impact on the sequence length distribution and
the amount of missing values in each time window,
as seen in Figure 1.
Experiment 2: Handling Missing Values. Two
very different approaches are investigated to handling
the large amount of missing values in EHR data on a
care episode level. In one approach, data is assumed
to be missing not at random and therefore no impu-
tation is carried out; instead, the model is allowed
to learn to treat missingness as a distinct feature. In
the other approach, data is assumed to be missing at
random (i.e. for a particular set of features) and is
evaluated using a simple imputation strategy based on
carrying forward existing values and globally mean-
imputing values that are absent at the beginning of a
care episode. These two approaches to handling miss-
ing values are evaluated for each of the six time win-
dow sizes, i.e. with different degrees of missingness.
Experiment 3: Performance at Different Time
Points. In this experiment, the predictive perfor-
mance is evaluated, in terms of AUROC and AUR-
PRC, at different time points relative to sepsis on-
set, starting from 24 hours prior to onset. The LSTM
models – with different window sizes and approaches
to missingness – are compared to commonly used
early warning scores in NEWS2 and qSOFA.
Experiment 4: Evaluation of Earliness. In this
experiment, a closer look is taken at the distribution of
earliness, i.e. at which time points true positive pre-
dictions are made relative to sepsis onset, for the best
LSTM model. This is shown with a combination of
overall F
1
-score for the particular time window size.
This post-analysis is carried out with the results ob-
tained from the previous experiments.
Experiment 5: Performance with Different Se-
quences Lengths. In this experiment, the predictive
performance is analyzed, in terms of F
1
-score, on care
episodes of different sequence lengths. The purpose
of this analysis is to learn how the best model copes
with heterogeneous care episodes in terms of length
of hospital stay.
HEALTHINF 2020 - 13th International Conference on Health Informatics
50
Table 2: Earliness performance in median hours before sepsis onset combined with F
1
-score, using test dataset, with and
without imputation of missing values, using different time window sizes.
Window
Size
Without Imputation With Imputation
<24h <48h All <24h <48h All
Med. F
1
Med. F
1
Med. F
1
Med. F
1
Med. F
1
Med. F
1
1 6.00 0.65 7.37 0.53 11.79 0.28 5.90 0.61 7.77 0.48 10.78 0.25
2 7.24 0.73 8.00 0.57 12.68 0.33 7.02 0.74 8.00 0.57 13.43 0.32
3 12.45 0.77 12.57 0.65 14.34 0.38 7.78 0.75 8.33 0.65 13.00 0.42
4 7.13 0.73 7.92 0.63 14.22 0.41 11.22 0.79 10.00 0.67 13.36 0.41
6 10.09 0.76 11.00 0.68 14.00 0.46 8.43 0.74 8.48 0.65 14.00 0.44
8 8.73 0.74 9.82 0.67 14.75 0.46 6.58 0.70 8.00 0.64 24.28 0.44
3 RESULTS
In this section, the results of the above experiments
are presented in terms of (i) predictive performance at
different time points, (ii) earliness of true positive pre-
dictions, and (iii) predictive performance for episodes
of different sequence lengths.
3.1 Temporal Analysis
The overall predictive performance without a specific
decision threshold, in terms of AUPRC and AUROC,
of the different models is presented at different time
points relative to sepsis onset – from as early as 24
hours to sepsis onset time. The results, also depicting
the performance of the two baselines, are shown in
Figure 2.
As can be seen, the performance of the LSTM
models – with and without imputation – is vastly su-
perior to NEWS2 and qSOFA. The performance natu-
rally drops further from sepsis onset and does so quite
rapidly. The LSTM models without imputation gen-
erally performs better with respect to both AUPRC
and AUROC. The best results come from using a two-
hour time window, without imputation: at sepsis on-
set, the AUROC is 0.93 and AUPRC 0.73. However,
four hours prior to onset, the AUROC has dropped to
0.88 and AUPRC to 0.54. Finally, eight hours prior to
onset, the AUROC and AUPRC has dropped further
to 0.85 and 0.44, respectively.
It is clear that the size of the window has a signif-
icant impact on the predictive performance of the re-
sulting models. For instance, the difference between a
two-hour window and an eight-hour window is more
than 20 percentage points w.r.t. AUPRC and 5 per-
centage points w.r.t. AUROC at the time of sepsis
onset.
In general, assuming that data is missing not at
random leads to better predictive performance com-
pared to assuming that data is missing at random.
However, the difference is is generally smaller com-
pared to the size of the time window.
3.2 Earliness
The median in the distribution of earliness (in hours)
for true positive predictions of the models – with dif-
ferent time window sizes and with/without imputa-
tion – are shown in Table 2. Earliness results are re-
ported for the three evaluation settings (<24h, <48h
and All). Irrespective of evaluation setting, all models
are able to predict sepsis more than five hours before
onset in half of the cases, with the best median result
as early as 24.28 hours prior. We also present the F
1
-
scores of the models. F
1
-score is calculated by allow-
ing only one positive prediction in the care episodes
where the decision threshold was >0.5. With this par-
ticular way of using the model for early prediction,
the best result is obtained in the <24h setting with
a four-hour time window and imputation of missing
values: the F
1
-score is 0.79 and the median earliness
is 11.22 hours prior to sepsis onset.
In addition to the median values reported in Ta-
ble 2, the distribution of true positive predictions
with respect to earliness in hour is shown in Figure
3. The distribution is obtained from the overall best
model: a two-hour time window and without impu-
tation of missing values. When evaluating the en-
tire care episode (All), the median earliness in iden-
tifying sepsis is 12.68 hours before sepsis onset. In
the more conservative evaluation settings (<24h and
<48h), the median is 7.24 and 8.0 hours before onset,
respectively.
The distribution of earliness is also shown in Fig-
ure 4. Here, each bin represents the successive two
hours of prior predictions up to 24 hours. As can be
seen, there are relatively more true positive predic-
tions closer to sepsis onset. However, there are also
cases of earlier predictions, up to 24 hours prior to
sepsis onset. The bin representing earliness >24h in-
Deep Learning from Heterogeneous Sequences of Sparse Medical Data for Early Prediction of Sepsis
51
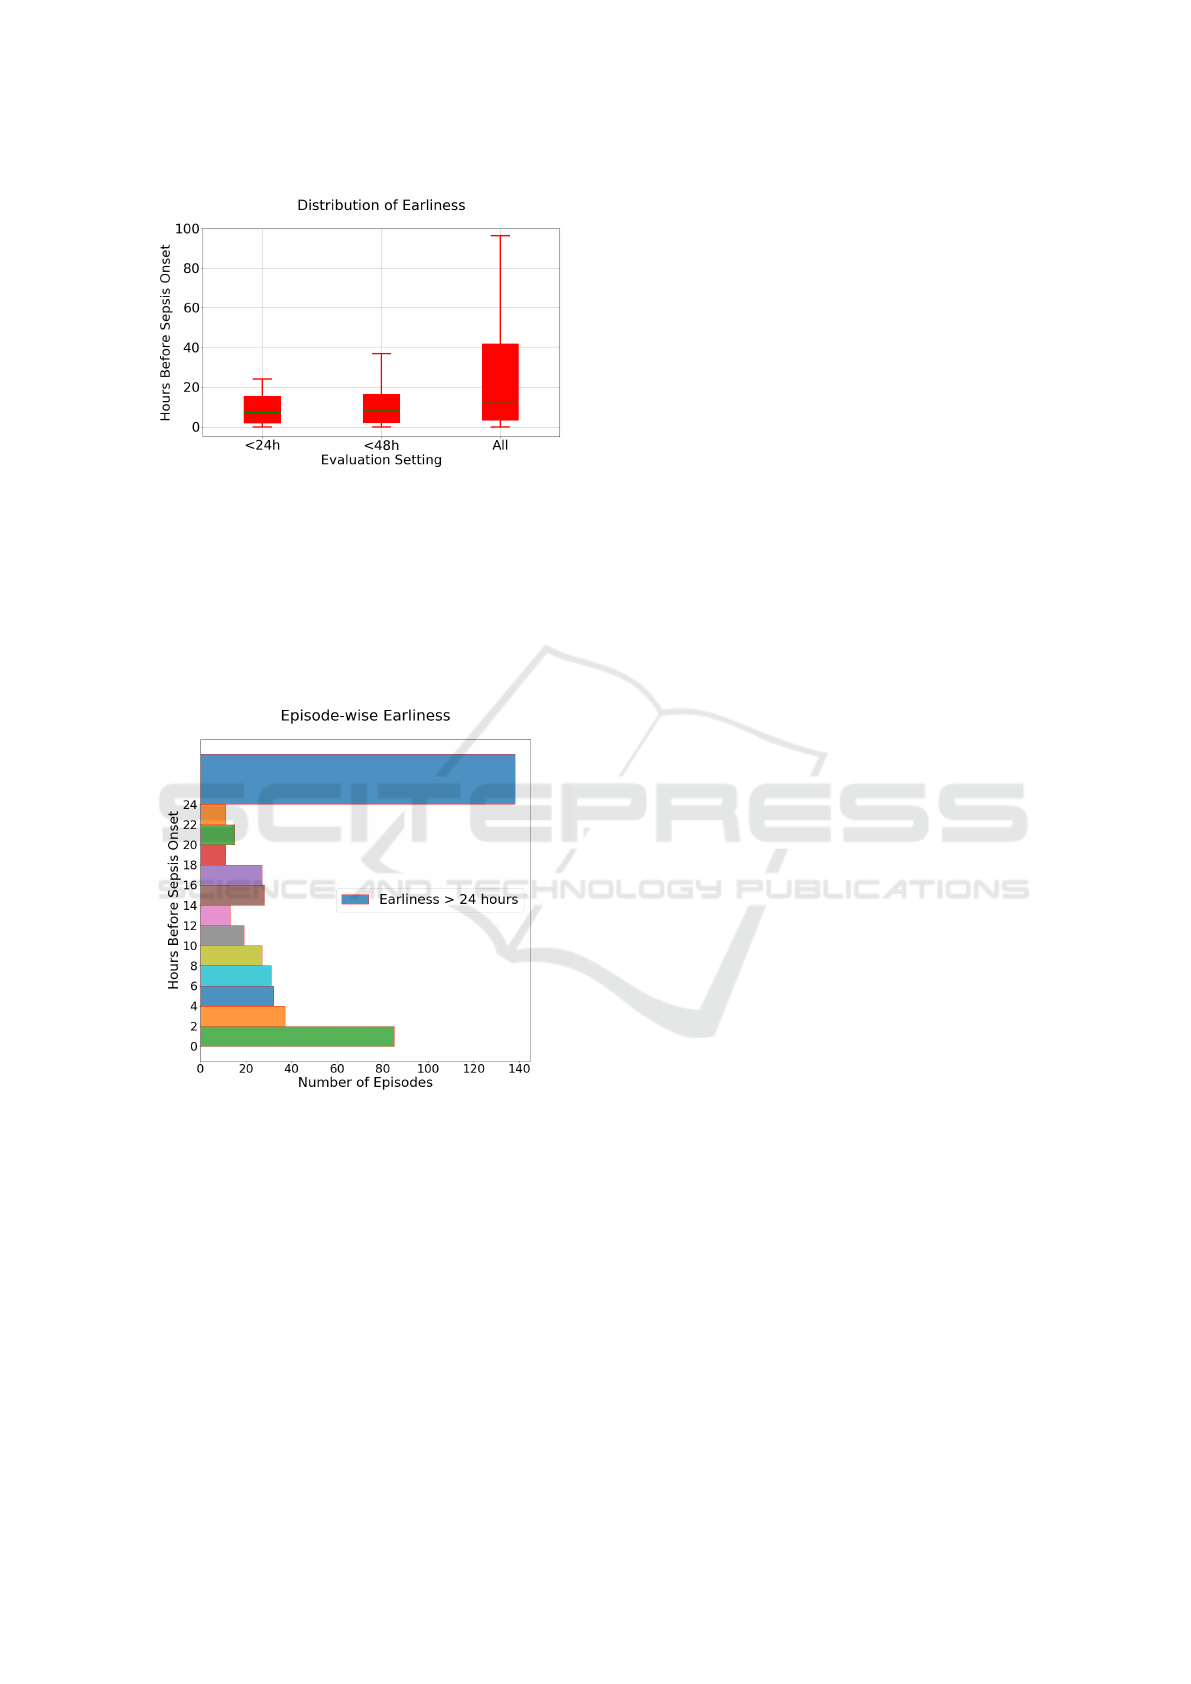
Figure 3: The distribution of earliness, using test dataset,
measured in terms of hours prior to sepsis onset, for true
positive cases in three different evaluation settings: allow-
ing true positives only <24h or <48h before sepsis onset,
as well as any time (All) prior to sepsis onset. Results are
shown for the best model: 2h time window, no imputation.
cludes some very early true positive predictions, for
example, predictions >96h prior to sepsis, which can
be regarded as outliers.
Figure 4: The distribution of earliness, using test dataset,
measured in terms of hours prior to sepsis onset from the
best LSTM model (2h time window, no imputation), evalu-
ation setting ’All’.
3.3 Episode Sequence Length
As using different time window sizes has a signifi-
cant impact on the length of sequences that consti-
tute the care episodes, the predictive performance of
the model is also evaluated with respect to sequence
length. In Figure 5, the F
1
-score calculated as a lo-
cal scope of evaluation (described in section 2.8) at
the sepsis onset time (time zero) of our best model is
shown. The care episodes in the test set are binned
in such a way that each bin contains at least 1000 test
instances, ensuring that there is sufficient statistical
evidence for estimating performance. As a result, the
bins may vary in size: there are, for instance, many
episodes of length 1 (n>1000), i.e. comprising only
a single time window (here, 2h), which make up one
bin. As seen in Figure 1, the episode sequence length
distribution is skewed towards shorter sequences; as a
result, the bins encompass more sequence lengths the
longer the sequences get.
In general, the model performs better on shorter
care episodes. The results are high for sequences
comprising fewer than around eleven time windows.
The performance degrades quickly with care episodes
of length greater than eleven.
4 DISCUSSION
In this study, our aim was not to propose a novel deep
learning architecture for early prediction of sepsis.
We rather wanted to take a step back and investigate
two basic and interconnected assumptions, without
empirical or theoretical justification, made by current
state-of-the-art models (Futoma et al., 2017a,b; Moor
et al., 2019): (i) dividing the temporal EHR data into
hourly time windows and prediction times, and (ii)
treating missing values in the care episodes as miss-
ing at random. We carried out an extensive empirical
investigation into these matters and moreover focused
on early detection of sepsis in the non-ICU setting,
where data is considerably more sparse and hetero-
geneous. As the choice of window size affects the
number of windows in each care episode, we also in-
vestigated how the model performs on care episodes
of different (sequence) lengths.
The investigation demonstrates that the size of the
time window used for dividing up a patient’s longi-
tudinal EHR data has a clear impact on the predic-
tive performance of the model. The size of the time
window is hence an important consideration and a de-
sign choice that needs to justified, either empirically
or from a clinical point of view. In our non-ICU set-
ting, with heterogeneous data representative of a gen-
eral hospital population, we found that using a 2-hour
time window led to the best predictive performance
overall. In an ICU setting, it may very well be that
a smaller window leads to better performance since
the data is of higher resolution and less sparse. As
described earlier, the size of the time window has a
significant impact on sparsity per care episode and
how often clinical measurements are taken will differ
significantly in ICU vs. non-ICU settings. However,
as clinical measurements are not taken as frequently
HEALTHINF 2020 - 13th International Conference on Health Informatics
52
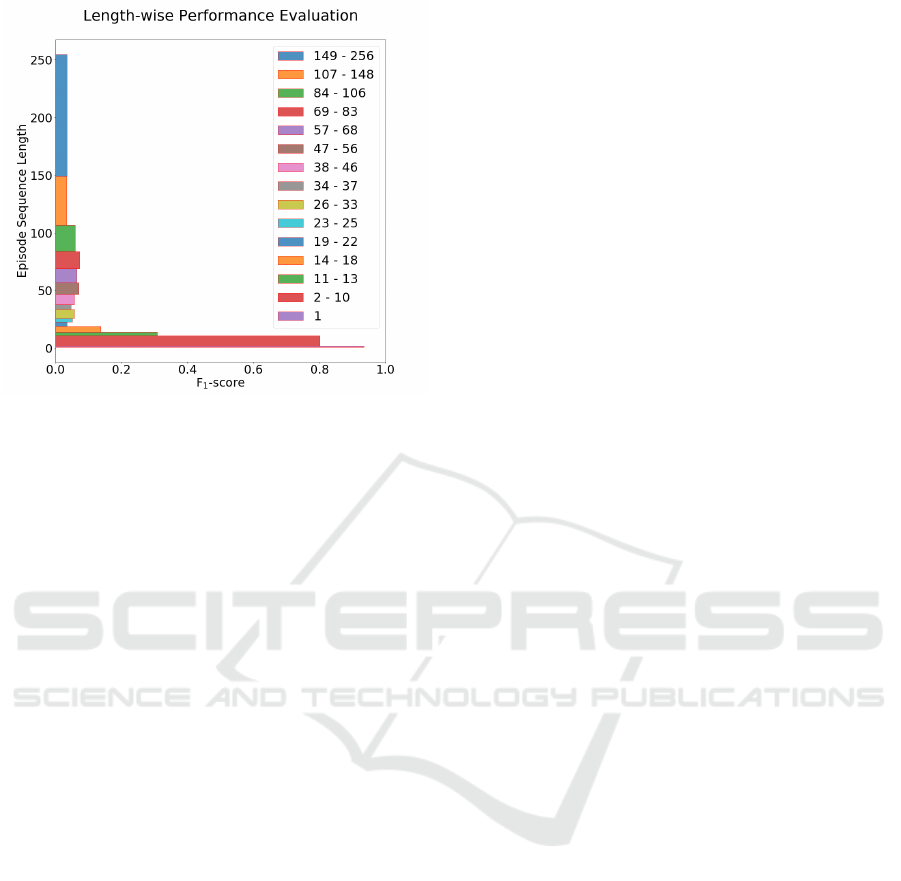
Figure 5: Prediction performance of the best LSTM model
(2h time window, no imputation, evaluation setting ’All’)
for episodes with different sequence lengths using test
dataset. Each bin is created such that it contains at least
1000 test instances. The analysis is carried out using F
1
-
score.
in the non-ICU setting, only considering the ”worst”
value – as we have done here – for each feature and
time window may not be adequate since, in this way,
we are discarding potentially valuable information. In
future work, a method is needed that better utilizes all
of the available data.
An important challenge lies in handling the ex-
treme sparsity (as shown in Figure 1, right) in non-
ICU EHR data. In this study, we used 22 features,
and the missingness in our data per feature is on aver-
age 72.7%, with a median of 87.6% (with a four-hour
time window). The variance across care episodes is
substantial and could in future be modeled using an
end-to-end hybrid attention-based neural architecture
(Vaswani et al., 2017), where different attention can
be provided to an episode when it is sparse and oth-
erwise. Previous studies in the area consider miss-
ingness as a random phenomenon and model it on an
evenly spaced grid using the Multitask Gaussian Pro-
cess (MGP) adapters (Futoma et al., 2017a,b; Moor
et al., 2019). However, data in the clinical setting is
often missing not at random. On the contrary, miss-
ingness may provide important information about the
condition of the patient or the assessment of the treat-
ing physician. The meaning of a missing value, and
thereby also how it should be handled, may also vary
across medical institutions. For instance, if some
tests are completed routinely at one location, but only
when there is a suspected infection at another, then
there will be a significant difference in the predictive
contribution of missingness between the two loca-
tions. It may therefore be counterproductive to impute
missing values in all cases and our preliminary results
support this notion. In this study, we experimented
with very basic techniques for imputation and mod-
eling missingness as a feature, i.e. using a dummy
value. In the future, we plan to represent missing-
ness not at random in a more sophisticated way, for
example using advanced Generative Adversarial Net-
works (GANs) (Li et al., 2019) to model the missing
data distribution as not at random. We also plan to ex-
plore approaches capable of modeling both data that
is missing at random and not at random. Attention-
based architectures, as described above, could also be
utilized here where both types of missingness can be
modeled in an end-to-end manner.
Model evaluation using AUROC and AUPRC
is common practice in machine learning, including
for the early sepsis prediction task (Futoma et al.,
2017a,b; Moor et al., 2019). AUROC and AUPRC
provide a global view of predictive performance, mea-
sured on a continuum of thresholds values for the
classification of patients into sepsis and no sepsis. In
order to deploy a machine learning model in a real
clinical setting, however, the model should be tuned
according to the circumstances and prerequisites of
the medical institution in which it will be used. The
decision threshold can be optimized according to one
or more performance metrics and this choice should
be informed by clinical needs – a decision that may
depend on, for instance, the tolerance for false posi-
tives. In this paper, we used a decision threshold of
>0.5 for positive predictions and only allowed one
positive prediction per episode. There are many alter-
native ways of deploying the model, not only using
a different decision threshold, but also, for instance,
allowing the model to make multiple predictions and
silencing the model for some period following a false
positive, i.e. according to the attending physician.
The results also show that the optimal window size
is different when evaluating the model from a general
perspective and when employing the model in a spe-
cific manner. It indicates that the window size needs
to be determined accordingly.
In the future, we will try to modify the neural
network-based architecture based on the insights we
obtained from this study as described above. We may
also explore using a dynamic window size depend-
ing, for instance, on the level of sparsity. To enrich
our data representation, we will also incorporate free
EHR text data with our current structured data, as pre-
vious work has shown that it can lead to improved
predictive performance for outcome prediction (Hen-
riksson et al., 2015). Multihead attention, in par-
ticular, has proven to be the reason for the success
Deep Learning from Heterogeneous Sequences of Sparse Medical Data for Early Prediction of Sepsis
53

of state-of-art pre-trained natural language process-
ing embedding models based on BERT (Huang et al.,
2019; Alsentzer et al., 2019) for downstream tasks,
which can be used in this context. The explainability
of the model is a crucial issue here as this can be uti-
lized by different stakeholders (Lipton, 2017). In the
future, we will also explore this explainability issue.
5 CONCLUSIONS
We investigated missingness and different time win-
dow sizes in extremely sparse EHR data obtained
from a Swedish university hospital for the task of
early prediction of sepsis using a deep learning-based
LSTM model. It was shown that the size of the win-
dow has a significant impact on the predictive perfor-
mance of the models. We also observed that treating
missing data as missing not at random can in some
cases lead to better predictive performance compared
to assuming that it is missing at random.
REFERENCES
Alsentzer, E., Murphy, J. R., Boag, W., Weng, W.-H.,
Jin, D., Naumann, T., and McDermott, M. (2019).
Publicly available clinical bert embeddings. arXiv
preprint arXiv:1904.03323.
Cassini, A., Plachouras, D., Eckmanns, T., Sin, M. A.,
Blank, H.-P., Ducomble, T., Haller, S., Harder, T.,
Klingeberg, A., Sixtensson, M., et al. (2016). Bur-
den of six healthcare-associated infections on Euro-
pean population health: estimating incidence-based
disability-adjusted life years through a population
prevalence-based modelling study. PLoS medicine,
13(10):e1002150.
Dalianis, H., Henriksson, A., Kvist, M., Velupillai, S., and
Weegar, R. (2015). Health bank-a workbench for data
science applications in healthcare. In CAiSE Industry
Track, pages 1–18.
Delahanty, R. J., Alvarez, J., Flynn, L. M., Sherwin, R. L.,
and Jones, S. S. (2019). Development and Evaluation
of a Machine Learning Model for the Early Identifi-
cation of Patients at Risk for Sepsis. Annals of emer-
gency medicine.
Desautels, T., Calvert, J., Hoffman, J., Jay, M., Kerem, Y.,
Shieh, L., Shimabukuro, D., Chettipally, U., Feldman,
M. D., Barton, C., et al. (2016). Prediction of sepsis in
the intensive care unit with minimal electronic health
record data: a machine learning approach. JMIR med-
ical informatics, 4(3).
Despins, L. A. (2017). Automated detection of sepsis using
electronic medical record data: a systematic review.
Journal for Healthcare Quality, 39(6):322–333.
Ferrer, R., Martin-Loeches, I., Phillips, G., Osborn, T. M.,
Townsend, S., Dellinger, R. P., Artigas, A., Schorr,
C., and Levy, M. M. (2014). Empiric antibiotic treat-
ment reduces mortality in severe sepsis and septic
shock from the first hour: results from a guideline-
based performance improvement program. Critical
care medicine, 42(8):1749–1755.
Futoma, J., Hariharan, S., and Heller, K. (2017a). Learn-
ing to detect sepsis with a multitask Gaussian process
RNN classifier. In Proceedings of the 34th Interna-
tional Conference on Machine Learning-Volume 70,
pages 1174–1182. JMLR.org.
Futoma, J., Hariharan, S., Heller, K., Sendak, M., Bra-
jer, N., Clement, M., Bedoya, A., and O’Brien, C.
(2017b). An improved multi-output gaussian process
rnn with real-time validation for early sepsis detec-
tion. In Doshi-Velez, F., Fackler, J., Kale, D., Ran-
ganath, R., Wallace, B., and Wiens, J., editors, Pro-
ceedings of the 2nd Machine Learning for Health-
care Conference, volume 68 of Proceedings of Ma-
chine Learning Research, pages 243–254, Boston,
Massachusetts. PMLR.
Goodfellow, I., Bengio, Y., and Courville, A. (2016). Deep
learning. MIT press.
Henriksson, A., Zhao, J., Bostr
¨
om, H., and Dalianis, H.
(2015). Modeling heterogeneous clinical sequence
data in semantic space for adverse drug event detec-
tion. In 2015 IEEE International Conference on Data
Science and Advanced Analytics (DSAA), pages 1–8.
IEEE.
Hochreiter, S. and Schmidhuber, J. (1997). Long short-term
memory. Neural computation, 9(8):1735–1780.
Huang, K., Altosaar, J., and Ranganath, R. (2019). Clinical-
bert: Modeling clinical notes and predicting hospital
readmission. arXiv preprint arXiv:1904.05342.
Jones, A. E., Shapiro, N. I., Trzeciak, S., Arnold, R. C.,
Claremont, H. A., Kline, J. A., Investigators, E. M. S.
R. N. E., et al. (2010). Lactate clearance vs central ve-
nous oxygen saturation as goals of early sepsis ther-
apy: a randomized clinical trial. Jama, 303(8):739–
746.
Kumar, A., Roberts, D., Wood, K. E., Light, B., Parrillo,
J. E., Sharma, S., Suppes, R., Feinstein, D., Zanotti,
S., Taiberg, L., et al. (2006). Duration of hypotension
before initiation of effective antimicrobial therapy is
the critical determinant of survival in human septic
shock. Critical care medicine, 34(6):1589–1596.
Li, S. C.-X., Jiang, B., and Marlin, B. (2019). Misgan:
Learning from incomplete data with generative adver-
sarial networks. arXiv preprint arXiv:1902.09599.
Lipton, Z. C. (2017). The doctor just won’t accept that!
arXiv preprint arXiv:1711.08037.
Mani, S., Ozdas, A., Aliferis, C., Varol, H. A., Chen, Q.,
Carnevale, R., Chen, Y., Romano-Keeler, J., Nian, H.,
and Weitkamp, J.-H. (2014). Medical decision sup-
port using machine learning for early detection of late-
onset neonatal sepsis. Journal of the American Medi-
cal Informatics Association, 21(2):326–336.
Moor, M., Horn, M., Rieck, B., Roqueiro, D., and
Borgwardt, K. (2019). Early recognition of sep-
sis with gaussian process temporal convolutional net-
works and dynamic time warping. arXiv preprint
arXiv:1902.01659.
HEALTHINF 2020 - 13th International Conference on Health Informatics
54

Nahler, G. (2009). anatomical therapeutic chemical clas-
sification system (ATC), pages 8–8. Springer Vienna,
Vienna.
Paszke, A., Gross, S., Chintala, S., Chanan, G., Yang, E.,
DeVito, Z., Lin, Z., Desmaison, A., Antiga, L., and
Lerer, A. (2017). Automatic differentiation in Py-
Torch. In NIPS-W.
Raghu, A., Komorowski, M., Ahmed, I., Celi, L., Szolovits,
P., and Ghassemi, M. (2017a). Deep reinforce-
ment learning for sepsis treatment. arXiv preprint
arXiv:1711.09602.
Raghu, A., Komorowski, M., Celi, L. A., Szolovits, P., and
Ghassemi, M. (2017b). Continuous state-space mod-
els for optimal sepsis treatment-a deep reinforcement
learning approach. arXiv preprint arXiv:1705.08422.
Seymour, C. W., Gesten, F., Prescott, H. C., Friedrich,
M. E., Iwashyna, T. J., Phillips, G. S., Lemeshow, S.,
Osborn, T., Terry, K. M., and Levy, M. M. (2017).
Time to treatment and mortality during mandated
emergency care for sepsis. New England Journal of
Medicine, 376(23):2235–2244.
Seymour, C. W., Liu, V. X., Iwashyna, T. J., Brunkhorst,
F. M., Rea, T. D., Scherag, A., Rubenfeld, G., Kahn,
J. M., Shankar-Hari, M., Singer, M., et al. (2016). As-
sessment of clinical criteria for sepsis: for the Third
International Consensus Definitions for Sepsis and
Septic Shock (Sepsis-3). Jama, 315(8):762–774.
Singer, M., Deutschman, C. S., Seymour, C. W., Shankar-
Hari, M., Annane, D., Bauer, M., Bellomo, R.,
Bernard, G. R., Chiche, J.-D., Coopersmith, C. M.,
et al. (2016). The third international consensus defi-
nitions for sepsis and septic shock (Sepsis-3). Jama,
315(8):801–810.
Smith, G. B., Prytherch, D. R., Meredith, P., Schmidt, P. E.,
and Featherstone, P. I. (2013). The ability of the Na-
tional Early Warning Score (NEWS) to discriminate
patients at risk of early cardiac arrest, unanticipated
intensive care unit admission, and death. Resuscita-
tion, 84(4):465–470.
Steele, A. J., Denaxas, S. C., Shah, A. D., Hemingway,
H., and Luscombe, N. M. (2018). Machine learn-
ing models in electronic health records can outper-
form conventional survival models for predicting pa-
tient mortality in coronary artery disease. PloS one,
13(8):e0202344.
Taylor, R. A., Pare, J. R., Venkatesh, A. K., Mowafi, H.,
Melnick, E. R., Fleischman, W., and Hall, M. K.
(2016). Prediction of in-hospital mortality in emer-
gency department patients with sepsis: A local big
data–driven, machine learning approach. Academic
emergency medicine, 23(3):269–278.
Vaswani, A., Shazeer, N., Parmar, N., Uszkoreit, J., Jones,
L., Gomez, A. N., Kaiser, Ł., and Polosukhin, I.
(2017). Attention is all you need. In Advances in
neural information processing systems, pages 5998–
6008.
Vincent, J.-L., De Mendonc¸a, A., Cantraine, F., Moreno,
R., Takala, J., Suter, P. M., Sprung, C. L., Colardyn,
F., and Blecher, S. (1998). Use of the SOFA score to
assess the incidence of organ dysfunction/failure in in-
tensive care units: results of a multicenter, prospective
study. Critical care medicine, 26(11):1793–1800.
Vincent, J.-L., Moreno, R., Takala, J., Willatts, S.,
De Mendonc¸a, A., Bruining, H., Reinhart, C., Suter,
P., and Thijs, L. (1996). The sofa (sepsis-related organ
failure assessment) score to describe organ dysfunc-
tion/failure. Intensive care medicine, 22(7):707–710.
Williams, B., Alberti, G., Ball, C., Ball, D., Binks, R.,
Durham, L., et al. (2012). Royal college of physicians,
national early warning score (news), standardising the
assessment of acute-illness severity in the nhs, london.
Deep Learning from Heterogeneous Sequences of Sparse Medical Data for Early Prediction of Sepsis
55
