
Comparison of Gadolinium Contrast Agent Retention in Patients
Receiving Multiple Contrast-enhanced MRI Exams
Ryan Fisher, Vikas Jain, Jonathan Glaab and Aubrey McMillan
Department of Radiology, The MetroHealth System, Cleveland, Ohio, U.S.A.
Keywords: Magnetic Resonance Imaging, Gadolinium-based Contrast Agents, Gadolinium Retention.
Abstract: Gadolinium-based contrast agents have long been utilized in magnetic resonance imaging (MRI) to enhance
image quality. Aside from the few reported cases of Nephrogenic Systemic Fibrosis in patients with severely
compromised renal function, these contrast agents have generally been viewed as safe. However, recent
studies have shown evidence of the retention of potentially toxic gadolinium well beyond the previously
recognized clearing times in patients with normal renal function. This retention has been shown via persistent
hyper-intense signal in certain brain regions in unenhanced MRI exams. The exact form of retained
gadolinium and its long-term potential health effects remain unknown at this time. Due to concerns over
retained gadolinium, our hospital switched to a more stably bound contrast agent in the spring of 2018. This
study examined brain MRI images from patients with multiple contrast-enhanced exams using either the older,
more unstable, linear agent, and the newer, more stable, macrocyclic agent. Signal intensities were measured
in the globus pallidus and dentate nucleus; regions of the brain that have previously been shown to accumulate
heavy metals such as gadolinium. Statistically significant increases in signal intensity were seen in the dentate
nucleus in the linear contrast agent group, but not in the macrocyclic agent group. No significant signal
increases were seen with either agent in the globus pallidus region of the brain. No correlation was seen
between signal increase and the volume of contrast agent administered for either region or contrast agent.
1 INTRODUCTION
Intravenous gadolinium-based contrast agents
(GBCAs) have been utilized extensively in magnetic
resonance imaging (MRI) to enhance image quality.
These agents are injected intravenously and contain
paramagnetic molecules that act to shorten the T1
relaxation time of protons in surrounding tissues,
enhancing signal strength and brightness, which can
be especially valuable in locating lesions and tumors
in the brain.
GBCAs are produced in various chemical forms
and consist of a gadolinium ion bonded to an organic
ligand molecule to form a chelate. The ligand can take
the form of either a linear or ring-shaped molecule,
which is referred to as “macrocyclic.” Depending on
the chemical structure, both molecular shapes can be
further classified as either “ionic” or “non-ionic”
based on the type of bond between the ligand and the
Gd
3+
ion. Linear contrast agents are not as chemically
stable as macrocyclic agents, which more tightly bind
the Gd
3+
ion, and ionic bonds are stronger than non-
ionic. (McDonald et al., 2018). A more unstable agent
is more likely to dissociate the gadolinium ion from
the ligand.
GBCAs have long been considered safe, as the
potentially toxic free Gd
3+
ion is bound to the ligand
and most of the agent is excreted within 24 hours of
injection in patients with normal kidney function.
Nephrogenic systemic fibrosis (NSF), a rare but
potentially fatal condition has been reported in a
small number of patients with severely compromised
renal function who receive GBCAs. Though the exact
cause and mechanism for NSF is unknown, longer
exposure to gadolinium in patients who can’t
biologically clear it as quickly is thought to be a
factor. Improved screening for patient renal function
has largely eliminated instances of NSF in the last
decade.
Though thought to be safe for those with normal
kidney function, recent studies have shown long term
retention of gadolinium contrast in various parts of
the body; primarily in the brain (Kanda, Ishii,
Kawaguchi, Kitajima, & Takenaka, 2014; Kanda et
al., 2015) and bone (Gibby, Gibby, & Gibby, 2004;
White, Gibby, & Tweedle, 2006), in patients with
otherwise normal renal function. This retention was
Fisher, R., Jain, V., Glaab, J. and McMillan, A.
Comparison of Gadolinium Contrast Agent Retention in Patients Receiving Multiple Contrast-enhanced MRI Exams.
DOI: 10.5220/0008909101090115
In Proceedings of the 13th International Joint Conference on Biomedical Engineering Systems and Technologies (BIOSTEC 2020) - Volume 2: BIOIMAGING, pages 109-115
ISBN: 978-989-758-398-8; ISSN: 2184-4305
Copyright
c
2022 by SCITEPRESS – Science and Technology Publications, Lda. All rights reserved
109

first identified visually via persistent increased signal
intensity on non-contrast T1-weighted images in
certain areas of the brain, primarily in the dentate
nucleus and globus pallidus regions (Kanda et al.,
2015b; Radbruch et al., 2015). Essentially, residual
gadolinium in some form is retained in the body and
concentrated in these brain areas, leading to increased
MR signal in non-contrast-enhanced images where
such signal would not be expected. Gadolinium
retention has been verified with inductively coupled
plasma mass spectrometry in tissue samples excised
from patients and cadavers (Gibby et al., 2004; White
et al., 2006; Kanda et al., 2015a).
While the mechanism of retention and exact
chemical form of retained gadolinium remains
unknown, dose dependent retention in the brain has
been demonstrated in patients receiving as few as two
doses of linear GBCAs (Kanda et al., 2014, 2015b),
with larger signal increases seen in patients with
higher cumulative doses. Similar studies have
generally shown no such measurable levels of brain
retention with ionicly bonded macrocyclic agents,
which more tightly bind the Gd
3+
ion to the ligand,
pointing to the likelihood that dissociation of Gd
3+
is
involved in the process (Kanda et al., 2015b, Moser
et al., 2018, Radbruch et al., 2015). However, there
have been recent studies indicating gadolinium
retention with macrocyclic agents, though at a lower
level than as seen with linear agents (Bjørnerud et al,
2017, Splendiani et al., 2019). Any long-term clinical
significance of deposited gadolinium remains
unknown, though there are patients who have
reported clinical symptoms they attribute to
gadolinium toxicity (Ramalho et al., 2016).
Due to concerns over the unknown effects of
gadolinium retention, our institution switched from
using the linear, non-ionic contrast agent
gadodiamide (trade name, Omniscan; GE Healthcare,
Piscataway, New Jersey) to the macrocyclic, ionic
agent gadoteric acid (trade name, Dotarem; Guerbet,
Aulnay-sous-Bois, France) in the spring of 2018. The
aim of this work is to investigate differences in signal
intensity in non-contrast T1-weighted MR images of
the brain from patients who received multiple
administrations of GBCA before and after the switch
from a linear to a macrocyclic contrast agent. Each
patient group received between three and seven
administrations of linear or macrocyclic GBCA
exclusively, and correlation between increased signal
intensity in areas of the brain and the amount of
administered contrast agent was explored.
2 METHOD
This study was approved by the hospital Institutional
Review Board (IRB), and due its retrospective nature,
written informed consent was not required. Prior
imaging for patients receiving clinically indicated
contrast-enhanced MR scans of the head were used.
A total of eighteen patients were investigated.
Two groups of nine patients who received serial
administrations of either the linear (Omniscan) or
macrocyclic (Dotarem) GBCA were selected based
on analysis of records of routine head MRI exams in
the department between January 2016 and August
2019. The institution switched from Omniscan to
Dotarem in the spring of 2018, and both contrast
agents are dispensed in the same concentration (0.5
mmol/mL) using the same weight-based dosage of
0.2 mL/kg.
2.1 Patient Selection
Due to the recent switch to the macrocyclic agent,
fewer overall patients with multiple administrations
of Dotarem were available for the study, limiting the
group size. The nine selected patients had received at
least three administrations exclusively with the
macrocyclic contrast agent within our radiology
department. The mean number of administrations for
the group was 3.67 (SD 1.25), with six patients
receiving three administrations, two receiving four,
and one receiving seven contrast administrations.
Once the patients in the macrocyclic agent group
were identified, patients were selected for the linear
agent group, attempting to match the characteristics
of number of exams, accumulated dose of contrast
agent, and mean days between administrations as
closely as possible. Nine patients overall were
selected, with an average number of exams matching
that of the macrocyclic group. The accumulated dose
and average number of weeks between contrast
administrations for both groups of patients are shown
in Table 1. Patient records for both groups were
examined back through 2013 to ensure there were no
previous contrast-enhanced exams prior to the period
used in the study.
Patient medical records for both groups were also
screened for signs of abnormal renal function during
the period of the study. Aside from a small transient
decrease in renal function test results in three patients,
all had documented estimated glomerular filtration
rates (eGFR) > 60 ml/min per 1.73 m
2
recent to the
date of the last MR exam, indicating no evidence of
compromised renal function.
BIOIMAGING 2020 - 7th International Conference on Bioimaging
110
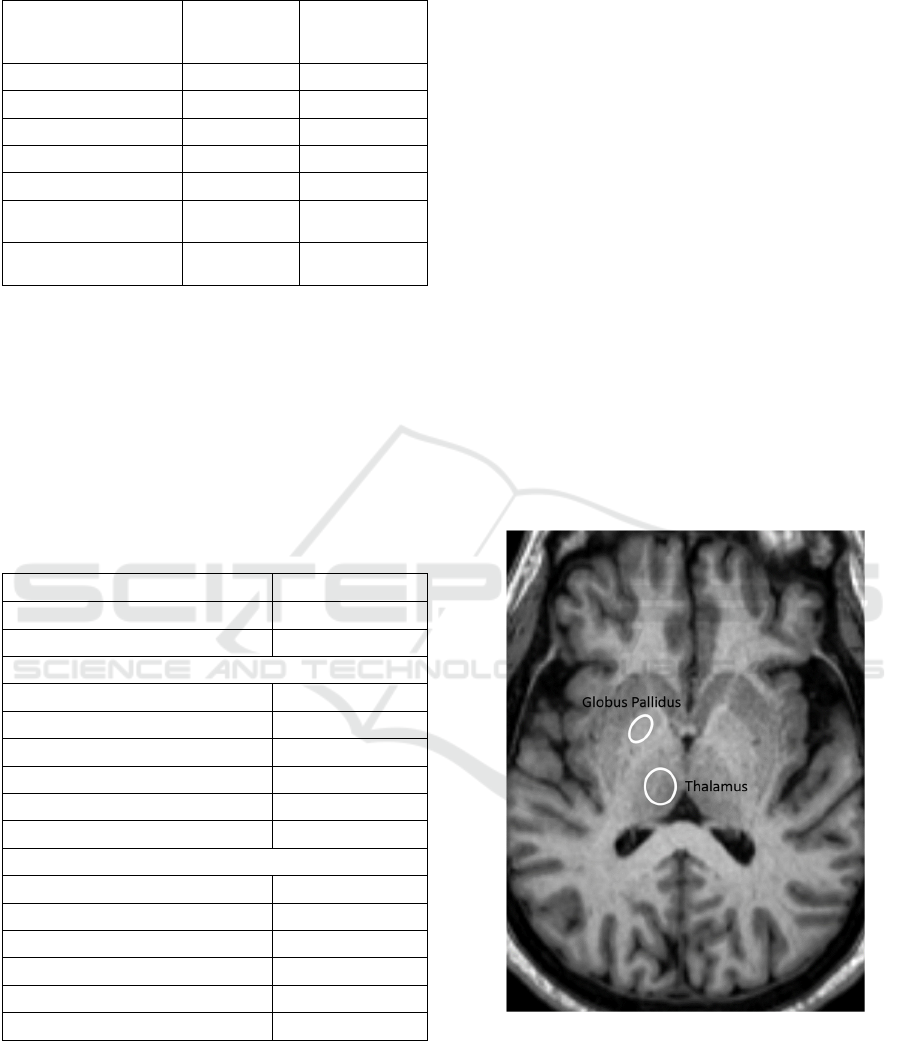
Table 1: Comparison of patient groups.
Linear GBCA
(Omniscan)
Grou
p
Macrocyclic
GBCA
(
Dotarem
)
Grou
p
Number of patients 9 9
Female 3 3
Male 6 6
Age (y) 51.0 ± 12.2 54.0 ± 14.64
Mean # of exams 3.67 ± 1.25 3.67 ± 1.25
Mean accumulated dose
(
ml
)
64.3 ± 19.4 60.4 ± 19.4
Mean weeks between
exams
4.9 ± 2.1 7.0 ± 3.7
2.2 Imaging
Non-contrast-enhanced T1-weighted axial images
taken from each patient’s first and most recent
clinically indicated whole brain MRI exam were
analysed for this study. Images were acquired
exclusively on a single Philips Achieva Nova 1.5 tesla
scanner in the hospital’s radiology department. Image
acquisition parameters are summarized in Table 2.
Table 2: MRI scanner image acquisition parameters.
Manufacture
r
Philips
Model Achieva Nova
B0 Strength (tesla) 1.5
T1 Axial Scan Protocol
Repetition Time (TR) (ms) 450-650
Echo Time (TE) (ms) 15
Slice Thickness (mm) 4
# Signals Acquired 1
Matrix Size 256 x 163
Slice Thickness (mm) 5
T2 Axial Scan Protocol
Repetition Time (TR) (ms) 6479
Echo Time (TE) (ms) 100
Slice Thickness (mm) 4
# Signals Acquired 2
Matrix Size 384 x 242
Slice Thickness (mm) 5
2.3 Data Collection
Quantitative measurements were taken by two board
certified radiologists (V.J. and J.G., with eleven and
one years’ experience, respectively), who were
blinded to the contrast agent in use while making
measurements. Using a method similar to Kanda et al.
(2014), each patient’s first and most recent
unenhanced T1-weighted brain MRI examination
was used to measure signal intensity in the globus
pallidus (GP) and the dentate nucleus (DN);
structures of the brain previously shown to
preferentially deposit gadolinium (Kanda et al.,
2015b). Circular or oval shaped regions of interest
(ROIs) on the order of 20-60 mm
2
were drawn to
cover anatomy in each structure within the Centricity
PACS image viewer (GE Healthcare, Barrington,
Illinois). As a point of comparison, signal intensity
was also measured in surrounding background
regions of the brain, including the thalamus and the
pons, which have not previously shown deposition of
retained gadolinium. As all structures but the pons are
bilateral, measurements were taken on both the left
and right sides for each structure, with a single central
measurement taken in the pons. In instances where
anatomy could not be accurately identified in the T1
scan, T2 weighted images from the same examination
were used to aid in proper anatomical ROI placement.
Clinical scans with ROIs in place are shown in
Figures 1 and 2.
Figure 1: Regions of interest in place in the globus pallidus
and thalamus on an unenhanced, axial T1 weighted MR
image.
Since there is no standardized intensity scale for
pixel signal in MR images, direct comparison
between measurements in different images, even
Comparison of Gadolinium Contrast Agent Retention in Patients Receiving Multiple Contrast-enhanced MRI Exams
111
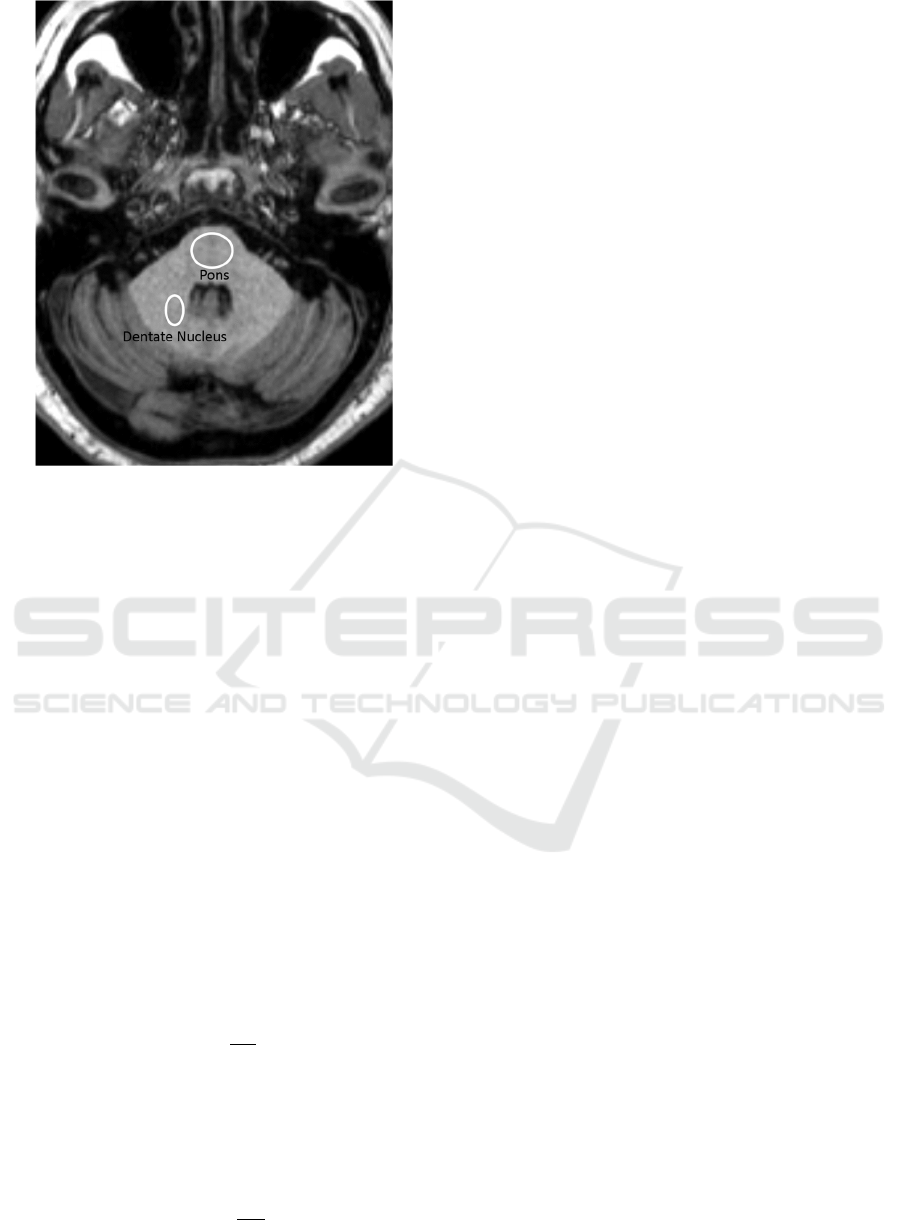
Figure 2: Regions of interest in place in the dentate nucleus
and pons in unenhanced axial T1 MRI images.
those obtained on the same scanner with the same
imaging sequence, is not meaningful. To compensate
for this, the measured signal values from the target
and background structures in a given slice image were
used to calculate the signal intensity (SI) ratio for the
two regions. Absent any outside factors, the signal
intensity in the target and background structures
should be the same, yielding a ratio of ~1. Any
retained gadolinium in the target structure would
cause signal in that area to be greater than that of the
background structure, increasing the SI in relation to
the relative amount of Gd present. Since the SI ratio
is relative within a given image, it can be readily
compared between exams in order to infer the
presence of retained gadolinium in the brain.
The globus pallidus signal intensity ratio for each
image was calculated by dividing the average of the
signals measured in both sides of the GP by the mean
signal, similarly calculated, measured in the
thalamus, using the following formula:
(1)
Similarly, the dentate nucleus signal intensity
ratio was calculated by dividing the average of the
measured signals on both sides of the DN by the
signal measured in the pons, using the following
formula:
(2)
In cases where only one measurement was
available due to the presence of tumor, edema, or
infarct in the measurement area, only a single side
measurement was used. One patient in the Dotarem
group had a tumor and associated edema in the area
of the dentate nucleus that prevented the
from
being calculated.
The GP and DN SI ratios were calculated by both
radiologists on each patient’s first and most recent
MR exam, and the difference between the two exams
was calculated to evaluate any changes in signal
intensity in the GP and DN over time using the
following equation:
(3)
An
of zero indicates no changes in the relative
signal intensity of the target structure between the
patient’s first and last exam, while a
greater
than zero indicates signal enhancement in the
structure over the course of the patient’s care.
2.4 Data Analysis
Data analysis was conducted using Microsoft Excel.
Correlation between the two radiologist’s ROI
measurements was measured using the Lin
concordance correlation coefficient.
One-sample t tests were used to determine
whether the differences in SI ratios,
, between
the first and last MR exam for each patient group were
statistically different from zero. P < 0.05 was
considered indicative of a statistically significant
difference.
An independent-sample t test was used to
determine whether the differences between the two
patient contrast groups were statistically significant.
3 RESULTS
In comparing the radiologist’s ROI measurements,
the Lin concordance coefficient for both readers was
0.992 (95% confidence interval: 0.989, 0.994)
indicating excellent inter-observer correlation.
3.1 Recent Exam SI Ratios
Scatterplots of the
and
measured in the
most recent MR exam plotted against the total volume
of administered contrast (ml) for each patient are
shown in Figures 3 and 4.
BIOIMAGING 2020 - 7th International Conference on Bioimaging
112
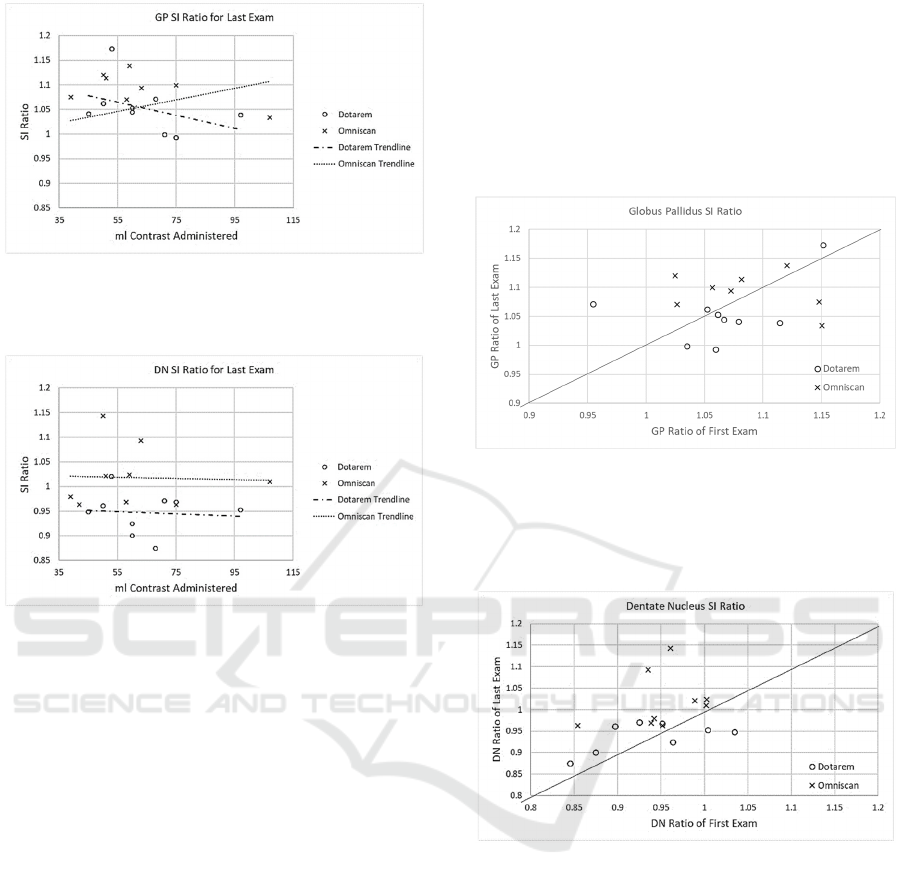
Figure 3: SI Ratio in the globus pallidus vs. administered
volume of contrast for both linear (Omniscan) and
macrocyclic (Dotarem) agents.
Figure 4: SI Ratio in the dentate nucleus vs. administered
volume of contrast agent for both linear (Omniscan) and
macrocyclic (Dotarem) agents.
Although previous publications (Kanda et al.,
2014) have shown a strong positive correlation
between administered linear contrast agent volume
and SI ratio in both the GP and DN, our study showed
no statistically significant correlation between
administered contrast volume and SI ratio for any
brain region for either contrast agent. This is likely a
result of the small sample size of our study, which
was limited in design due to the recent switch to a
macrocyclic GBCA. This limited the number of
available patients with multiple contrast-enhanced
exams, as well as the total volume of contrast
administered to those patients. As the linear agent
group was chosen to match the macrocyclic group,
those same limitations applied. It should be noted that
based on previous publications, no correlation
between SI ratio and contrast volume administered
was expected for the Dotarem group due to that
contrast agent’s tighter binding of the gadolinium ion.
3.2 Signal Intensity Ratio Changes
Plots of the measured SI ratio from the first exam
versus the last exam for both the GP and DN are
shown in Figures 5 and 6. The solid lines represents
the hypothetical case where the signal ratio from the
first and last exams were equal, indicating no change
in the SI ratio over the course of care. Data points
above the line indicate an increase in the SI ratio in
the last exam compared to the first, while data points
below the line indicate a lower SI ratio in the most
recent exam.
Figure 5: Scatterplot of GP ratio at first study versus last
study for both GBCAs. Solid line represents hypothetical
instance where the first and last scan have identical SI
ratios, indicating no increased signal due to gadolinium
retention.
Figure 6: Scatterplot of DN ratio at first study versus last
study for both GBCAs. Plots of the Omniscan group are
above the line, indicating an increase in signal in later
exams.
In both graphs, most data points are located near
the line, indicating only small changes in the SI ratio.
No statistically significant differences were found in
the GP for either contrast agent. However, in the
dentate nucleus graph, most Omniscan data points are
located above the line, indicating an increase in the SI
ratio in the last exam compared to the first. These
results were found to be statistically significant (t(8)
= 2.94, p = .019). The magnitude of the SI ratio in the
DN for several of these points aligns with values
published by Kanda et al., 2015b.
Comparison of Gadolinium Contrast Agent Retention in Patients Receiving Multiple Contrast-enhanced MRI Exams
113
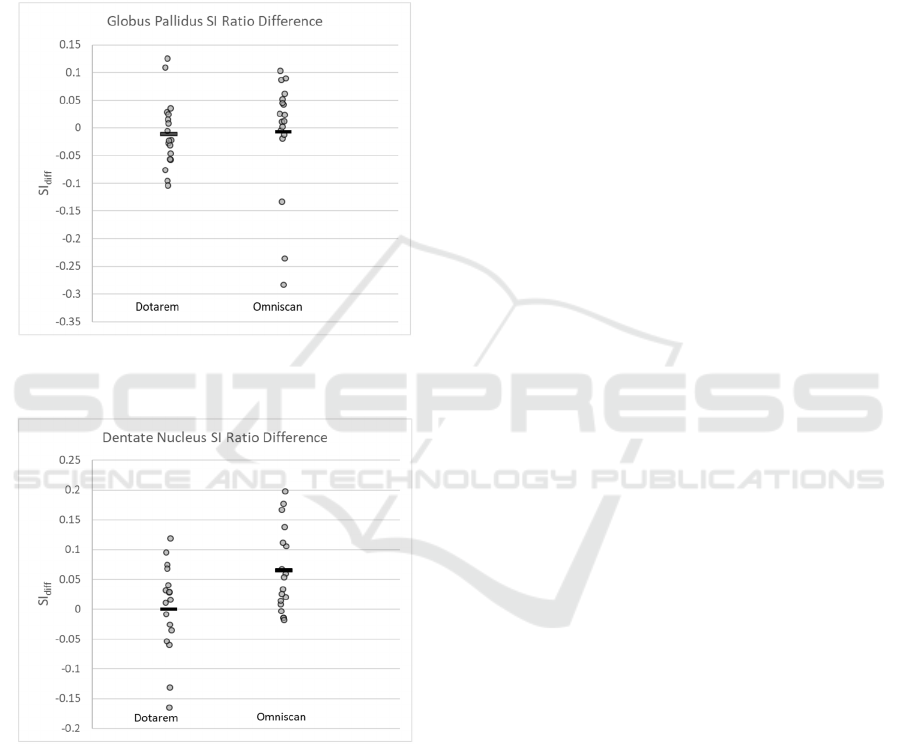
3.3 Signal Intensity Ratio Differences
The distributions of SI ratio differences,
, for
both the globus pallidus and dentate nucleus regions
in both patient groups are shown in Figures 7 and 8 as
an alternative way of displaying the information in
Figures 5 and 6. Grey dots indicate individual data
points from each radiologist and the black bar
indicates the mean of all measurements.
Figure 7: Distribution of
for each GBCA in the GP
region.
Figure 8: Distribution of
for each GBCA in the DN
region.
As in the previous graphs, no statistically
significant changes were seen in the GP region for
either patient group. In the DN, for the linear GBCA
Omniscan, the mean
of 0.065 ±0.022 between
the most recent MR exam and the first exam was
found to be significantly larger than zero. (t(8) = 2.94,
p = .019). This indicates an increase in the signal level
in the DN after serial administration of the linear
GBCA, likely due to the retention of gadolinium in
some form. In the macrocyclic, Dotarem group, the
mean
of 0.0002 ±0.018 in the DN between the
most recent MR exam and the first exam was not
found to be significantly larger than zero (t(7) =
0.014, p =.989). When comparing the
in the
DN between the two patient groups, they were found
to be statistically different from each other (t(8) = -
2.24, p = .041).
In the globus pallidus, neither the Dotarem or the
Omniscan group’s
was found to be statistically
different from zero indicating no significant change
in signal intensity between the first and last exam, and
likely no measurable deposition of gadolinium in this
brain region. In comparing the
in the GP
between the two patient groups, they were not found
to be statistically different (t(9) = -0.114, p = .911).
4 CONCLUSIONS
This study set out to compare differences in signal
enhancement in structures of the brains of patients
given serial administrations of two commercially
available gadolinium-based contrast agents in use at
our hospital. In reviewing previously obtained
clinical MRI images, a statistically significant
increase in signal was measured in the dentate
nucleus region as compared to the pons region for
patients given the linear, non-ionic agent Omniscan.
No such increase was seen in patients given the ionic,
macrocyclic agent Dotarem, nor was any measurable
signal increase seen in the globus pallidus region of
the brain for either GBCA. The magnitude of signal
increase seen in the DN was in line with that in other
published works (Kanda et al. 2015b), though it is
noted that neither radiologist noticed any obvious
visual signal increase in the images.
Our study did not show any correlation between
the magnitude of signal enhancement and the volume
of contrast administered, likely due to the previously
mentioned small sample size of the study and
relatively low volume of contrast administered,
compared to other studies. Another possible cause is
that despite medical records review, we were unable
to account for potential contrast-enhanced exams
performed outside of our hospital system.
Many questions surround the long-term retention
of gadolinium in patients with healthy renal function,
including the mechanism of deposition, exact
chemical form of retained gadolinium, and any
potential long term negative clinical impact to
patients. This study confirms the likelihood of
retained gadolinium in a patient population who were
BIOIMAGING 2020 - 7th International Conference on Bioimaging
114

administered linear contrast agents, but shows
promise of reduced retention from the newer, more
stable macrocyclic contrast agent. In the future, we
hope to repeat this study, focusing on the macrocyclic
agent, with a larger patient population and with
patients having a higher number of contrast injections
in order to further study any dose dependent
relationship to gadolinium retention.
ACKNOWLEDGEMENTS
The authors would like to thank Holly Frank and the
rest of the MRI staff for help in putting together
details for this study.
REFERENCES
Bjørnerud, A., Vatnehol, S.A.S., Larsson, C., Due-
Tønnessen, P., Hol, P.K., Groote, I.R. (2017). Signal
enhancement of the dentate nucleus at unenhanced MR
imaging after very high cumulative doses of the
macrocyclic gadolinium-based contrast agent
gadobutrol: an observational study. Radiology
285(2):434–444.
Gibby, W.A., Gibby, K.A., & Gibby, W.A. (2004).
Comparison of Gd DTPA-BMA (Omniscan) versus Gd
HP-DO3A (Prohance) retention in human bone tissue
by inductively coupled plasma atomic emission
spectroscopy. Investigational Radiology, 39(3), 138-
142.
Kanda, T., Fukusato, T., & Matsuda, M. (2015a).
Gadolinium-based contrast agent accumulates in the
brain even in subjects without severe renal dysfunction:
evaluation of autopsy brain specimens with inductively
coupled plasma mass spectroscopy. Radiology, 276(2),
228-232.
Kanda, T, Ishii, K., Kawaguchi, H., Kitajima, K., &
Takenaka, D. (2014). High signal intensity in the
dentate nucleus and globus pallidus on unenhanced T1-
weighted MR images: Relationship with increasing
cumulative dose of a gadolinium-based contrast
material. Radiology, 270(3), 834-841.
Kanda, T., Osawa, M., Oba, H., Toyoda, K., Kotoku, J.,
Haruyama, T., Takeshita, K., & Furui, S. (2015b). High
signal intensity in the dentate nucleus and globus
pallidus on unenhanced T1-weighted MR images:
Association with linear versus macrocyclic gadolinium
chelate administration. Radiology, 275(3), 803-809.
Moser, F.G., Watterson, C.T., Weiss, S., Austin, M.,
Mirocha, J., Prasad, R., Wang, J. (2018) High signal
intensity in the dentate nucleus and globus pallidus on
unenhanced T1-weighted MR images: comparison
between Gadobuterol and linear gadolinium-based
contrast agents. Am J Neuoradiol, 39, 421-426.
McDonald, R., Levine, D., Weinreb, J., Kanal, E.,
Davenport, M., Ellis, J., Jacobs, P., Lenkinski, R.,
Maravilla, K., Prince, M., Rowley, H., Tweedle, M., &
Kressel, H. (2018). Gadolinium retention: a research
roadmap from the 2018 NIH/ACR/RSNA workshop on
gadolinium chelates. Radiology, 289, 517-534.
Radbruch, A., Weberling, L.D., Kieslich, P.J., Eidel, O.,
Burth, S., Kickingereder, P., Heiland, S., Wick, W.,
Schlemmer, & H.P., Benddzus, M. (2015). Gadolinium
retention in the dentate nucleus and globus pallidus is
dependent on the class of contrast agent. Radiology,
275(3), 783-791.
Ramalho, J., Semelka, R.C., Ramalho, M., Nunes, R.H.,
AlObaidy, M., & Castillo, M. (2016). Gadolnium-based
contrast agent accumulation and toxicity: an update.
American Jounral of Neuroradiology, 37(7), 1192-
1198.
Splendiani, A., Corridore, A., Torlone, S., Matrino, M.,
Barile, A., Di Cesare, E., Masciocchi, C. (2019).
Visibile T1-hyperintensity of the dentate nucleus after
multiple administrations of macrocyclic gadolinium-
based contrast agents: yes or no? Insights into Imaging,
10:82.
White, G.B., Gibby, W.A., & Tweedle, M.F. (2006).
Comparison of Gd(DTPA-BMA) (Omniscan) versus
Gd(HP-DO3A) (ProHance) relative to gadolinium
retention in human bone tissue by inductively coupled
plasma atomic emission spectroscopy. Investigational
Radiology, 41(3) 272-278.
Comparison of Gadolinium Contrast Agent Retention in Patients Receiving Multiple Contrast-enhanced MRI Exams
115
