AI 3D Printing Process Parameters Optimization
Park Hong Seok
a
and Nguyen Dinh Son
b
Department of Mechanical and Aerospace, University of Ulsan, 93-Daehak-ro, Ulsan, South Korea
Keywords: Artificial Neural Network, Selective Laser Melting, Ti-6Al-4V, Optimization.
Abstract: Optimization parameters of Selective Laser Melting (SLM) process is a significant question currently. Due to
attractive advantages, namely high density of printed products and freely design, the SLM has been
increasingly applied in industrial manufacturing. However, not only various influenced factors but also their
range affects to the printing process. Therefore, it is difficult and requires much testing time and cost to select
a suitable process parameter for manufacturing a desirable product. In this article, a supervised learning
Artificial Neural Network was applied to build an optimization system for finding out optimal process
parameters. Inputs of the system are desirable properties of a product as relative density ratio while outputs
are the crucial parameters as laser power, laser velocity, hatch distance, and layer thickness. The developed
system is a powerful contribution to industrial SLM manufacturing. By applying the system, it requires less
pre-manufacturing expenditure and also helps the printing users to choose approximately process parameters
for printing out a desirable product.
1 INTRODUCTION
Selective laser melting (SLM) powder bed fabrication
is additive manufacturing (AM) that starting from
metal powder, allows achieving desirable density
products layer-by-layer. Each layer anchors to the
previous one as the result of a complete fusion of
metal powder obtained by a laser beam. The laser spot
moves along a scanning pattern generated and
controlled by a CAD model of the part to be built. The
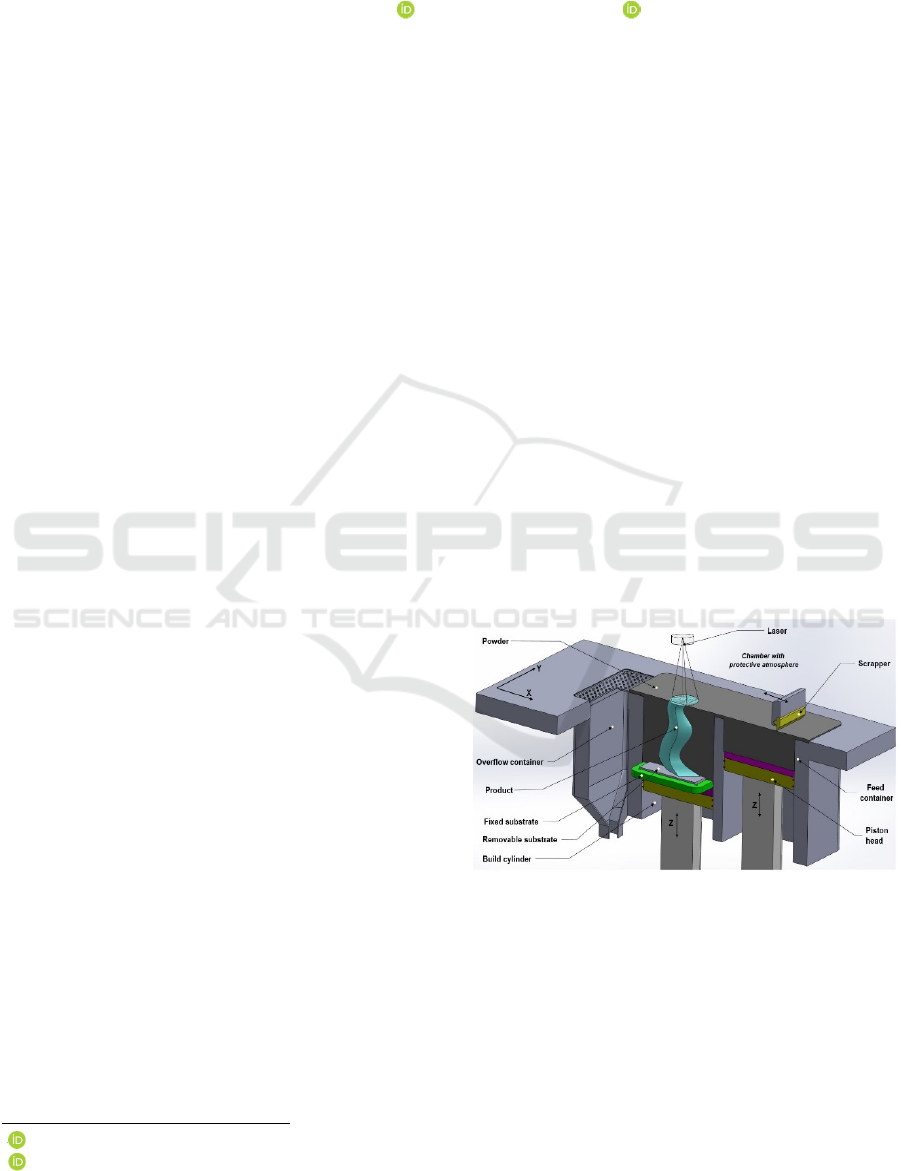
schematics representation of typical powder-bed
fusion system explained in Figure 1. The strength of
the SLM process is possible to create any possible
geometry (Srivatsan and Sudarshan, 2015a).
Therefore, the SLM is attractive to the aerospace,
automotive and other industries for present and
future.
Due to its excellent mechanical properties such as
good stability, good corrosion resistance, and high
specific strength, the titanium alloy Ti-6Al-4V is
widely used in many industries (Alcisto et al., 2011).
However, its high cost and challenging machinability
somewhat restrict its use in conventional
manufacturing methods, namely forging and casting
(Tan et al., 2018). Nevertheless, the use of Ti-6Al-4V
a
https://orcid.org/0000-0002-8382-4843
b
https://orcid.org/0000-0001-7509-3422
in SLM offers the benefits of recycling the
unprocessed metal powder, geometrical freedom in
product design, and time and energy efficiencies
(Kruth et al., 2005).
Figure 1: A schematic of a Selective Laser Melting method.
Although an attracting manufacturing method for
the aerospace, automotive and other technological
industries, printing a desirable product is complicated
because of many affected factors and their wide range
that significantly impacts on the mechanical
properties of the printed product. Many papers have
tried to optimize the SLM process. It is evident in all
356
Seok, P. and Son, N.
AI 3D Printing Process Parameters Optimization.
DOI: 10.5220/0008903303560361
In Proceedings of the 12th International Conference on Agents and Artificial Intelligence (ICAART 2020) - Volume 2, pages 356-361
ISBN: 978-989-758-395-7; ISSN: 2184-433X
Copyright
c
2022 by SCITEPRESS – Science and Technology Publications, Lda. All rights reserved
these methods that investigating process parameters
independently is incorrect because the printed
product quality is a function of the relationship
between several crucial process parameters.
Therefore, determining the optimal process
parameters by applying an artificial neural network to
print a desirable density product is the goal of this
research.
Artificial neural networks (ANNs) motivated by
modeling of human brains and nerve cells are
currently considered as one of the neuro-modeling
techniques used in associate with robust optimization.
Using artificial neural networks to optimize
engineering problems has been a great application,
such a welding process (Sivagurumanikandan et al.,
2018). In SLM, there were some research analysed
applying ANNs but individual process parameters
(Mertens et al., 2014)(Kempen et al., 2011). In this
article, four crucial process parameters as laser
power, laser scanning speed, hatch distance and layer
thickness are optimized to get a desirable density of
the manufactured product.
2 METHODOLOGY
The material selected for this study was the titanium-
alloy Ti-6Al-4V ELI, Grade 23 (SLM Solutions
Group AG, Germany), supplied in powder form with
an average particle size of about 20-63μm. An SLM
printer (MetalSys150; WinforSys Co., Ltd., Korea)
with an IPG ytterbium fiber laser, (YLR-200-AC-
Y11; IPG Photonics) 200W maximum output, air-
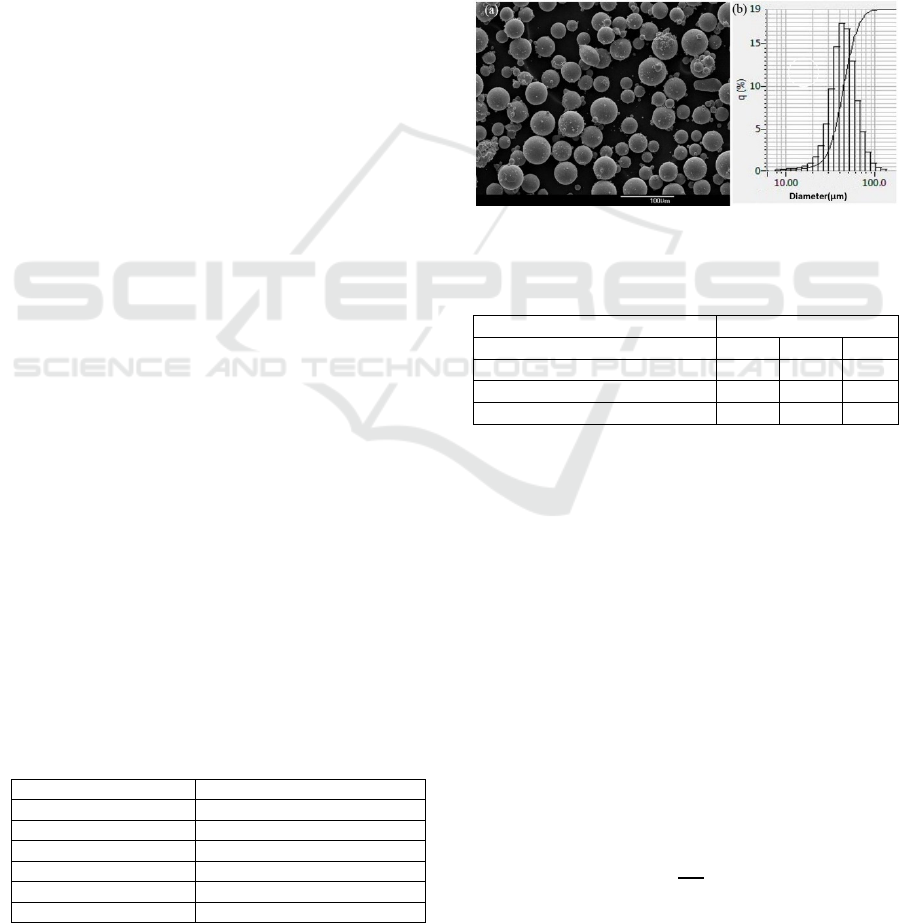
cooled, was used to process the powder. Scanning
electron microscope (SEM) image of powder material
and particle size distribution were shown in Figure 2a
and 2b, respectively. An SLM machine (MetalSys150,
Winforsys co., Ltd) with the YLR-200-AC-Y11, IPG
Ytterbium Fiber Laser, 200W maximum output, air-
cooled, was used to process. Table 1 shows the
technical parameters of the SLM printer. The printing
process used the meander laser scanning strategy in
which the laser scan direction in n
th
layer is
perpendicular to that of the n+1
th
layer, which is the
same as the n-1
th
layer.
Table 1: Technical parameters of the MetalSys150.
Item Value
Wavelength 1,075nm
Output power 200W max
Beam quality M2,1.1
Beam spot 70µm
Building size 150×150×250mm3
Max scanning 7 m/s max
Argon gas was filled into the chamber to maintain
oxygen degree at below 0.5 percent. The chamber
temperature was at 28
0
C. The process parameters for
experiments are shown in Table 2. Parameters were in
the range of settings recommended by the machine
manufacturers. After printing, SLM processed parts
were tested. A GR-200 analytical balance (A&D
Company, Ltd., Tokyo, Japan) was combined with the
AD-1653 density determination kit to measure the
density of the printed parts based on the Archimedes’
principle. The density of the samples is obtained
according to the weight of the sample in the air, the
weight of the sample in liquid, the distilled water (DI
water) and the density of the liquid.
Figure 2: SEM image (a) and particle size distribution (b)
of the used material powder.
Table 2: SLM process parameters used for experiments.
Factor
Level
Laser power (W) 80 120 180
Laser scanning speed(mm/s) 800 1200 2500
Layer thickness(µm) 20 50 100
Hatch distance(µm) 35 50 90
2.1 Neural Network Parameters
A feedforward ANN includes four input nodes as four
process parameters, while output was the density of
the printed part. Two hidden layers (Rojas, 1996)
with ten, eight nodes (L. Fletcher ; V. Katkovnik ;
F.E. Steffens ; A.P. Engelbrecht, 1998) in first,
second hidden layer respectively with a full
connection.
2.1.1 Data Processing
Significant differences in the values of four
investigated process parameters as the inputs and
product quality as the output leads complicate the
learning process of the neural network. For solving
this potential problem, all input and output were
previously scaled by using a standardization:
=
(1)
With mean:
AI 3D Printing Process Parameters Optimization
357

μ=
∑(
)
(2)
and standard deviation:
=
∑(
−μ
)
(3)
2.1.2 Neural Network Architecture
The number of neurons in the input layer is equal to
the number of the investigating parameter. The
quantity of hidden layer usually is set between the
size of the input and size of the output. Selecting the
number of neurons in the hidden layers is very
important. One hand, using too few neurons in hidden
layer will result the underfitting. On the other hand,
too many of them can result in overfitting. There are
many methods for determining a suitable number of
hidden nodes. In this research, two hidden layers were
applied and the number of hidden node was
calculated by the following:
=
(
)
(4)
Ni: number of input neurons
N
O
: number of output neurons
N
S
: number of samples in training data set
: an arbitrary scaling factor usually 2-10
2.1.3 K-fold Cross-validation
For training the model, the dataset is usually split into
training data and test data. The training dataset
includes a known output, and the model learns on this
data to be described to other coming data. The test
dataset is used to test the prediction of the model.
However, splitting data that is required to reflect the
essential characteristics of the problem is not easy.
Additionally, by partitioning the available data
into other sets, the data will significantly decrease the
number of samples which can be used for learning the
model, and the results can depend on a particular
random selection for the pair of sets. Therefore, in this
article, the k-fold cross-validation is applied to solve
the mentioned problems. In k-fold cross-validation,
the original sample is randomly partitioned into k
equal sized subsamples. Of the k subsets, a single
subsample is retained as the validation data for testing
the model, and the remaining k-1 subsamples are used
as training data. The cross-validation process is then
repeated k times (the folds), with each of the k
subsamples used exactly once as the validation data.
The k results from the folds can then be averaged to
produce a single estimation (James et al., 2013). The
advantage of this method is that all observations are
applied for both training and validation, and each
observation is used for validation exactly once. In this
article, the 10- fold was selected
2.1.4 Activation Function
The rectified linear unit (ReLU),
(
)
=max
(
0,
)
,
was used when going from one layer to the next as an
active function (Glorot et al., 2011). It is the most
popular non-linear function recently because it learns
much faster in networks with many layers, typically
comparing the others (LeCun et al., 2015).
Nevertheless, the sigmoid function, f(z) = 1/(1+ exp(-
z)), was used as the active function for the output
layer because of real-valued output.
2.1.5 Neural Network Validation
The ANN was trained by minimizing the mean square
error as a loss function with the Adam Optimizer
algorithms (Kingma and Ba, 2017). The loss function
was the mean absolute error and calculated as:
(
,
)
=
∑
(5)
Where and y, N, w, b are predicted value of the
model, experimental output, total of samples, weight,
and bias of the neural, respectively.
2.1.6 Neural Network Optimization
The Gradient Descent method (Kingma and Ba,
2017) was applied to minimize the loss function by
changing the values of the and parameters as the
following equation:
=
−
(
)
(6)
In which:
: is a neuron network parameter
(
)
: is the derivation of the loss function at a
point at the
loop.
: learning rate, 0.05.
2.1.7 Dropout
Overfitting is a problem that often happened in
machine learning. It is a phenomenon that model is
too fit the training data, and it will fit the noise in the
data rather than finding a general predictive rule
(Tušar et al., 2017). A signal to recognize the
overfitting is that training error is small while the
testing error is high. For preventing overfitting, the
dropout methods were used. Dropout means shutting
down units in a neural network (Srivastava et al.
2014) (Dahl et al., 2013) (de Rosa et al., 2018). It
temporarily deactivates it from the network. The
selection of ignored units is random. Each unit has
remained with a fixed probability independent of
another one. In this research, the probability of
retaining a unit in the network was 0.8. After training,
at the testing set, the network is used without dropout
ICAART 2020 - 12th International Conference on Agents and Artificial Intelligence
358
in which the weights and biases are scaled as
()
=
()
.
2.2 Optimization System Algorithm
The Generated Data was created by integrating from
four the investigated process parameters, as shown in
Table 2. Laser power changes from 80W to 180W
with 5W variation. Laser scanning velocity values
change between 800mm/s to 2500mm/s with
100mm/s variation. Layer thickness and hatch
distance change from 20µm to 100µm and 35µm to
90µm respectively with 5µm variation.
Table 3: Combination of Generated data for predicting.
Factor Min
value
Max
Value
Deviation
Laser Power (W) 80 180 5
Laser scanning speed
(mm/s)
800 2500 100
Layer thickness (µm) 20 80 5
Hatch distance (µm) 30 100 5
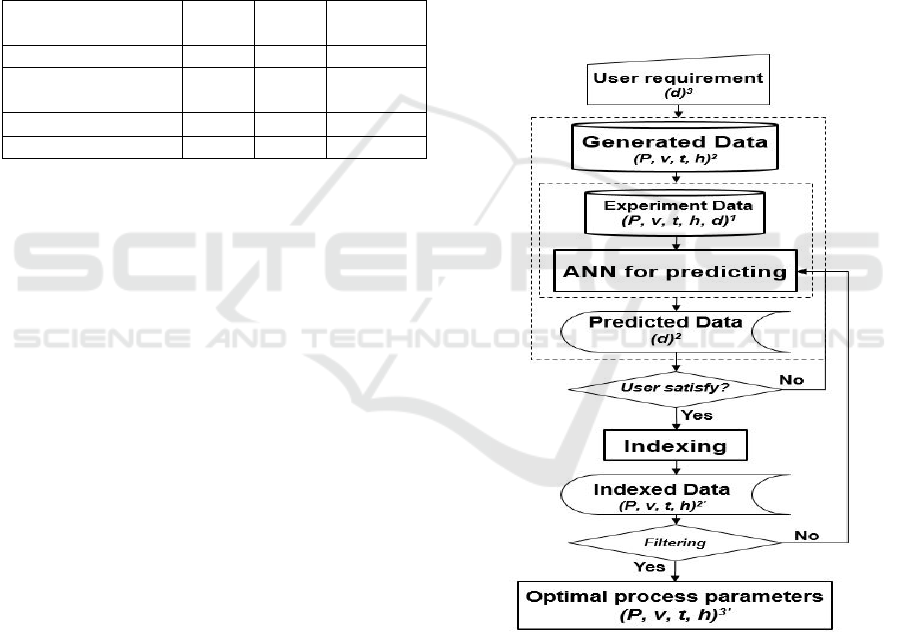
The optimization algorithm is shown in Figure 3
and the following:
1. At the first time, develop an ANN
2. Predicting density ratios from the Generated Data
that was created by combining levels of four
process parameters. Laser power changes from
80W to 180W with 5W variation. Laser scanning
velocity values change between 800mm/s to
2500mm/s with 100mm/s variation while layer
thickness and hatch distance change from 20µm to
80µm and 30µm to 100µm respectively with 5µm
difference as shown in Table 3.
3. Input a required density ratio of the user that is
limited from 75 to 100, in the scope of this paper.
4. Predicted data as the density ratio from the ANN
was compared with user requirements.
5. Then process parameters in the Generated Data of
which predicted data fit with user needs are
indexed.
6. The indexed data were filtered by maximizing the
value of the productivity, calculated by:
=.ℎ.
to point out the optimal parameters. It is a
relationship of layer thickness (t), laser scan speed
(v), and hatch distance (h).
In this research, ANN implementation, training and
the optimization system were developed using the
Python programming language, in which the
TensorFlow library (Abadi et al. 2016) was
applied.
3 RESULTS AND DISCUSSIONS
3.1 Process Parameters and Printed
Part Qualities Relationship
Figure 4 indicates the relationship between individual
four process parameters and the density of the
manufactured part. Figure 4a shows the influence of
laser power on density at 1400mm/s of laser speed
and 40µm of hatch distance. Increasing laser power
increased the relative density because of sufficient
powder molten. Moreover, Figure 4a illustrates the
effect of layer thickness. The blue, green, red and
black lines present the influence of laser power at
20µm, 40µm, 60µm, and 80µm of layer thickness
respectively. It is precise that increasing layer
thickness reduces the density ratio.
Figure 3: Algorithms for optimization system.
At a specific laser power, a thicker layer material
powder will less be moult. Figure 4b presents the
effect of laser scanning speed at different hatch
distances. It shows a severe incline during increasing
laser speed. High scanning speed of laser reduces
interaction time of laser spot on material that
generates lower densities because of incomplete
melting of powder (Cherry et al., 2014). Additionally,
AI 3D Printing Process Parameters Optimization
359
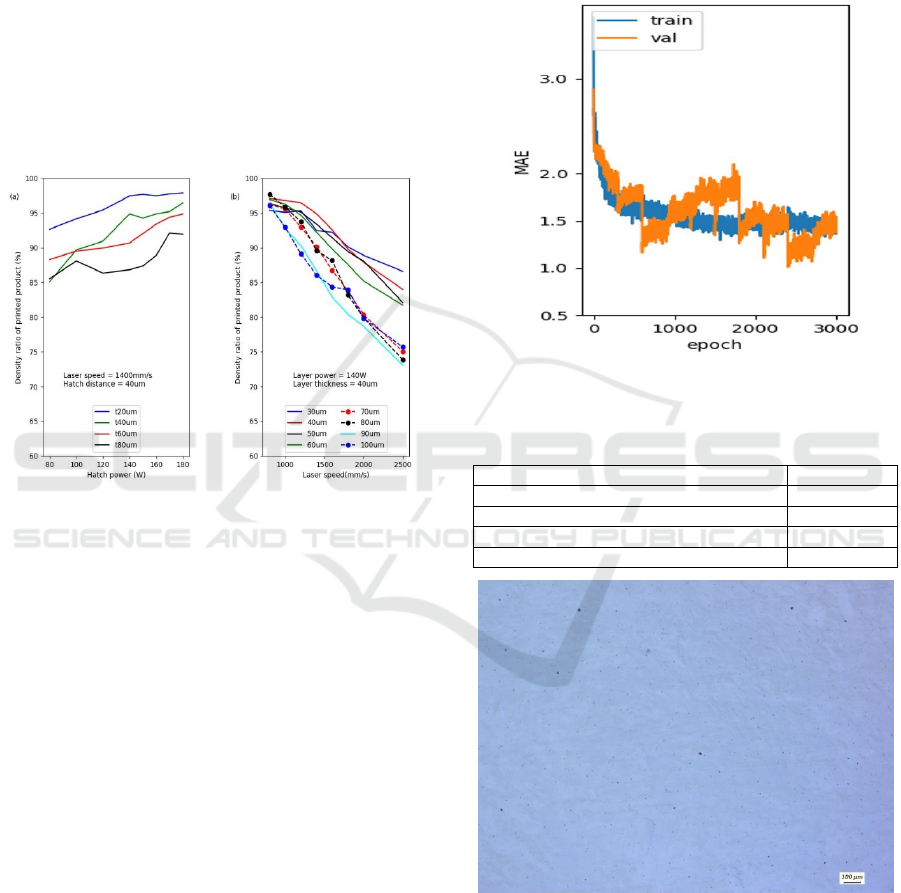
the effect of hatch spaces on density illuminates in
Figure 4b. The hatch distance relates to the
overlapping area of two adjacent melting lines.
Reducing the hatch distance leads over-burning and
vaporization within the melting pool. However,
insufficient material moulted due to a large hatch
distance generated low relative densities. A smaller
hatch distance often increases density ratio. However,
a combination of low speed of laser scanning velocity
and too small hatch space leads balling phenomenon
and vaporization of material that was significantly
affected by density (Khan and Dickens, 2012). It
explains for a lower density of blue line at 800mm/s
compared to others.
Figure 4: Relationship of individual process parameters and
product properties.
3.2 Neural Network Evaluation
In order to validate the developed ANN, the mean
absolute error (MAE) of the training and testing
process is shown in Figure 5. The dark blue line and
the orange line present the training and validation of
the network. They converge after 3000 epochs. The
result elucidates that the network prevents overfitting
problem. Additionally, the results show that the
maximum error percentage is 1.5% approximately,
which is an acceptable value. Therefore, the
developed ANN is valid for predicting.
3.3 Optimization System Verification
99 percentage of density ratio was used as a request
of the user to verify the developed system. Table 4
shows the parameters given by the system. Using the
optimal process parameters suggested form the
system, a product was printed one more time to
confirm the performance of the system. By applying
the Archimedes principle, the result indicates 99,8
percentage of relative density. The part was mounted
by hot pressing, polished and examined for porosity.
Figure 6 shows a cross-section of the part.
Additionally, the optimal parameters confirm a
similar result by the response surface methodology
(RSM)- based method
(Li et al., 2018). It proved the
success of the developed optimization system for SLM
printing.
Figure 5: Mean absolute error of training and testing
processes of ANN.
Table 4: Optimal process parameter set.
Parameter Value
Layer thickness, t, (µm) 20
Hatch distance, h, (µm) 80
Laser power, P, (W) 180
Laser scanning speed, v,(mm/s) 900
Figure 6: A cross-section of a product manufactured by the
optimal process parameters set.
4 CONCLUSIONS
In this article, a system combining an ANN for
optimizing process parameters to fabricate a desirable
ICAART 2020 - 12th International Conference on Agents and Artificial Intelligence
360

product was developed. A supervised neural network
was built for predicting a generated data set. Training
and testing data set of the ANN were collected from
the experiment. The gradient descent method was
applied to minimize the loss function. The dropout
technique and k-fold validate were used to prevent the
overfitting problem. After building the network, a
user requirement was compared with predicted data.
Process parameters of which predicted values
satisfied with user needs were indexed from the
generated data set. In order to achieve the optimal
process parameters, productivity was added as
filtering conditions finally. In the future, the system
will be implemented, and training data will more be
collected to achieve more accurate results.
ACKNOWLEDGEMENTS
This work was supported by the Development of PBF
3D printing analysis SW Technology for
manufacturing simulation of metal parts in power
generation or shipbuilding project.
REFERENCES
Abadi, M., Barham, P., Chen, J., Chen, Z., Davis, A., Dean,
J., et al. (2016). TensorFlow: A System for Large-Scale
Machine Learning. In 12th USENIX Symposium on
Operating Systems Design and Implementation (OSDI
’16).
Alcisto, J., Enriquez, A., Garcia, H., Hinkson, S., Steelman,
T., Silverman, E., et al. (2011). Tensile properties and
microstructures of laser-formed Ti-6Al-4V. Journal of
Materials Engineering and Performance. SPRINGER.
Cherry, J. A., Davies, H. M., Mehmood, S., Lavery, N. P.,
Brown, S. G. R., & Sienz, J. (2014). Investigation into
the effect of process parameters on microstructural and
physical properties of 316L stainless steel parts by
selective laser melting. International Journal of
Advanced Manufacturing Technology. SPRINGER.
Dahl, G. E., Sainath, T. N., & Hinton, G. E. (2013).
Improving deep neural networks for LVCSR using
rectified linear units and dropout. In ICASSP, IEEE
International Conference on Acoustics, Speech and
Signal Processing - Proceedings. IEEE.
de Rosa, G. H., Papa, J. P., & Yang, X. S. (2018). Handling
dropout probability estimation in convolution neural
networks using meta-heuristics. Soft Computing.
ELSEVIER
Glorot, X., Bordes, A., & Bengio, Y. (2011). Deep sparse
rectifier neural networks. AISTATS ’11: Proceedings of
the 14th International Conference on Artificial
Intelligence and Statistics.
James, G., Witten, D., Hastie, T., & Tibshirani, R. (2013).
An Introduction to Statistical Learning (Vol. 103).
Springer-Verlag New York.
Kempen, K., Thijs, L., Yasa, E., Badrossamay, M.,
Verheecke, W., & Kruth, J. P. (2011). Process
optimization and microstructural analysis for selective
laser melting of AlSi10Mg. 22nd Annual International
Solid Freeform Fabrication Symposium - An Additive
Manufacturing Conference, SFF 2011.
Khan, M., & Dickens, P. (2012). Selective laser melting
(SLM) of gold (Au). Rapid Prototyping Journal.
Kingma, D. P., & Ba, J. L. (2017). Adam: a Method for
Stochastic Optimization. International Conference on
Learning Representations 2015.
Kruth, J., Vandenbroucke, B., Vaerenbergh, J., & Mercelis,
P. (2005). Benchmarking of different SLS/SLM
processes as rapid manufacturing techniques. In Int.
Conf. Polymers & Moulds Innovations (PMI), Gent,
Belgium.
L. Fletcher ; V. Katkovnik ; F.E. Steffens ; A.P.
Engelbrecht. (1998). Optimizing the Number of Hidden
Nodes of a Feedforward Artificial Neural Network. In
IEEE International Conference on Neural Networks
Proceedings.
LeCun, Y. A., Bengio, Y., & Hinton, G. E. (2015). Deep
learning. Nature.
Li, Z., Kucukkoc, I., Zhang, D. Z., & Liu, F. (2018).
Optimising the process parameters of selective laser
melting for the fabrication of Ti6Al4V alloy. Rapid
Prototyping Journal. EMERALD INSIGHT
Mertens, R., Clijsters, S., Kempen, K., & Kruth, J.-P.
(2014). Optimization of Scan Strategies in Selective
Laser Melting of Aluminum Parts With Downfacing
Areas. Journal of Manufacturing Science and
Engineering. ASME
Rojas, R. (1996). Neural Networks. Neural Networks: A
Systematic Introduction (Vol. 7). Springer-Verlag.
Sivagurumanikandan, N., Saravanan, S., Kumar, G. S.,
Raju, S., & Raghukandan, K. (2018). Prediction and
optimization of process parameters to enhance the
tensile strength of Nd: YAG laser welded super duplex
stainless steel. Optik. ELSEVIER.
Srivastava, N., Hinton, G., Krizhevsky, A., Sutskever, I., &
Salakhutdinov, R. (2014). Dropout: A Simple Way to
Prevent Neural Networks from Overfitting. Journal of
Machine Learning Research.
Srivatsan, T. S., & Sudarshan, T. S. (2015a). Additive
Manufacturing: Innovations, Advances, and
Applications. CRC Press, London.
Tan, F. B., Song, J. L., Wang, C., Fan, Y. B., & Dai, H. W.
(2018). Titanium clasp fabricated by selective laser
melting, CNC milling, and conventional casting: a
comparative in vitro in vitro study. Journal of
Prosthodontic Research. ELSIVIER
Tušar, T., Gantar, K., Koblar, V., Ženko, B., & Filipič, B.
(2017). A study of overfitting in optimization of a
manufacturing quality control procedure. Applied Soft
Computing Journal. ELSIVIER.
AI 3D Printing Process Parameters Optimization
361
