
An Audio-Visual based Feature Level Fusion Approach Applied to
Deception Detection
∗
Safa Chebbi and Sofia Ben Jebara
University of Carthage, SUP’COM, LR11TIC01 COSIM Research Lab, 2083, Ariana, Tunisia
Keywords:
Deception Behavior Detection, Feature Level Fusion, Feature Selection Techniques, Mutual Information.
Abstract:
Due to the increasing requirement of security and antiterrorism issues, research activities in the field of de-
ception detection have been receiving a big attention. For this reason, many studies dealing with deception
detection have been developed varying in terms of approaches, modalities, features and learning algorithms.
Despite the wide range of proposed approaches in this task, there is no universal and effective system until to-
day capable of identifying deception with a high recognition rate. In this paper, a feature level fusion approach,
combining audio and video modalities, has been proposed to build an automated system that can help in deci-
sion making of honesty or lie. Thus a high feature vector size, combining verbal features (72 pitch-based ones)
and nonverbal ones related to facial expressions and body gestures, is extracted. Then, a feature level fusion
is applied in order to select the most relevant ones. A special interest is given to mutual information-based
criteria that are well adapted to continuous and binary features combination. Simulation results on a realistic
database of suspicious persons interrogation achieved 97% as deception/truth classification accuracy using 19
audio/video mixed features, which outperforms the state-of-the-art results.
1 INTRODUCTION
Deception is a complicated psychological human con-
duct related to cognitive processes and mental activity
(DePaulo et al., 2003). It is identified as an attempt to
cheat others trying to cover up their deception with
some body language and some way of talking and be-
having. Due to its applicability in different contexts,
research activities for deception detection have been
receiving an increasing amount of attention in differ-
ent fields of life such as crime investigation, national
security, law enforcement, forums and online dating
websites (Granhag and Str
¨
omwall, 2004) (Hartwig
et al., 2006) (Toma and Hancock, 2010).
Thus, several approaches have been proposed in
this task varying in terms of modalities, features and
learning methods. In principle, three modalities have
been used for deception detection: linguistic, acoustic
and visual. Linguistic modality is related to speech
content analysis and many features have been ex-
plored such as words frequency, syntactic complexity,
∗
This work has been carried out as part of a federated
research project entitled: Sensitive Supervision of Sensitive
Multi-sensor Sites, supported by the Research and Studies
Telecommunications Centre (CERT), funded by the Min-
istry of Higher Education and Scientific Research, Tunisia.
semantic lexicons, speech hesitations and speech rate
(Bowman et al., 2013) (Zhou et al., 2004).
According to acoustic modality, several features
have been investigated to discriminate between de-
ceivers and truth-tellers. We relate for example
prosodic features modeling the accent, rhythm and the
intonation of the voice, voice quality features, spec-
tral as well as perceptual features (Kirchh
¨
ubel and
Howard, 2013) (Levitan et al., 2016). Other stud-
ies have incorporated visual modality related to ges-
tures and body language such as facial expressions,
hand movements, head orientation and trajectory and
body movement (Ekman and Friesen, 1969) (Vrij and
Semin, 1996).
More recent studies aim to improve the insights
obtained from single modalities by combining multi-
ple ones together. We relate for example the fusion of
speech content with facial displays and body gestures
(De Silva and Ng, 2000), other facial movements
fused with acoustic and lexical features (Jaiswal et al.,
2016) as well as micro- with squelched expressions
have been analyzed to extract cues associated with an
act of deception (Ekman, 2009). We recall that, when
dealing with fusion of multiple signals, it is possible
to merge at different levels (Sharma et al., 2002): sig-
nal level, feature level and decision level. Signal level
Chebbi, S. and Ben Jebara, S.
An Audio-Visual based Feature Level Fusion Approach Applied to Deception Detection.
DOI: 10.5220/0008896201970205
In Proceedings of the 15th International Joint Conference on Computer Vision, Imaging and Computer Graphics Theory and Applications (VISIGRAPP 2020) - Volume 4: VISAPP, pages
197-205
ISBN: 978-989-758-402-2; ISSN: 2184-4321
Copyright
c
2022 by SCITEPRESS – Science and Technology Publications, Lda. All rights reserved
197

fusion is the lowest level of multimodal fusion as it
is performed directly on the raw data. Feature-level
fusion merges features of different sources and puts
them at the input of the classifier and decision level
fusion which considers separate classifiers for each
source and the outputs are then combined.
In this paper, we attempt to build an automated de-
ception detection system by analyzing speech modal-
ity and behavioral cues. To this end, a real-life
database dealing with deceptive and truthful videos
has been used. First, each modality has been studied
separately and related features have been extracted.
Dealing with speech modality, a set of 72 pitch-based
ones has been considered and according to nonver-
bal modality, 39 features related to facial expressions,
head and hand movements and body gestures have
been investigated. Then, speech and nonverbal fea-
tures have been combined together using a feature
level fusion module. The latter includes a relevant
feature selection module. Note that feature selection
methods can be categorized in the literature as wrap-
per and filter methods (Jimenez et al., 1998a). In this
work, different techniques from the two categories
have been investigated in order to identify the most
descriptive feature subset. A special interest is given
to mutual information-based criteria for relevant fea-
tures selection which is well adapted to continuous
and binary features combination (Hall, 1999a).
This paper is organized as follows. Section 2 pro-
vides a list of related works in deception detection.
An overview of the proposed bimodal deception sys-
tem is presented in section 3. Different steps includ-
ing feature extraction, fusion process and classifica-
tion are explained in details. Section 4 discusses ex-
perimental results for deception classification and a
comparison with other studies in the literature. Fi-
nally, we conclude the paper and discuss future work
in Section 5.
2 RELATED WORK
Research activities in the field of deception detec-
tion are globally classified into contact and non-
contact approaches. Contact methods are based on the
measurement of physiological indicators while non-
contact ones include other modalities issued from the
human body such as linguistic, acoustic and visual
modalities.
Physiological approaches are the earliest systems
used for deception detection which rely on the poly-
graph test. The polygraph test is associated with
the measurement of physiological responses (such as
blood pressure, heart and respiration rates, muscles
tremor. . . ) while the interviewed person is answer-
ing questions elaborated under Control Question Test,
Guilty Knowledge Test or others (Ben-Shakhar, 2002)
(Vrij et al., 2000). Several studies have been con-
ducted in this task and have proved that polygraph
tests are not sufficiently reliable for deception detec-
tion as they can be easily biased and disturbed us-
ing countermeasures such as medication and train-
ing (Gannon et al., 2009) (Maschke and Scalabrini,
2005). As a consequence of the problems associ-
ated with the polygraph test, deception detection re-
search shifted towards non-contact methods as they
can be applied unobtrusively without the subject’s
cooperation. These approaches deal with linguistic,
acoustic and visual modalities issued from the hu-
man body and have proved their effectiveness reach-
ing high recognition rates (Kleinberg et al., 2019)
(George et al., 2019).
According to the visual modality, several works
have been developed based on body language cues
including facial expressions and gestures (Owayjan
et al., 2012) (Kawulok et al., 2016). Facial expres-
sions have been investigated first based on Ekman’s
psychology research which assumes that some facial
expressions are involuntary and may serve as evi-
dence for deception detection (Ekman, 2009). Many
automatic deception detection systems based on fa-
cial expressions have been proposed using features
related to eyebrows, eyes, gaze, mouth, lips, face ori-
entation, etc. In addition to facial expressions, ges-
tures were also used to detect deceit by extracting the
hand movements (Lu et al., 2005), or exploring geo-
metric features related to the hand and head dynamics
(Meservy et al., 2005). Authors in (Caso et al., 2006)
proposed several hand gestures that can be related to
the act of deception using data from simulated inter-
views.
Other researches focused on the relation between
speech and deceit to reveal clues of deceptive be-
havior by studying acoustic and linguistic modali-
ties. Linguistic modality consists in analyzing the text
elaborated by the subject. Different strategies for text
analysis have been proposed such as Reality Monitor-
ing (RM), Criteria-Based Content Analysis (CBCA)
and Verbal Immediacy (VI). Acoustic-based decep-
tion researches focused on identifying the correlation
between deception and acoustic information included
in speech such as the pitch, the accent, the rhythm,
the intonation, the melody, the energy ...etc (Sondhi
et al., 2016) (Levitan et al., 2018) (Hirschberg et al.,
2005).
Recently, approaches combining different modal-
ities for improved deception detection have been sug-
gested. For instance, authors in (Jensen et al., 2010)
VISAPP 2020 - 15th International Conference on Computer Vision Theory and Applications
198

integrated visual, acoustic, verbal features such as
head and hands position, pitch variety, and self-
references using a multimodal approach for improved
recognition of deceit. Authors in (Krishnamurthy
et al., 2018) considered a combination of textual,
acoustic and visual features to detect deception.
One of the most challenging issues in automated
deception detection is the availability of real-life
databases. Indeed, most of the existing deception
datasets are based on acted data where subjects are
asked to simulate deceptive and truthful behaviors
(Mihalcea and Strapparava, 2009). Recently, the au-
thors in (P
´
erez-Rosas et al., 2015a) developed a real-
life deception dataset consisting of videos collected
from public court trials including both verbal and non-
verbal information. Using the latter corpus, a decep-
tion classification accuracy of 75% has been obtained
based on visual and textual modalities using Decision
Tree and Random Forest algorithms. The authors in
(P
´
erez-Rosas et al., 2015b) extended the work pro-
posed in (P
´
erez-Rosas et al., 2015a) by using Support
Vector Machine (SVM) and showed up to 82% de-
ception detection accuracy. Using the same database,
the authors in (Gogate et al., 2017) proposed a mul-
timodal approach for deception detection based on
the combination of audio, visual and textual modal-
ities. They revealed 96% as a deception detection ac-
curacy using the deep convolutional neural network
algorithm.
By the use of the latter real-life database men-
tioned above, the adopted approach in this work con-
sists in conceiving a deception detection system by
combining verbal and non-verbal modalities in a fea-
ture level fusion. The main contribution in this work
is the use of a feature selection module retaining
only relevant features discriminating between decep-
tion and truth. Note that feature selection methods
can be categorized in the literature as wrapper and fil-
ter methods (Jimenez et al., 1998a). Wrapper meth-
ods are classifier-dependent. Indeed, they tend to find
the features’ subset maximizing the classification per-
formance by adopting a specific research approach.
However, filter methods are classifier-independent.
They are based on a specific criterion in order to rank
features according to their relevance in discriminat-
ing between the considered classes. In this work, dif-
ferent techniques from the two categories have been
investigated in order to identify the most descriptive
feature subset. A special interest is given to mutual
information-based criteria for relevant features selec-
tion which is well adapted to continuous and binary
features combination (Hall, 1999b).
3 BIMODAL DECEPTION
DETECTION APPROACH
As depicted in Fig. 1, the proposed bimodal decep-
tion detection approach consists of 3 steps: feature
extraction, feature fusion and selection and deception
detection.
3.1 Feature Extraction
The input source here are videos, where a person is
making truthful or deceptive statements. The first step
is to extract each modality separately then picking up
the considered acoustic as well as behavioral features
independently.
3.1.1 Acoustic Features
We use here the pitch, related to vocal-folds vibra-
tion periodicity, as the acoustic feature of interest.
The pitch has been widely used for automatic speech
analysis tasks for over 30 years (Ververidis et al.,
2004). Moreover, the deceivers’ pitch voice is char-
acterized by a higher range compared to truth-tellers
one which can be explained by the arousal invading
humans when lying (Ekman et al., 1976). Therefore,
we focused on investigating different pitch-based fea-
tures instead of considering many feature families.
For each sequence, the pitch values are calculated
frame by frame using the ’fxrapt’ function provided
in the ’voicebox’ tool. The ’fxrapt’ function is based
on the robust algorithm for pitch tracking ’RAPT’
(Talkin, 1995). After extracting the pitch values, a
set of 72 pith-based features are calculated for each
sequence in order to be explored in discriminating be-
tween deception and truth.
The set is a mixture of features structured around
four families. The first considered category is the
usual measures (12) such as mean, median, standard
deviation, etc. According to the literature, the voicing
rate in the speech depends on the emotional state of
the subject. Therefore, 14 features related to speech
voicing have been investigated in this study. Further-
more, 28 features related to first and second deriva-
tive of the pitch and their statistical measures have
also been computed. Indeed, derivative and second
derivative concern respectively vocal folds speed and
acceleration. Also, 18 varied others have been con-
sidered. The total set of the 72 investigated features is
displayed below in Tab. 1.
3.1.2 Non-verbal Features
Dealing with video modality, we make use of the an-
notation provided by (P
´
erez-Rosas et al., 2015a) using
An Audio-Visual based Feature Level Fusion Approach Applied to Deception Detection
199
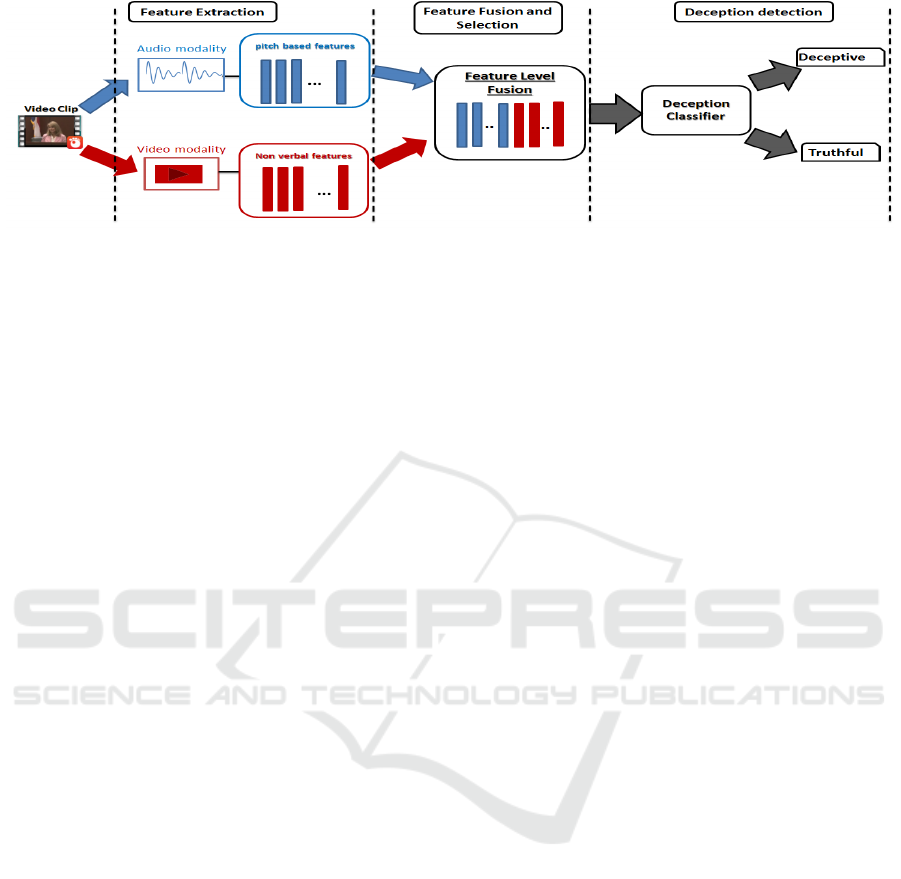
Figure 1: Deception detection system based on feature level fusion.
the MUMIN coding scheme which is a standard an-
notation scheme for interpersonal interactions. Based
on the MUMIN scheme, 39 features related to facial
expressions and body gestures have been investigated
for deception detection. They are classified into nine
families: General facial expressions, eyebrows, eyes,
gaze, mouth openness, mouth lips, hand movements,
hand trajectory, and head movements. They are listed
in details in Tab. 2. Each feature is a boolean value,
indicating the presence or the absence of the behav-
ioral cue. Note that the ’other’ class stands for the
cases where none of the other gestures in the same
family was observed. For example, dealing with hand
movements gestures, the ’Other’ label indicates the
cases where the speaker’s hands were not moving or
were invisible.
3.2 Feature Fusion and Selection
After extracting pitch-based and behavioral features,
they are merged together at the input of the feature
level fusion unit. Hence, a set of 111 mixed features is
obtained (binary for video and quantitative for audio).
Although, according to literature, using such a fea-
ture vector size with a small amount of samples may
lead to overfitting and worse classification results due
to the curse of dimensionality phenomenon (Jimenez
et al., 1998b). In order to avoid it, we opted to se-
lect only the most informative features, which better
discriminate between truth and deception. Many fea-
ture selection techniques have been investigated from
wrapper and filter methods and compared.
Two main wrapper techniques are investigated in
this study: Sequential Forward Selection (SFS) and
Sequential Backward Elimination (SBE). They are it-
erative methods based on exhaustive search to find the
optimal feature subset maximizing the classification
results. The SFS consist in adding, at each iteration,
a new feature to the relevant feature group. The latter
is the one which best improves the deception classifi-
cation rate. The process is repeated until no improve-
ment is observed when adding features. The SBE op-
erates in the opposite way. That is to say, at each iter-
ation, one feature is removed.
According to filter methods, the most common
criteria for features ranking are based on correlation,
consistency, class separability or mutual information.
In this work, we deal with mutual information-based
features ranking. The mutual information is a non-
linear measure of dependency between two features X
and Y . MI(X , Y ) translates the amount of information
shared by the two features. If the mutual information
between the two features is large, it means that they
are closely dependent.
More specifically, we make use of mutual infor-
mation to determine the relevance of each feature, or
its redundancy with others or both of them. The rel-
evance is defined as the ability of the feature to char-
acterize the considered class, that is to say, the depen-
dency between the feature and the target class. The
mutual information-based criteria are well appropri-
ate for the fusion of quantitative features (issued from
speech modality) with qualitative features (issued
from video modality) (Huang and Zeng, 2007)(Zeng
et al., 2009). From mutual information, one can ex-
tract many ranking criteria (see (YUZSEVER, 2015)
for more details). In this work, five of them are inves-
tigated. They are described below:
• Maximum Relevance (MaxRel): This criterion is
based on maximizing the features’ relevance. This
latter is defined as the maximum of all mutual in-
formation between individual features and the tar-
get class.
• Minimum Redundancy (MinRed): This method
aims to minimize the redundancy between fea-
tures. It is defined as the minimum of mutual in-
formation between features.
• Minimum Redunduncy Maximum Relevance
(mRMR): It is based on maximizing the relevance
while minimizing the redundancy. It is obtained
as the difference between relevance and redun-
dancy.
• Mutual Information Quotient (MIQ): is a variant
VISAPP 2020 - 15th International Conference on Computer Vision Theory and Applications
200

Table 1: Pitch-based features.
Family Features
Usual measures
Mean, Median, Variance, Normalized standard deviation, Max, Min, variance of the voiced
regions means, max of the voiced regions means, min of the voiced regions means,
mean of voiced regions variances, mean of voiced regions minimums,
mean of voiced regions maximums
Speech voicing
Number of voiced frames / number of frames total, Number of unvoiced frames / total
number of frames, Number of voiced frames / Number of unvoiced frames, Number of
voiced regions / Number of unvoiced regions, Number of voiced (unvoiced) regions /
Number of regions total, Length of the longest voiced region/number of frames total
ABS(mean of 1st Voiced region - mean of last Voiced region) / pitch mean
ABS(max of 1st Voiced region - max of last Voiced region) / pitch mean
ABS(min of 1st Voiced region - min of last Voiced region) / pitch mean
ABS(median of 1st Voiced region - median of last Voiced region) / pitch mean
ABS(variance of 1st Voiced region - variance of last Voiced region) / pitch mean
ABS(platitude of 1st Voiced region - platitude of last Voiced region) / pitch mean
ABS(vehemence of 1st Voiced region - vehemence of last Voiced region) / pitch mean
Pitch contour derivative
mean of pitch’s derivative, mean of ABS of pitch’s derivative, Variance of pitch’s
derivative, Variance of ABS of pitch’s derivative, Max of pitch’s derivative, Max of
ABS of pitch’s derivative, Min of pitch’s derivative, Min of ABS of pitch’s derivative,
Median of pitch’s derivative, Median of ABS of pitch’s derivative, Position of the max
derivative, Position of the max of the ABS of derivative, Position of the min derivative,
Position of the min of the ABS of derivative, Mean of the second derivative, Mean of ABS
of the second derivative, Variance of the second derivative, Variance of ABS of the
second derivative, Max of the second derivative, Max of ABS of the second derivative,
Min of the second derivative, Min of the ABS of the second derivative,
Median of the second derivative, Median of the ABS of the second derivative,
Max position of the second derivative, Max position of ABS of the second
derivative, Min position of the second derivative, Min position of the
ABS of the second derivative
Others
normalized max position, normalized min position, Pitch of first voiced frame,
Pitch of second voiced frame, Pitch of middle voiced frame, Pitch of before last
voiced frame, Pitch of last voiced frame, Normalized pitch of first voiced frame,
Normalized pitch of second voiced frame, Normalized pitch of middle voiced frame,
Normalized pitch of before last voiced frame, Normalized pitch of last voiced frame,
Platitude = mean / max, Vehemence = mean / min,
Number of peaks / total frames, mean of voiced regions platitudes,
mean of voiced regions vehemences
of mRMR which divides relevance by redundancy.
• Normalized mutual information feature
selection(NMIFS): it is obtained by divid-
ing the mutual information by its minimum
entropy.
3.3 Deception Decision Making
A large number of classification algorithms have been
developed in the literature. The most common ones
include linear and quadratic classifiers, support vec-
tor machines, kernel estimation, decision trees, neu-
ral networks, bayesian classifiers, deep learning, ...
(Kulis et al., 2013)(Deng, 2014). The K-nearest
neighbors algorithm was chosen according to its sim-
plicity since the effort is concentrated in feature selec-
tion and features fusion and it is thought that it will be
quite enough to have good classification quality (see
for example (Chebbi and Jebara, 2018) for fear emo-
tion detection from speech).
4 EXPERIMENTAL RESULTS
FOR DECEPTION DETECTION
4.1 Corpus
A real-life trial deception detection has been the cor-
pus of study (P
´
erez-Rosas et al., 2015a). It is com-
posed of videos recorded in public court trials in the
English language. They have been collected from
public multimedia sources (youtube, ...). The con-
sidered videos have been picked carefully regarding
their audio-visual visibility. Statements provided by
An Audio-Visual based Feature Level Fusion Approach Applied to Deception Detection
201

Table 2: Distribution of investigated behavioral cues per family.
Family Features
General facial expressions (4) smile, scowl, laugh, other
Eyebrows (3) frowing, raising, other
Eyes (5) exaggerated opening, closing both, closing one, closing repeated, other
Gaze (4) interlocutor, up, down, side
Mouth openness (2) close mouth, open mouth
Mouth lips (4) corners up, corners down, protruded, retracted
Hand movements (3) both hands, single hands, other
Hand trajectory (5) up, down, sideways, complex, other
Head movements (9)
waggle, shake, side-turn, repeated tilts, side tilt, move forward, repeated nods, down,
other
defendants and witnesses in courtrooms are collected
and labeled based on judgment outcomes and police
investigations. The corpus is composed of 196 video
clips: 53% of them are deceptive and 47% are truthful
ones.
4.2 Classification Criteria
In order to evaluate audio and video features to detect
deception, the classification quality was judged using
many complementary criteria. The retained perfor-
mances should be chosen according to a tradeoff be-
tween classification performance and features dimen-
sionality. The considered criteria are accuracy, preci-
sion, recall, F1 Score, True positive ratio (TPR) and
True negative ratio (TNR).
First, individual modalities are evaluated sepa-
rately. Next, the bimodal fusion approach is applied
using the seven considered feature selection tech-
niques. Simulation results are summarized in Tab. 3.
Based on it, one can deduce what follows.
- When dealing with separate modalities (columns
1 and 2), better classification results have been ob-
tained using nonverbal features compared to speech-
based ones. Indeed, the classification accuracy
reaches 94% using the nonverbal cues and 59% with
speech modality. We conclude as a result that behav-
ioral cues investigated in this study are more efficient
in identifying deception compared to pitch-based fea-
tures.
- When dealing with a combination of all audio
and nonverbal features (column 3), one can note that
classification results degrade. It falls from 94% to
85% according to the accuracy rate for example. This
result can be interpreted as follows: merging audio
(quantitative features) and video (qualitative features)
without relevant features selection is not appropriate.
Thus, it is crucial to consider feature selection tech-
niques in order to avoid the degradation of classifica-
tion performance due to the curse of dimensionality
problem (among others).
- According to the five MI-based criteria used
in this study (columns 4 to 8), one can notice that
MaxRel method presents low classification results
compared to other MI-based criteria. The other cri-
teria slightly differ from each other. Although, one
can note a large difference in terms of features num-
ber. MIQ and NMIFS seem to be the best methods,
as they provide 91% and 100% as accuracy and true
positive rates respectively using only 20 features.
- Dealing with wrapping techniques(columns 9
and 10), a high deception classification (accuracy cri-
terion), reaching 97%, have been obtained according
to both SFS and SBE. It is the number of features
which make the difference between them. Indeed,
SFS and SBE use 19 and 27 respectively as the op-
timal feature number. Dealing with other criteria, one
can notice variable and good performances.
- When Comparing MI-based criteria to wrapping
techniques, we note that MI-based criteria present
slightly lower results especially in terms of features’
number. Also, one can deduce that audio and video
modalities can be complementary when applying fea-
ture selection techniques.
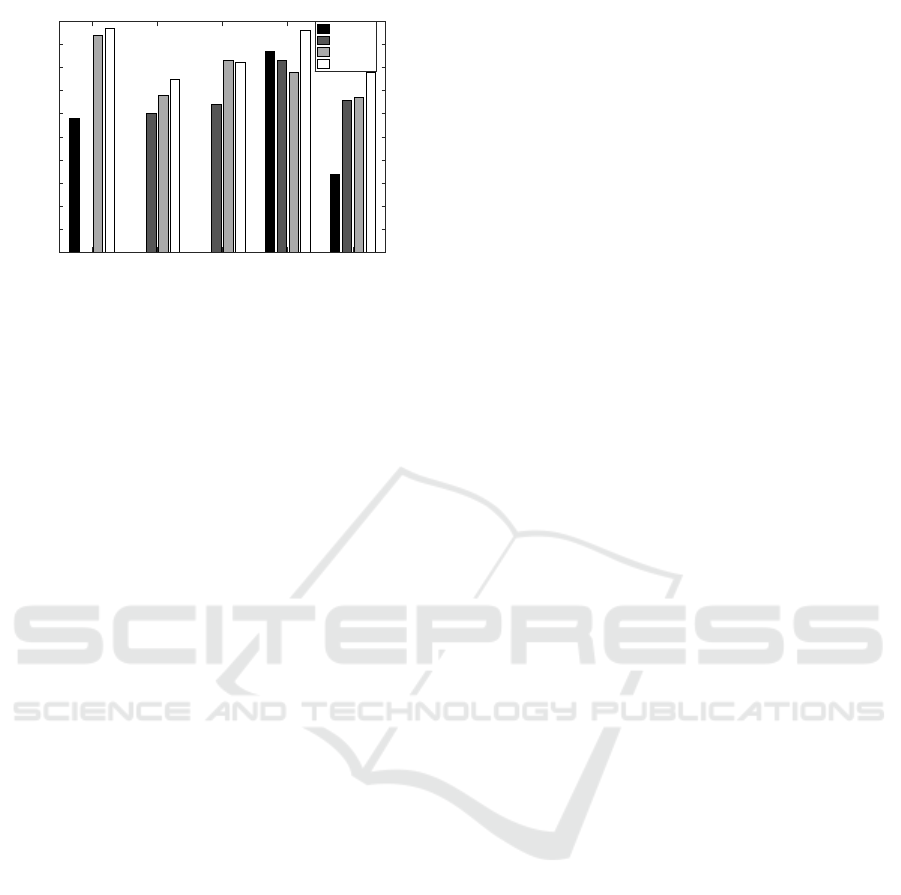
4.3 Distribution of Top-ranking
Features between Speech and Video
Modalities
In order to analyze the effectiveness of each modal-
ity for deception detection, the distribution of rele-
vant features between both modalities is shown in
Fig. 2. One can notice that the distribution of rel-
evant features between speech and video modalities
differ from one selection method to another. Deal-
ing with MaxRel, for example, all features retained as
relevant are pitch-based ones. In contrary according
to MinRed technique, all relevant features are video-
based ones. We note also that the distribution of
relevant features for NMIFS and SFS is slightly the
same: 55% with NMIFS and 53% with SFS as video-
based features rates and 45% with NMIFS and 47%
as audio-based features rates.
VISAPP 2020 - 15th International Conference on Computer Vision Theory and Applications
202

Table 3: Deception classification results using individual and combined sets of pitch-based and nonverbal features.
All features of separate modalities All features MI-based ranking score Wrapping techniques
Audio-only Video-only Max Rel Min Red MIQ mRMR NMIFS SFS SBE
Features’
number 72 39 110 32 30 20 40 22 19 27
Accuracy 58% 94% 85% 70% 94% 91% 94% 91% 97% 97%
F1score 59% 94% 85% 73% 94% 91% 94% 91% 97% 97%
Precision 58% 88% 86% 65% 93% 84% 89% 84% 94% 100%
Recall 61% 100% 83% 83% 94% 100% 100% 100% 100% 94%
TPR 61% 100% 83% 83% 94% 100% 100% 100% 100% 94%
TNR 56% 87% 87% 56% 93% 81% 87% 81% 94% 100%
As NMIFS, SFS and MIQ give the best classifi-
cation results and the most equilibrate repartition be-
tween audio and video modalities, we compare the
similarity between the considered features using the
Jaccard index. It is defined by the number of common
elements between the two sets divided by the whole
number of elements composing the two sets. The Jac-
card index is equal to 1 when all the features of the
two subsets are the same. Tab. 4 depicts the Jaccard
index between SFS, NMIFS and MIQ.
Figure 2: Distribution of relevant features into speech and
video modalities.
Table 4: Comparison of Jaccard index between relevant fea-
tures techniques.
Jaccard Index
(SFS,NMIFS) 0.12
(SFS,MIQ) 0.1
(NMIFS,MIQ) 0.35
According to the pairwise Jaccard indexes of these
three criteria, one can see that the most similar feature
subset is between MIQ and NMIFS which is equal to
0.35. Also, the percentage between the other criteria
is very low, which reveal a big difference between the
feature selection techniques in terms of relevant fea-
tures.
4.4 Comparison of the Proposed
Bimodal Deception Detection
Approach with the State-of-the-Art
The goal of this subsection is to compare the proposed
bimodal fusion approach for deception detection with
previous works in literature. To the best of our knowl-
edge, only four studies investigated a feature level fu-
sion using the same database exploited in this study
(P
´
erez-Rosas et al., 2015a)(Mihalcea and Strappar-
ava, 2009)(Gogate et al., 2017)(Jaiswal et al., 2016).
The authors in (P
´
erez-Rosas et al., 2015a) devel-
oped a multimodal approach for deception detection
based on verbal (unigrams + psycholinguistic +syn-
tactic complexity) and nonverbal features (facial dis-
plays + hand gestures). By combining the sets of
verbal and nonverbal features, they achieve 75% as
a classification accuracy using Decision Tree clas-
sification algorithm. In (Mihalcea and Strapparava,
2009), the authors extended their study by using Sup-
port Vector Machine algorithm for classification. The
classification accuracy was improved to reach 82%.
Also, authors in (Jaiswal et al., 2016) investigated a
multimodal approach based on a feature level fusion
of lexical, acoustic and visual features. Their adopted
approach consists in considering 18 visual features re-
lated to facial expressions, unigram features and 28
acoustic features related to prosody, energy, voicing
probabilities, spectrum, and cepstral families. These
features are combined into a single feature vector and
fed to the classifier. This feature level fusion approach
processed an accuracy rate reaching 78.95% using the
Support Vector Machine algorithm. Moreover using
the same database, the authors in (Gogate et al., 2017)
proposed an approach for deception detection based
on textual, audio and visual modalities. They revealed
96% as a deception detection accuracy using the deep
convolutional neural network algorithm.
Fig. 3 illustrates a comparison of the proposed
approach performance with the ones obtained in the
literature. The classification accuracies for each sep-
arate modality are presented as well as the fusion
of the considered modalities in each study. One
An Audio-Visual based Feature Level Fusion Approach Applied to Deception Detection
203
Proposed approach state of the art [34] state of the art [14] state of the art [35] state of the art [16]
Accuracy
0
10
20
30
40
50
60
70
80
90
100
Audio
Text
Video
Feature-level fusion
Figure 3: Comparison of the proposed bimodal deception
detection results with state-of-the-art.
can note that the proposed approach in this pa-
per outperforms the results obtained in the litera-
ture when using only video modality and when com-
bining modalities as well. In particular, using only
video modality, the classification accuracy obtained
in this paper outperforms the ones obtained in (P
´
erez-
Rosas et al., 2015a)(Mihalcea and Strapparava,
2009)(Gogate et al., 2017) and (Jaiswal et al., 2016)
by 26%, 11%, 16% and 27% respectively. When
combining all modalities considered in each study,
the proposed fusion approach outperforms those pre-
sented in (P
´
erez-Rosas et al., 2015a)(Mihalcea and
Strapparava, 2009)(Gogate et al., 2017) and (Jaiswal
et al., 2016) by 22%, 15%, 1% and 19% respectively.
5 CONCLUSIONS
In this paper, we presented a study of bimodal de-
ception detection using a real-life database. The pri-
mary focus in this work is to find the appropriate fea-
tures from speech and video providing high decep-
tion classification rates. So, a study of feature-level
fusion approach considering different criteria for fea-
ture selection techniques is carried. The results show
high classification deception detection reaching 97%
with only 19 features. Future work will address other
approaches for combining speech and video modali-
ties with the goal of reducing more and more features
number. The goal is to reduce complexity for real-
time use.
REFERENCES
Ben-Shakhar, G. (2002). A critical review of the control
questions test (cqt). Handbook of polygraph testing,
pages 103–126.
Bowman, H., Filetti, M., Janssen, D., Su, L., Alsufyani, A.,
and Wyble, B. (2013). Subliminal salience search il-
lustrated: Eeg identity and deception detection on the
fringe of awareness. PLOS one, 8(1):e54258.
Caso, L., Maricchiolo, F., Bonaiuto, M., Vrij, A., and Mann,
S. (2006). The impact of deception and suspicion on
different hand movements. Journal of Nonverbal be-
havior, 30(1):1–19.
Chebbi, S. and Jebara, S. B. (2018). On the use of pitch-
based features for fear emotion detection from speech.
In 2018 4th International Conference on Advanced
Technologies for Signal and Image Processing (AT-
SIP), pages 1–6. IEEE.
De Silva, L. C. and Ng, P. C. (2000). Bimodal emo-
tion recognition. In Proceedings Fourth IEEE In-
ternational Conference on Automatic Face and Ges-
ture Recognition (Cat. No. PR00580), pages 332–335.
IEEE.
Deng, L. (2014). A tutorial survey of architectures, algo-
rithms, and applications for deep learning. APSIPA
Transactions on Signal and Information Processing,
3.
DePaulo, B. M., Lindsay, J. J., Malone, B. E., Muhlenbruck,
L., Charlton, K., and Cooper, H. (2003). Cues to de-
ception. Psychological bulletin, 129(1):74.
Ekman, P. (2009). Telling lies: Clues to deceit in the
marketplace, politics, and marriage (revised edition).
WW Norton & Company.
Ekman, P. and Friesen, W. V. (1969). Nonverbal leakage
and clues to deception. Psychiatry, 32(1):88–106.
Ekman, P., Friesen, W. V., and Scherer, K. R. (1976). Body
movement and voice pitch in deceptive interaction.
Semiotica, 16(1):23–28.
Gannon, T., Beech, A. R., and Ward, T. (2009). Risk assess-
ment and the polygraph. The Use of the Polygraph in
Assessing, Treating and Supervising Sex Offenders: A
Practitioner’s Guide. Oxford: Wiley-Blackwell, pages
129–154.
George, S., Pai, M. M., Pai, R. M., and Praharaj, S. K.
(2019). Visual cues-based deception detection using
two-class neural network. International Journal of
Computational Vision and Robotics, 9(2):132–151.
Gogate, M., Adeel, A., and Hussain, A. (2017). Deep learn-
ing driven multimodal fusion for automated deception
detection. In 2017 IEEE Symposium Series on Com-
putational Intelligence (SSCI), pages 1–6. IEEE.
Granhag, P. A. and Str
¨
omwall, L. A. (2004). The detection
of deception in forensic contexts. Cambridge Univer-
sity Press.
Hall, M. A. (1999a). Correlation-based feature selection for
machine learning.
Hall, M. A. (1999b). Correlation-based feature selection for
machine learning.
Hartwig, M., Granhag, P. A., Str
¨
omwall, L. A., and Kro-
nkvist, O. (2006). Strategic use of evidence during
police interviews: When training to detect deception
works. Law and human behavior, 30(5):603–619.
Hirschberg, J. B., Benus, S., Brenier, J. M., Enos, F., Fried-
man, S., Gilman, S., Girand, C., Graciarena, M.,
Kathol, A., Michaelis, L., et al. (2005). Distinguishing
deceptive from non-deceptive speech.
VISAPP 2020 - 15th International Conference on Computer Vision Theory and Applications
204

Huang, T. S. and Zeng, Z. (2007). Audio-visual affec-
tive expression recognition. In MIPPR 2007: Pattern
Recognition and Computer Vision, volume 6788, page
678802. International Society for Optics and Photon-
ics.
Jaiswal, M., Tabibu, S., and Bajpai, R. (2016). The truth and
nothing but the truth: Multimodal analysis for decep-
tion detection. In 2016 IEEE 16th International Con-
ference on Data Mining Workshops (ICDMW), pages
938–943. IEEE.
Jensen, M. L., Meservy, T. O., Burgoon, J. K., and Nuna-
maker, J. F. (2010). Automatic, multimodal evaluation
of human interaction. Group Decision and Negotia-
tion, 19(4):367–389.
Jimenez, L. O., Landgrebe, D. A., et al. (1998a). Supervised
classification in high-dimensional space: geometrical,
statistical, and asymptotical properties of multivariate
data. IEEE Transactions on Systems, Man, and Cyber-
netics, Part C: Applications and Reviews, 28(1):39–
54.
Jimenez, L. O., Landgrebe, D. A., et al. (1998b). Supervised
classification in high-dimensional space: geometrical,
statistical, and asymptotical properties of multivariate
data. IEEE Transactions on Systems, Man, and Cyber-
netics, Part C: Applications and Reviews, 28(1):39–
54.
Kawulok, M., Celebi, E., and Smolka, B. (2016). Advances
in face detection and facial image analysis. Springer.
Kirchh
¨
ubel, C. and Howard, D. M. (2013). Detecting sus-
picious behaviour using speech: Acoustic correlates
of deceptive speech–an exploratory investigation. Ap-
plied ergonomics, 44(5):694–702.
Kleinberg, B., Arntz, A., and Verschuere, B. (2019). Being
accurate about accuracy in verbal deception detection.
PloS one, 14(8):e0220228.
Krishnamurthy, G., Majumder, N., Poria, S., and Cam-
bria, E. (2018). A deep learning approach for
multimodal deception detection. arXiv preprint
arXiv:1803.00344.
Kulis, B. et al. (2013). Metric learning: A survey. Founda-
tions and Trends
R
in Machine Learning, 5(4):287–
364.
Levitan, S. I., An, G., Ma, M., Levitan, R., Rosenberg,
A., and Hirschberg, J. (2016). Combining acoustic-
prosodic, lexical, and phonotactic features for auto-
matic deception detection. In INTERSPEECH, pages
2006–2010.
Levitan, S. I., Xiang, J., and Hirschberg, J. (2018).
Acoustic-prosodic and lexical entrainment in decep-
tive dialogue. In Proc. 9th International Conference
on Speech Prosody, pages 532–536.
Lu, S., Tsechpenakis, G., Metaxas, D. N., Jensen, M. L.,
and Kruse, J. (2005). Blob analysis of the head and
hands: A method for deception detection. In Proceed-
ings of the 38th Annual Hawaii International Confer-
ence on System Sciences, pages 20c–20c. IEEE.
Maschke, G. W. and Scalabrini, G. J. (2005). The lie behind
the lie detector. Antipolygraph. org.
Meservy, T. O., Jensen, M. L., Kruse, J., Burgoon, J. K.,
Nunamaker, J. F., Twitchell, D. P., Tsechpenakis, G.,
and Metaxas, D. N. (2005). Deception detection
through automatic, unobtrusive analysis of nonverbal
behavior. IEEE Intelligent Systems, 20(5):36–43.
Mihalcea, R. and Strapparava, C. (2009). The lie detector:
Explorations in the automatic recognition of deceptive
language. In Proceedings of the ACL-IJCNLP 2009
Conference Short Papers, pages 309–312. Association
for Computational Linguistics.
Owayjan, M., Kashour, A., Al Haddad, N., Fadel, M., and
Al Souki, G. (2012). The design and development of
a lie detection system using facial micro-expressions.
In 2012 2nd international conference on advances
in computational tools for engineering applications
(ACTEA), pages 33–38. IEEE.
P
´
erez-Rosas, V., Abouelenien, M., Mihalcea, R., and
Burzo, M. (2015a). Deception detection using real-
life trial data. In Proceedings of the 2015 ACM on
International Conference on Multimodal Interaction,
pages 59–66. ACM.
P
´
erez-Rosas, V., Abouelenien, M., Mihalcea, R., Xiao, Y.,
Linton, C., and Burzo, M. (2015b). Verbal and nonver-
bal clues for real-life deception detection. In Proceed-
ings of the 2015 Conference on Empirical Methods in
Natural Language Processing, pages 2336–2346.
Sharma, R., Pavlovi
´
c, V. I., and Huang, T. S. (2002).
Toward multimodal human-computer interface. In
Advances In Image Processing And Understanding:
A Festschrift for Thomas S Huang, pages 349–365.
World Scientific.
Sondhi, S., Vijay, R., Khan, M., and Salhan, A. K. (2016).
Voice analysis for detection of deception. In 2016 11th
International Conference on Knowledge, Information
and Creativity Support Systems (KICSS), pages 1–6.
IEEE.
Talkin, D. (1995). A robust algorithm for pitch tracking
(rapt). Speech coding and synthesis, 495:518.
Toma, C. L. and Hancock, J. T. (2010). Reading between
the lines: linguistic cues to deception in online dating
profiles. In Proceedings of the 2010 ACM conference
on Computer supported cooperative work, pages 5–8.
ACM.
Ververidis, D., Kotropoulos, C., and Pitas, I. (2004). Auto-
matic emotional speech classification. In 2004 IEEE
International Conference on Acoustics, Speech, and
Signal Processing, volume 1, pages I–593. IEEE.
Vrij, A., Edward, K., Roberts, K. P., and Bull, R. (2000).
Detecting deceit via analysis of verbal and nonverbal
behavior. Journal of Nonverbal behavior, 24(4):239–
263.
Vrij, A. and Semin, G. R. (1996). Lie experts’ beliefs about
nonverbal indicators of deception. Journal of nonver-
bal behavior, 20(1):65–80.
YUZSEVER, S. (2015). MUTUAL INFORMATION
BASED FEATURE SELECTION FOR ACOUSTIC
AUTISM DIAGNOSIS. PhD thesis, Bogazic¸i Univer-
sity.
Zeng, Z., Pantic, M., and Huang, T. S. (2009). Emo-
tion recognition based on multimodal information.
In Affective Information Processing, pages 241–265.
Springer.
Zhou, L., Burgoon, J. K., Nunamaker, J. F., and Twitchell,
D. (2004). Automating linguistics-based cues
for detecting deception in text-based asynchronous
computer-mediated communications. Group decision
and negotiation, 13(1):81–106.
An Audio-Visual based Feature Level Fusion Approach Applied to Deception Detection
205
