
Detecting Bidding Fraud using a Few Labeled Data
Sulaf Elshaar and Samira Sadaoui
Computer Science Department, University of Regina, Regina, Canada
Keywords:
Fraud Detection, Shill Bidding, Anomaly Detection, Hierarchical Clustering, Data Sampling, Semi-supervised
Classification.
Abstract:
Shill Bidding (SB) is a serious auction fraud committed by clever scammers. The challenge in labeling multi-
dimensional SB training data hinders research on SB classification. To safeguard individuals from shill bid-
ders, in this study, we explore Semi-Supervised Classification (SSC), which is the most suitable method for
our fraud detection problem since SSC can learn efficiently from a few labeled data. To label a portion of SB
data, we propose an anomaly detection method that we combine with hierarchical clustering. We carry out
several experiments to determine statistically the minimal sufficient amount of labeled data required to achieve
the highest accuracy. We also investigate the misclassified bidders to see where the misclassification occurs.
The empirical analysis demonstrates that SSC reduces the laborious effort of labeling SB data.
1 INTRODUCTION
The e-commerce industry and in particular the online
auction marketplace generate a substantial amount of
financial transactions. As with any activity involv-
ing large exchanges of money and products, malicious
sellers look for any opportunities to siphon money
into their pockets by manipulating the system. Such
is the case in online auctions where fraudulent activ-
ities occur either before, during, or after the bidding
period. Typically, our research concentrates on Shill
Bidding (SB), a fraud that has not been well exam-
ined. Many auction users doubt that auction com-
panies are committed to investigating and preventing
SB. Hence, it becomes essential to monitor ongoing
auctions for shill biding in order to prevent monetary
losses for the buyers. The aim of a shill bidder (the
seller himself or an accomplice user) is to artificially
drive up the price of the product by using fake ac-
counts. It is undoubtedly more challenging to uncover
fraud during the bidding phase because the latter in-
volves a dynamic behavior that often mimics the ac-
tion of genuine bidders. That is why there is a lack of
empirical studies examining SB in commercial web-
sites(Anowar et al., 2018). As far as we know, there
are no reliable statistics to measure the financial im-
pact caused by this type of fraud. On the other hand,
the online eBay community (ebay.com, 2017) reveals
a considerable number of anecdotal complaints from
buyers documenting their losses due to SB activities.
Indeed, bidders often attempt to detect SB by tracking
the competitors’ behavior manually, and then commu-
nicating their SB suspicions to eBay. It is clear that is
this task is time-consuming and prone to errors.
Thanks to Machine Learning (ML) techniques, we
can process a substantial amount of bidding transac-
tions. However, we encounter two tough challenges:
developing a SB dataset from commercial auctions
and labeling the multi-dimensional data into Normal
and Fraud. The supervised classification (traditional
approach) requires that all data are labeled. Never-
theless, labeling multi-dimensional training data is a
very costly operation, which is usually done manu-
ally by the experts of the application domain. To
fill this gap, we develop a semi-supervised learning
approach. Semi-Supervised Classification (SSC) has
been studied in other fraud detection domains where
it proved its worth. Indeed, SSC is capable of learning
efficiently with relatively few labeled data as demon-
strated in several studies (Klassen et al., 2018; Peikari
et al., 2018). SSC will greatly reduce the time and
effort in labeling our multi-dimensional SB dataset.
This way, checking the ground truth of those labels
becomes possible since we have few bidders to label.
As such, we are eager to explore SSC as a beneficial
approach to address the problem of detecting SB in
online auctions.
This present work employs a high-quality fraud
dataset that has been developed using a reliable col-
lection of SB patterns and the most recent auction
and bidder data (Elshaar and Sadaoui, 2019). This
dataset contains 9291 unlabeled samples. To label
Elshaar, S. and Sadaoui, S.
Detecting Bidding Fraud using a Few Labeled Data.
DOI: 10.5220/0008894100170025
In Proceedings of the 12th International Conference on Agents and Artificial Intelligence (ICAART 2020) - Volume 2, pages 17-25
ISBN: 978-989-758-395-7; ISSN: 2184-433X
Copyright
c
2022 by SCITEPRESS – Science and Technology Publications, Lda. All rights reserved
17

a few SB data, we first employ and validate a data
clustering technique to produce high-quality clusters
of bidders. Second, we introduce an approach to de-
tect anomalies, i.e., fraudulent bidders in each cluster.
Since they are a few training data, we can, therefore,
check their ground truth. Nevertheless, the produced
labeled subset is imbalanced, and we tackle this prob-
lem with a hybrid method of data sampling. Next,
we develop two SB detection models based on two
SSC algorithms of different categories and then com-
pare their predictive performance using several qual-
ity metrics. Our objective is to determine the ideal
fraud classifier, which will be instrumental in distin-
guishing between genuine and fraudulent bidders on
auction sites. Lastly, we analyze the influence of la-
beled data amount on the SB model accuracy. More
precisely, we determine how much-labeled data is re-
quired to build the optimal fraud classification model.
We note that all comparisons between SSC models
are carried out using the statistical testing.
We structure our paper as follows. Section 2 re-
views notable studies of SSC in the fraud detection
domain. Section 3 describes the characteristics of the
SB training dataset. Section 4 exposes the process re-
quired to label a few SB data. Section 5 optimizes two
SSC algorithms with the few labeled data and assess
their performance with several quality metrics. Sec-
tion 6 examines the impact of labeled data amount on
the SSC accuracy. Finally, Section 7 concludes our
work and provides the future research direction.
2 RELATED WORK
In this section, we examine recent research work,
published in 2018, about the capability of SSC specif-
ically in the field of fraud detection. For instance,
to detect spams in tweets, the authors in (Sedhai
and Sun, 2018) proposed an adaptive SSC framework
consisting of two parts: real-time mode and batch
mode. The former mode detects and labels tweets
using four labels: blacklisted URLs, near-duplicated,
trusted (has no spam words and posted by trusted
users), and others. Then, the batch module is up-
dated accordingly. For the experiments, the authors
employed an old dataset containing a large number of
tweets of two months in 2013. In the original dataset,
data came with labels obtained manually or automat-
ically. The authors randomly selected some of the au-
tomatically labeled data to manually relabel them in
order to increase the ground truth. For training, they
used only 6.6% of tweets while the rest was used for
testing. They compared the proposed system called
S3D (which updates after each time window) to four
other classifiers, Naive Bayes, Logistic Regression,
Random Forest, and S3D-Update (without batch up-
date). Experimentally, S3D is superior to the other
classifiers and showed good ability in learning new
patterns and vocabulary. However, this study focused
on detecting spam tweets, not suspicious users. In-
deed, the discovery of fraudsters is significant because
they can still conduct fraud as long as they have not
been suspended.
The Irish Commission for the energy regulation
released a dataset collected in 2009 and 2010 of
around 5000 Irish households. Very few data have
been manually labeled, but almost 90% of data were
unlabeled because of the difficulty of the inspections.
In (Viegas et al., 2018), the authors took advantage of
the few labeled data and use them for SSC in order to
detect electricity fraud carried out by consumers. The
labeled data were imbalanced, so they added simu-
lated data to overcome this problem. Random For-
est Co-Training was employed to develop the clas-
sification models by varying the percentages of la-
beled data: 10%, 20% and 30%. More precisely,
the authors trained the Random Forest classifier on
10% of labeled data. Then, they gradually added data
that the model can predict with the most confidence.
The experiments showed that few (10%) labeled data
yield into the best accuracy. The authors also demon-
strated that SSC outperform supervised classification
with Random Forest, Naıve Bayes and Logistic Re-
gression.
Social Networking Services (SNSs) are increas-
ingly threatened by fake or compromised social bots.
These bots can mimic the behavior of legitimate users
to evade detection. In (Dorri et al., 2018), the au-
thors developed ”SocialBotHunter”, a collective SSC
approach that combines the structural information of
the social graph with the information on users’ social
behavior in order to detect social botnets in a Twitter-
like SNS. They used a popular tweet dataset consist-
ing of 10,000 legitimate users and 1,000 spammers.
Since this dataset lacks information on social inter-
actions among users, they used two random graph
generators to simulate social interactions in terms of
a social graph containing both legitimate and social
bot regions. To estimate the initial anomaly scores
of unlabeled users, first, a 1-class SVM classifier was
trained with a social graph of users and a small set of
labeled legitimate users. Next, to detect social bots,
the anomaly scores were revised by modeling the so-
cial interactions among all users as a pairwise Markov
Random Field (MRF) and applying the belief prop-
agation to the MRF. Furthermore, the authors used
a testing dataset of 9,000 legitimate unlabeled users
and 500 unlabeled social bots to evaluate the accu-
ICAART 2020 - 12th International Conference on Agents and Artificial Intelligence
18

racy in both initial anomaly score calculation and bot-
net detection steps. The experiments demonstrated
that ”SocialBotHunter” was able to accurately detect
social bots involved in distributing social spam, also
known as social spambots, with a low false-positive
rate and an acceptable detection time.
Another study (Salazar et al., 2018) investigated
the performance of SSC in the context of imbalanced
classification problems, more precisely for the detec-
tion of fraud in credit card transactions. The authors
solved the class imbalance problem by generating ar-
tificial data using the algorithm IAAFT (Iteratively
Amplitude Adjusted Fourier Transform). For the clas-
sification task, they supervised learning algorithms on
the original labeled dataset combined with the self-
training SSC algorithm on a data subset.The follow-
ing (supervised) classifiers were used in their work,
linear discriminant analysis (LDA), quadratic dis-
criminant analysis (QDA) and a non-Gaussian mix-
ture based classifier (NGM). The main focus was on
measuring empirically the effect of SSC and synthetic
data as well. The actual dataset consists of 40 million
and two-thousand five hundred records of legitimate
and fraud operations respectively. From this dataset,
five subsets were randomly drawn, keeping 20% of
the legitimate operations and a variable number of
fraud operations for each of the subsets. Seven per-
centages of surrogate data were implemented: 0%,
20%, 33%, 50%, 75%, 83%, and 90%. The exper-
iments show that SSC is able to improve detection
results for F/L ratios (the fraud operation number to
legitimate operation number ratio). The higher the
percentage of surrogate data, the higher the detection
improvement obtained.
This literature review shows that SSC models pro-
duced very satisfactory classification performance in
the fraud detection domain. We note that in all these
studies, old training data have been used. However,
the most recent data and policies are essential to de-
veloping robust fraud detection models, as done in
this present paper.
3 SB DATA PRODUCTION FROM
E-AUCTIONS
We utilize a reliable SB dataset developed in our pre-
vious work (Elshaar and Sadaoui, 2019) based on a
collection of nine SB strategies described in Table 1.
It is worth mentioning that “Buyer Rating Based on
Items” and “Bid Retraction” are new fraud patterns.
These two patterns are calculated from the bidders’
history data while the others are derived from the auc-
tion data. Weight levels (Low, Medium and High)
have been also assigned to the patterns as shown in
Table 1. After scraping and preprocessing auctions
and bidders’ history from the eBay website, we mea-
sured the nine SB patterns against each bidder of each
auction. This computation resulted in an SB dataset
containing a tally of 11954 samples. Each sample,
which denotes the bidder’s conduct in an auction, is
a vector consisting of the Auction ID, Bidder ID, and
values of the nine fraud patterns. The value of an SB
metric is in the range of [0, 1]; the higher the value,
the more suspicious the bidder being examined. Af-
ter detecting and removing outliers, the SB dataset
possesses 9291 samples with 1399 auctions and 1100
bidders.
4 SB SUBSET LABELING AND
BALANCING
We need to label a few SB samples for the SSC task.
To this end, we use a stratified splitting technique to
select 10% of the whole SB dataset, i.e., 945 samples
containing both classes. In this section, we show how
to label the selected SB samples appropriately based
on a hierarchical clustering technique combined with
our anomaly detection method (Elshaar and Sadaoui,
2020). Finally, we show how to re-balance the pro-
duced SB subset.
4.1 Hierarchical Clustering
Data clustering is an unsupervised method that groups
samples based on their similarities. We utilize cluster-
ing to get a good insight into the SB subset distribu-
tion and hence detect anomalies. For this purpose, we
employ Hierarchical Clustering (HC) since it has been
applied successfully to the domain of anomaly detec-
tion (Wang et al., 2018). With HC, experimentally, we
found out that the Centroid Linkage is the best crite-
rion to compute the distance between SB samples in
the produced clusters (11 is the optimal number). The
Centroid Linkage considers the distance between the
centroids as the distance between two clusters.
The distribution of these clusters is as follows:
17.9%, 0.1%, 54.6%, 1.4%, 22.7%, 0.3%, 1.2%,
0.5%, 0.1%, 0.7% and 0.1%.
An important issue associated with data clustering
is the quality of the clusters. We evaluate the quality
of HC using three approaches:
1. Visualization: by plotting clusters against in-
stance IDs as presented in Figure 1, HC looks very
good in terms of the minimization of the distance
between a cluster elements and the maximization
of the distance between two clusters.
Detecting Bidding Fraud using a Few Labeled Data
19

Table 1: Description of nine SB strategies.
Name Description
Bid Level
Bid Retraction (Medium) Shills retract their bids more than normal especially
when their activities with a seller is high
Early Bidding (Low) Shills start bidding very early to attract the attention of
other users
Last Bidding (Medium) Shills do not place bids in the last period of an auction
to avoid winning
Bidding Ratio (Medium) Shills compete in an auction much more than normal
bidders to inflate the price
Bidder Level
Buyer Rating based on
Items (Low)
Shills usually open new accounts to commit fraud and
have very few feedbacks although they frequently par-
ticipate in auctions
Buyer Tendency (Medium) A shill participates in auctions of a particular seller
more than other sellers with the same products
Winning Ratio (High) Shills avoid winning despite their large number of bids
Auction Level
Auction Opening Price
(Low)
Auctions with a low opening price are more likely to
involve SB
Auction Bids (Low) Auctions with shilling have often more bids than con-
current auctions (selling the same product in the same
time period)
Figure 1: HC distribution of SB subset.
2. Classes to clusters evaluation. The Weka toolkit
uses this method as follows:
• Ignoring the class attribute.
• Generating the clustering.
• Assigning classes to a cluster based on the ma-
jority value of the class-attributes within each
cluster.
• Computing the classification error.
We obtained only 9% of samples that are incor-
rectly clustered.
3. Classification via clustering: it assesses a cluster
as a classifier by building a meta-classifier that
uses clustering for classification, and returns a
confusion matrix. After evaluating this method
with 10-fold cross validation, the result shows that
only 8% of samples are incorrectly classified.
4.2 Anomaly Detection
The behaviour of shills may look somehow similar
to normal bidders. Thus, a cluster may include shills
among genuine bidders, which we should not ignore.
Consequently, we propose a hybrid approach to dis-
cover the anomalies in the clusters by combining the
SB scores of bidders with Three Sigma Rule. This
empirical rule states that for many normal distribu-
tions, almost all the population lies within the three
standard deviations of the mean. The standard devi-
ation (σ) measures how far the normal distribution is
spread around the mean (µ). We choose this rule be-
cause it is useful when comparing datasets that may
have the same mean but different ranges. Besides, it
is commonly utilized in anomaly detection applica-
tions. On the other hand, the SB score of a bidder
is the total value of the nine fraud patterns in a given
cluster. A bidder a bidder is identified as fraudulent if
his SB score is above the threshold line, which means
the fraud score deviates by (µ + σ) from the mean.
However, we have three clusters that contain only
one sample. Hence, we label them based on a hy-
ICAART 2020 - 12th International Conference on Agents and Artificial Intelligence
20

pothesis that if a bidder has at least three SB patterns
equal to or more than 0.80 and at least one of them is
in the high or medium weight category, then we label
the bidder as a fraud. Here we also check the ground
truth of our labeled subset using the same hypothesis.
4.3 Hybrid Data Sampling
As we can observe the SB subset is moderately im-
balanced with a ratio of 5:1 (791 normal samples vs.
154 fraud samples) as expected in any fraud classi-
fication problems. Imbalanced data means here that
the vast majority of data belongs to the ”Normal”
class and the minority of data to the ”Fraud” class.
Even though a classifier returns a high accuracy, it is,
however, deceptive. Indeed, it will predict the data
to be in the normal class while the fraud class is ig-
nored. To solve this problem, we apply the hybrid
method of data over- and under-sampling. We em-
ploy the popular algorithm SMOTE (Fern
´
andez et al.,
2018a), which creates synthetic samples from the mi-
nority class using neighboring samples. Having syn-
thetic data helps to simulate other scenarios that are
were not available in the collected data (Lopez-Rojas
and Axelsson, 2012). SMOTE adds the artificial data
at the end of the training dataset, and this may cause a
problem with cross-validation because one fold may
hold a large number of one class. To avoid this issue,
we randomize the samples in the SB subset.
As mentioned in the original paper of SMOTE
(Chawla et al., 2002), it is better to combine
SMOTE with under-sampling (removing data from
the Fraud class). Therefore, we apply SpreadSubSam-
ple method and set the distribution spread to “1” to
make both classes equal. Table 2 presents the bal-
anced SB subset before and after data sampling.
In summary, after data sampling, the entire train-
ing SB dataset consists of 9578 samples. 1232 labeled
and 8346 unlabeled (see Figure 2).
Table 2 exposes our labeled and balanced SB sub-
set.
Table 2: Statistics of labeled balanced SB subset.
Label Before Data
Sampling
After Data
Sampling
Normal
Samples
791 616
Fraud
Samples
154 616
Total 945 1232
Figure 2: Our SB training dataset.
5 SSC-BASED SB DETECTION
5.1 Classifier Selection and Parameter
Optimization
We conduct the experiments with two collective clas-
sifiers from different categories, the meta classifier
“Chopper” and the lazy classifier “CollectiveIBK”
(Bernhard et al., 2014). Chopper is an ensemble
model that uses a first classifier for labeling the test-
ing data after the learning phase. The trained clas-
sifier determines the distributions for all the samples
in the test dataset and uses the difference between
two confidences to rank the samples. The fold with
the highest ranking (the most significant gap between
two confidences) is then added to the training dataset
only after the labels have been determined. The new
training dataset is then fed into a second classifier,
which once again identifies the distributions for the
remaining testing samples. We customize Chopper
with Naive Bayes (NB) as the first classifier and Ran-
dom Forest (RF) as the second classifier since these
two algorithms are commonly utilized in the fraud de-
tection field.
CollectiveIBK is an implementation of the KNN
algorithm. It first determines the best K training sam-
ples. Then, for all the test samples, it builds a neigh-
borhood consisting of K samples from both training
and test pools. All the samples in a neighborhood are
sorted according to their distance to the test sample
they belong to. The neighborhoods are also sorted
according to their ‘rank,’ where ‘rank’ means the dif-
ferent occurrences of the two classes in the neighbor-
hood. For unlabelled test samples with the highest
rank, the algorithm deduces their labels by majority
voting or, in case of a tie, by the first class. This task
is iterated until no further test samples remain unla-
belled.
Detecting Bidding Fraud using a Few Labeled Data
21

We assess the accuracy of the two SSC algorithms
by training them with the labeled SB subset. For
this learning task, we employ the WEKA Experi-
menter but this tool does not have the SSC capabil-
ity. Therefore, we plug in a collective package con-
taining several SSC algorithms, which is provided
in fracpete.github. For all the experiments, we use
10-fold cross-validation to build stable models. We
tune the hyper-parameters of each classifier using a
class called ”CVParameter” that selects the parame-
ters’ values by cross-validation. Still, this class re-
quires the user to determine which parameters should
be optimized and their value ranges as well. Re-
garding Chopper, for the second classifier RF, in six
steps, we tune the range of the maximum tree depth
(MaxDepth) from 1 to 50 and the range of the num-
ber of iterations (NumIterations) from 50 to 300. The
number of features is another parameter but in our
case we need all the nine SB patterns. Hence, we set it
to “0” to use all the features. After several trials, CV-
Parameter returns the best model with an error rate of
3.08% based on MaxDepth = 12 and NumIterations =
100.
For CollectiveIBK, we vary the number of neigh-
bors (K) from 10 to 30 in five steps. CVParam-
eter provides the best model with an error rate of
22% using the default value of K = 10. We also set
the distance weighting of the neighbor method into
(1− theirdistance) to assign more weights to the clos-
est neighbors. To search for neighbors, we select
KDTree to speed up the process based on the Euclid-
ian Function.
5.2 Performance Evaluation
Table 3: Performance of SSC models.
Classifier CollectiveIBK Chopper
Precision 0.76 0.82
Recall 0.81 0.85
F1-Score 0.78 0.83
AUC 0.77 0.90
FNR 0.19 0.15
In our study, we are interested in detecting fraud-
sters more than in identifying normal bidders. So, we
choose the most common quality metrics for the fraud
class:
1. Precision:
T P/TP + FP (1)
It calculates the ratio of correctly predicted fraud-
sters to the total predicted true and false fraud.
2. Recall:
T P/TP + FN (2)
It calculates the ratio of fraudsters that are cor-
rectly classified and fraudsters that are misclassi-
fied.
3. F1-Score:
2 ∗ (Recall ∗ Precision)/(Recall + Precision)
(3)
It calculates the weighted average of Precision
and Recall.
4. The Area Under the ROC Curve (AUC):
It tells us how much a model can distinguish be-
tween normal and fraud classes. The closer value
is to 1 the better.
5. False Negative Rate (FNR):
1 − T P (4)
It measures the ratio of fraudsters that are classi-
fied as normal bidders.
To conduct a proper comparison between the two
SSC models, we employ the statistical testing T-test,
which is widely used to determine if there is a sig-
nificant difference between two or more models. To
perform this test on the WEKA platform, we apply
the “paired T-tester-correct”. In Table 3, the colored
cells indicates that an outcome is statistically worse.
At the 0.05 level of significance, CollectiveIBK is sig-
nificantly worse than Chopper in terms of Precision,
F1-score, and AUC. However, the difference in Re-
call and FNR is not statistical significant. In general,
Chopper outperforms CollectiveIBK by 5% in detect-
ing SB. This gap is important in the fraud detection
context. Chopper discovers the majority (82%) of the
actual shill bidders, which means only 15% of fraud-
sters has been classified erroneously.
6 OPTIMAL LABELED DATA
AMOUNT
The main advantage of SSC models is that they can
learn from a few labeled data along with a lot of un-
labeled data. In this paper, we aim to determine the
minimal amount of labeled data that is required to
achieve the highest fraud detection accuracy. Plot-
ting the error rate to the varying sizes of the training
dataset is commonly used to produce a learning curve
of the underlying model. With the learning curve, we
can easily identify whether the learner is over-fitting
or not.
In the previous section, we obtained the best clas-
sification outcome with Chopper. Consequently, we
choose it as the learned model to assess the perfor-
mance when varying the amount of labeled data. Our
ICAART 2020 - 12th International Conference on Agents and Artificial Intelligence
22
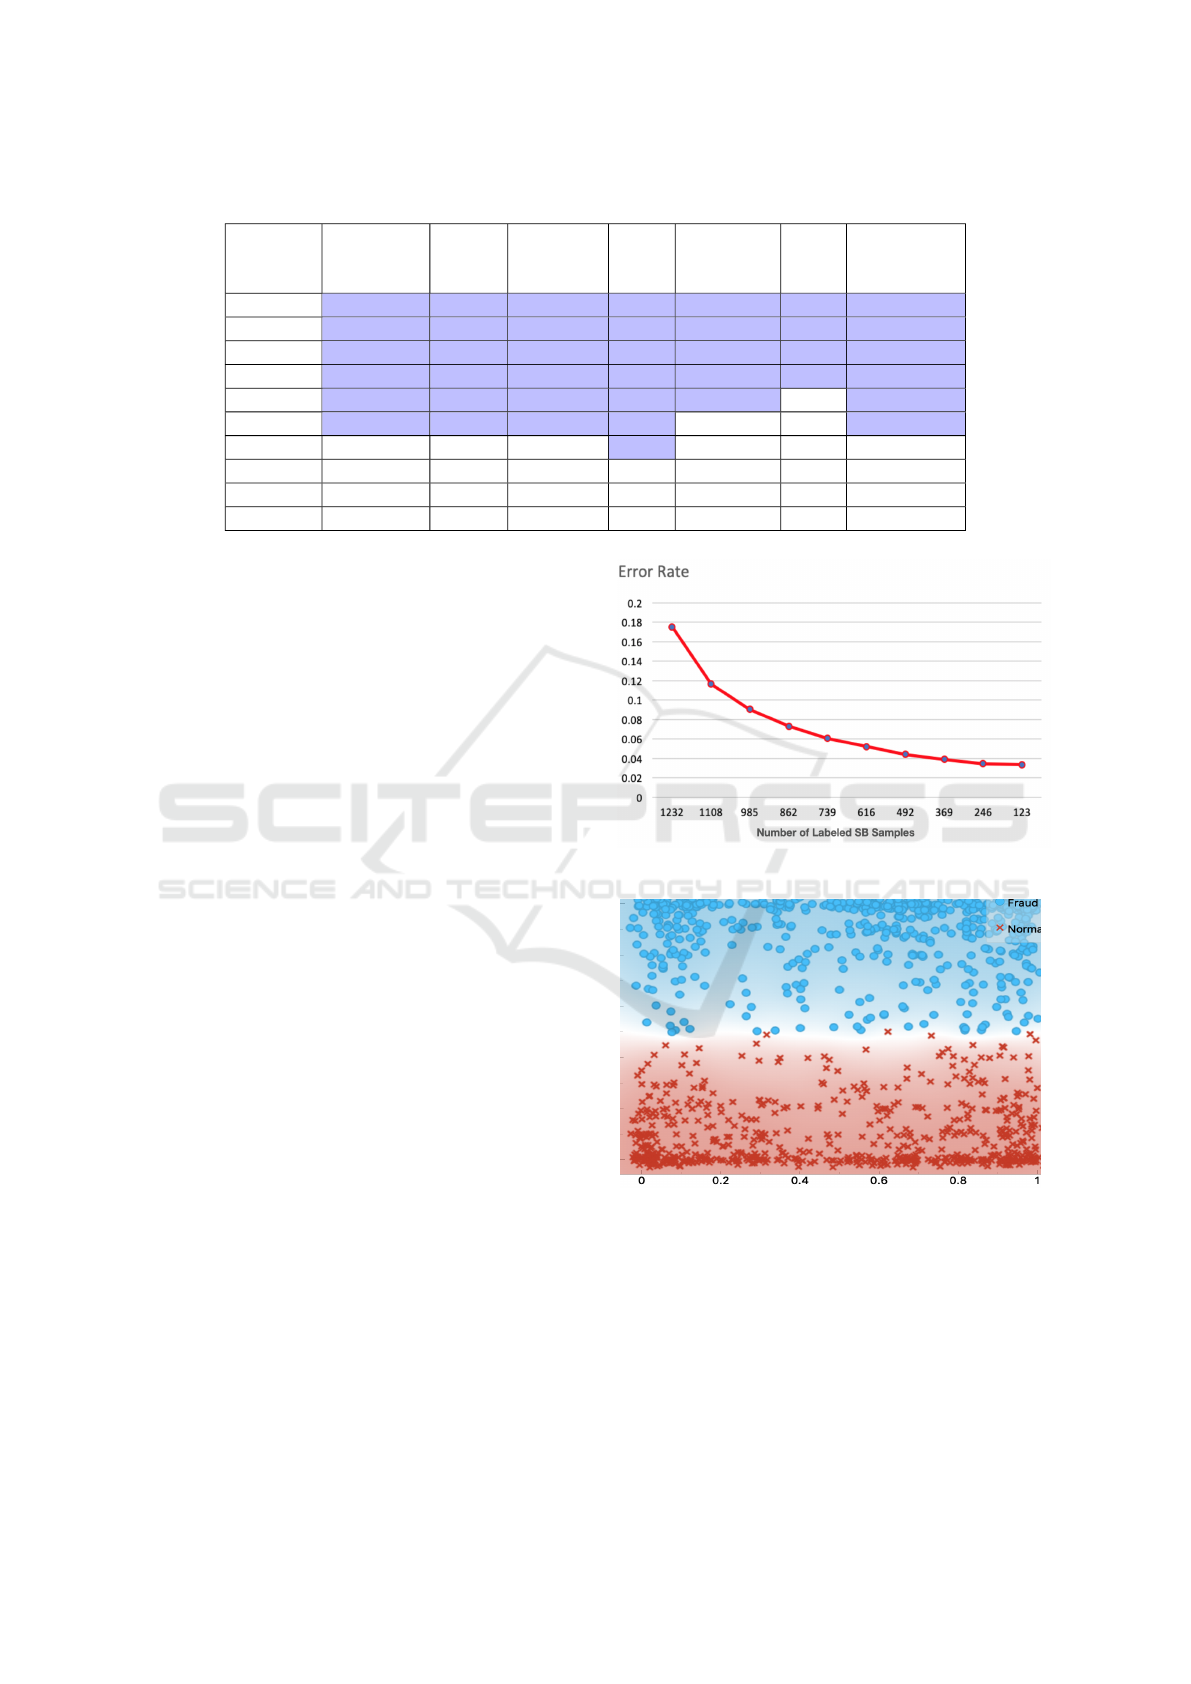
Table 4: Chopper Performance with different sizes of SB labeled subset.
No. of
Labeled
Samples
Precision Recall F1-Score AUC Accuracy FNR Error Rate
1232 0.82 0.85 0.83 0.90 0.82 0.15 0.18
1108 0.87 0.90 0.88 0.95 0.88 0.10 0.12
985 0.90 0.93 0.91 0.97 0.91 0.07 0.09
862 0.92 0.94 0.93 0.98 0.93 0.06 0.07
739 0.93 0.95 0.94 0.98 0.94 0.05 0.06
616 0.94 0.95 0.95 0.99 0.9479 0.05 0.05
492 0.95 0.96 0.96 0.99 0.9558 0.04 0.04
369 0.96 0.96 0.96 0.99 0.9611 0.04 0.04
246 0.97 0.97 0.97 0.99 0.9654 0.03 0.03
123 0.97 0.97 0.97 0.99 0.966 0.03 0.03
goal here to discover the minimal sufficient amount of
labeled data to train the chosen classifier. As exposed
in Table 4, we generate ten sizes of the labeled SB
subset by applying a filtered classifier that uses un-
supervised filtering to remove 10%, 20%, 30%, 40%,
50%, 60%, 70%, 80%, 90% of samples from the SB
subset.
We then utilize 10-fold cross-validation to evalu-
ate the model’s performance. For an accurate com-
parison, we perform the statistical significance test-
ing with 0.05 as significant factor (the most common
probability cutoff value). The base test for the T-test
is that the model is trained with the lowest labeled
data (123 samples). Table 4 provides the performance
of the SSC model trained with different datasets using
Precision, Recall, F1-score, FNR and AUC. To get a
better insight about the performance of the SB classi-
fiers, we also consider two other metrics:
• Accuracy:
T P + FN/(T P + T N + FP + FN) (5)
It calculates the ratio of bidders correctly classi-
fied.
• Error Rate:
1 − (T P + FN/(T P + T N + FP + FN)) (6)
It calculates the ratio of bidders incorrectly
classified.
The colored cells of Table 4 present the signif-
icantly worse results when compared to the based
learned model.
As we can observe in Table 4 and Figure 3, the
models trained with 123 and 246 of labeled data re-
turn the best performance. According to the T-test,
there is no significant difference when increasing the
count of labeled data up to 492. On the other hand,
Figure 3: Chopper learning curve.
Figure 4: Misclassified data with fewer labeled data.
there is a substantial drop in Precision, Recall, F1-
score, and AUC when adding more than 492 sam-
ples. The decline continues with the increase in the
amount of SB data to reach the lowest accuracy of
82% and the highest error rate of 18%. In conclu-
sion, the model trained with fewer labeled samples
(between 123 to 469) can detect 97% of actual fraud
while only 3% of the fraud is erroneously classified.
Furthermore, as illustrated in Figure 4 and Figure
Detecting Bidding Fraud using a Few Labeled Data
23

Figure 5: Misclassified data with more labeled data.
5, we examine the misclassified data for both normal
and fraud classes to give us an example of classifica-
tion errors. We found out that in case of a very few
training samples, the misclassification occurred only
in the samples that are the closest to the boundary be-
tween the two classes. However, as the labeled data
amount increases, the errors spread to points beyond
that, which explains why the error rate increases by
augmenting the amount of labeled data.
7 CONCLUSION
Research studies on classifying bidding fraud in on-
line auctions have been limited due to the great diffi-
culty of labeling multi-dimensional training data. For
this purpose, we employed the SSC approach that
proved its effectiveness for our fraud detection prob-
lem. To label a small portion of the SB data, we
utilized hierarchical clustering together with anomaly
detection. Next, we used hybrid data sampling to
address the skewed class distribution issue. Thanks
to SSC, we reduced the effort and time in labeling
multi-dimensional SB data, which is a challenging
task. According to the statistical testing results, the
SSC model was able to differentiate between normal
bidders and fraudsters accurately using only 123 la-
beled data. The learning curve of the model showed
that the bigger the size of the labeled SB data, the
less effective the model would be. This conclusion is
consistent with the findings of other studies, such as
(Viegas et al., 2018).
In this paper, we trained the SSC algorithms with
balanced data where synthetic data have been added
to the fraud class and data removed from the nor-
mal class. For future work, we would like to de-
velop a cost-sensitive semi-supervised classification
model that can systematically handle imbalanced SB
(Fern
´
andez et al., 2018b). Also, we will study how to
minimize the misclassification rate while using a few
labeled data.
We are also interested in comparing our semi-
supervised approach with incremental learning that
may be utilized to address the problem of scarcity of
training data. The incremental classifier is first trained
on few labeled data, and then progressively improved
with new data but without re-training from scratch.
REFERENCES
Anowar, F., Sadaoui, S., and Mouhoub, M. (2018). Auc-
tion fraud classification based on clustering and sam-
pling techniques. In 2018 17th IEEE International
Conference on Machine Learning and Applications
(ICMLA), pages 366–371. IEEE. Dec. Orlando, FL,
USA. doi:10.1109/ ICMLA.2018.00061
Bernhard, P., Driessens, K., and Reutemann, P. (2014). Col-
lective and semi-supervised classification. The Uni-
versity of Waikato,Technical Paper, pages 1–21.
Chawla, N. V., Bowyer, K. W., Hall, L. O., and Kegelmeyer,
W. P. (2002). Smote: Synthetic minority over-
sampling technique. Journal of Artificial Intelligence
Research, 16:321–357.
Dorri, A., Abadi, M., and Dadfarnia, M. (2018). So-
cialbothunter: Botnet detection in twitter-like social
networking services using semi-supervised collective
classification. In 2018 IEEE 16th Intl Conf on De-
pendable, Autonomic and Secure Computing, 16th
Intl Conf on Pervasive Intelligence and Computing,
4th Intl Conf on Big Data Intelligence and Com-
puting and Cyber Science and Technology Congress
(DASC/PiCom/DataCom/CyberSciTech), pages 496–
503. IEEE.
ebay.com (2017). The ebay community. Accessed 01, 2017.
https://community.ebay.com/.
Elshaar, S., and S. Sadaoui. (2019). Building High-quality
Auction Fraud Dataset. Computer and Information
Science; Vol. 12, No. 4; 2019, ISSN 1913-8989, E-
ISSN 1913-8997, Canada. doi:10.5539/cis.v12n4p1
Elshaar, S., and S. Sadaoui. (2020). Semi-supervised Clas-
sificationof Fraud Data in Commercial Auctions, Ap-
plied Artificial Intelligence, DOI:10.1080/08839514.
2019.1691341
Fern
´
andez, A., Garcia, S., Galar, M., Prati, R. C.,
Krawczyk, B., and Herrera, F. (2018a). Learning from
imbalanced data sets. Springer.
Fern
´
andez, A., Garcia, S., Herrera, F., and Chawla, N. V.
(2018). Smote for learning from imbalanced data:
progress and challenges, marking the 15-year an-
niversary. Journal of artificial intelligence research,
61:863–905.
Klassen, S., Weed, J., and Evans, D. (2018). Semi-
supervised machine learning approaches for predict-
ing the chronology of archaeological sites: A case
study of temples from medieval angkor, cambodia.
PloS one, 13(11):e0205649.
ICAART 2020 - 12th International Conference on Agents and Artificial Intelligence
24

Lopez-Rojas, E. A. and Axelsson, S. (2012). Money laun-
dering detection using synthetic data. In The 27th an-
nual workshop of the Swedish Artificial Intelligence
Society (SAIS); 14-15 May 2012;
¨
Orebro; Sweden,
pages 33–40. Link
¨
oping University Electronic Press;
Link
¨
opings universitet.
Peikari, M., Salama, S., Nofech-Mozes, S., and Martel,
A. L. (2018). A cluster-then-label semi-supervised
learning approach for pathology image classification.
Scientific reports, 8(1):7193.
Salazar, A., Safont, G., and Vergara, L. (2018). Semi-
supervised learning for imbalanced classification of
credit card transaction. In 2018 International Joint
Conference on Neural Networks (IJCNN), pages 1–7.
IEEE.
Sedhai, S. and Sun, A. (2018). Semi-supervised spam de-
tection in twitter stream. IEEE Transactions on Com-
putational Social Systems, 5(1):169–175.
Viegas, J. L., Cepeda, N. M., and Vieira, S. M. (2018).
Electricity fraud detection using committee semi-
supervised learning. In 2018 International Joint Con-
ference on Neural Networks (IJCNN), pages 1–6.
IEEE.
Wang, Y., Qin, K., Chen, Y., and Zhao, P. (2018). Detect-
ing anomalous trajectories and behavior patterns using
hierarchical clustering from taxi gps data. ISPRS In-
ternational Journal of Geo-Information, 7(1):25.
Detecting Bidding Fraud using a Few Labeled Data
25
