
Analysis of the Use of Colour for Early Detection of Dementia
Thomas Ostermann
1
, Sibylle Robens
1
, Petra Heymann², Sebastian Unger
1
, Stephan Müller
3
,
Christoph Laske
3
and Ulrich Elbing
2
1
Department of Psychology and Psychotherapy, Witten/Herdecke University, Witten, Germany
2
University of Applied Sciences Nürtingen-Geislingen, Germany
3
Department of Psychiatry and Psychotherapy, Eberhard Karls University, Tübingen, Germany
stephan.mueller@med.uni-tuebingen.de, christoph.laske@med.uni-tuebingen.de, ulrichelbing@arcor.de
Keywords: Alzheimer’s Disease, Free Drawing Task, Colour Perception, Mental Status and Dementia Tests.
Abstract: Cognitive visuo-constructive impairments, which can be detected by drawing tasks are early signs of
Alzheimer’s disease (AD). Additionally, several studies revealed deficits in colour perception for patients
with AD. In a former analysis of the impact of digital tree-drawing parameters on the screening of early
dementia, a logistic regression revealed the number of colours together with the drawing velocity and the
number of line widths changes as discrimination characteristics (ROC AUC=0.90, sensitivity=.86,
specificity=0.82). To analyse the diagnostic importance of colour variations in drawings, a reanalysis of these
data was done with 67 healthy subjects (25 females, mean age 66 ± 10 yrs.) and 56 subjects with early AD
(40 females, mean age 73 ± 9 yrs.). The exclusion of colour variables resulted in a good discrimination of
healthy and AD (ROC AUC=0.89, specificity=0.89) but in a reduction of sensitivity to .77 compared to the
former model. This suggest that the analysis of colour variations in drawings has an important diagnostic
impact.
1 INTRODUCTION
Although the neurodegenerative process of AD
cannot be stopped yet, an early diagnosis allows for
the application of symptomatic therapies which can
temporally reduce symptoms and maintain the
patient’s level of life quality and functioning
(Alzheimer's Association, 2018).
Several drawing tests, such as Shulman’s clock
drawing test (Shulman, Gold, Cohen, & Zucchero,
1993) or the Rey–Osterrieth complex figure test
(Shin, Park, Park, Seol, & Kwon, 2006), have been
established to screen for dementia in assessing several
cognitive functions, e.g. the eye-hand coordination,
concentration, visuospatial and planning skills, and
short-term memory (Freedman et al., 1994). These
screening tests all have in common that the patient
draws with a pen or pencil on a paper sheet and that
the resulting picture is analysed by dementia
specialists.
Actual studies suggest that the digital assessment
of the total drawing process, including time and
kinematic variables as well as texture features,
provides additional prognostic information in
detecting mild cognitive impairment and early AD.
(Muller, Preische, Heymann, Elbing, & Laske, 2017;
Robens, Heymann, et al., 2019; Robens, Ostermann,
et al., 2019; Souillard-Mandar et al., 2016).
In the digital tree-drawing test (dTDT), which was
firstly introduced by Heyman et al. (Heymann et al.,
2018), patients drew a tree from memory with a
digital pen on a Microsoft Surface Pro 3 digitizer
without time restrictions and optionally 12 colours
and 3 line widths. The dTDT analysis of digitally
recorded grey-level texture features revealed
significant differences between cognitive healthy
subjects and patients with early AD, indicating more
homogeneity and less contrast in the pictures of the
dementia patients (Robens, Ostermann, et al., 2019).
Furthermore a current study on the dTDT analysed 19
dTDT characteristics with stepwise logistic
regression models and identified the average painting
velocity in combination with the variation in the use
of colours and line widths as significant predictors for
early AD (Robens, Heymann, et al., 2019). These
results are in accordance with neuropsychological
findings on colour vision deficiencies in AD patients
(Safar & Press, 2011; Wijk, Berg, Sivik, & Steen,
316
Ostermann, T., Robens, S., Heymann, P., Unger, S., Müller, S., Laske, C. and Elbing, U.
Analysis of the Use of Colour for Early Detection of Dementia.
DOI: 10.5220/0008881303160320
In Proceedings of the 13th International Joint Conference on Biomedical Engineering Systems and Technologies (BIOSTEC 2020) - Volume 5: HEALTHINF, pages 316-320
ISBN: 978-989-758-398-8; ISSN: 2184-4305
Copyright
c
2022 by SCITEPRESS – Science and Technology Publications, Lda. All rights reserved

1999) and case reports on artists’ drawings before and
with AD (Lee, Tsai, & Chen, 2015; Maurer &
Prvulovic, 2004).
As nearly all actual screening drawing tasks are
based on pencil-paper drawings, the main question of
the current analysis is, whether the exclusion of
colour variables in a digital tree drawing task does
influence the test’s sensitivity.
2 MATERIAL AND METHODS
The participants came to the clinical ambulance of the
Memory Clinic at the University Hospital of
Tübingen from July 2015 to July 2016 in order to
check their cognitive skills. All participants
underwent neuropsychological testing. The healthy
control subjects had no signs of cognitive
impairments besides normal cognitive aging.
Participants fulfilled the inclusion criteria of normal
or corrected-to-normal visual acuity, of no severe
hearing impairments and had the ability to perform
tests and drawings without physical restrictions. The
study was approved by the local ethical committee of
the University Hospital of Tübingen and all
participants signed an informed consent form after
receiving a detailed explanation of the study.
The diagnostic criteria for early dementia of
Alzheimer’s type (eAD) were defined according to
the National Institute of Neurological and
Communicative Disorders and Stroke Alzheimer’s
Disease and Related Disorders Association
(McKhann et al., 1984). All 56 patients diagnosed
with eAD had a score of 3 or 4 on the Global
Deterioration Scale (Reisberg, Ferris, de Leon, &
Crook, 1982).
In addition to the conventional
neuropsychological tests, participants performed the
dTDT (Heymann et al., 2018). They were asked to
draw a tree from their memory with a digital pen on a
Microsoft Surface Pro 3 digitizer with no time limit
for painting. Windows 8.1 Pro software was
implemented on this multi-touch digital device with
an Intel Core i7-4650U processor (1.7 - 3.3 GHz).
The size of the display area was 25.4 times 16.9 cm
with a resolution of 2160 x 1440. The participants
could hold the display upright or crosswise by
drawing and were able to choose between 3 lines
widths and 12 different colours. The participants
became familiar with the device in drawing one
sample-tree before the actual test started.
The impact of dTDT variables was analysed using
logistic regression models adjusted for age, education
level and gender. Receiver operating characteristic
(ROC) curves of the logistic models and areas under
curves (AUCs) were calculated and compared.
Sensitivities and specificities of different models
based on Youden-index cut-points were calculated.
All statistical calculations were done using SAS
(Version 9.4) and p-values < .05 were considered
significant.
3 RESULTS
The study population included 67 cognitive healthy
subjects (Controls; mean age 65.9 ± 10.3 years; 25
females) and 56 patients with early Alzheimer’s
disease (early AD; mean age 72.7 ± 9.2 years; 40
females).
The years of education were on average 3 years
lower in the early AD (11 years) compared to control
(14 years). The percentage of females was higher in
the group of early AD (71%) compared to the control
group (37%) and early AD subjects were on average
6.8 years older. These demographic differences
suggest an adjustment in the logistic model analysis
for age, gender and education. A brief summary of the
subjects’ characteristics is given in Table 1.
Table 1: Means, standard deviations (SD), median (Med)
and interquartile range (IQR) of clinical and demographic
characteristics.
N Mean SD Med IQR
Control
Male/female 42/25
Age(yrs.) 67 65.9 10.3 65 [59,74]
Education(yrs.) 66 14.1 3.0 15 [12,17]
GDS 67 2.1 2.0 1 [0,4]
MMSE 67 29.3 0.8 29 [29,30]
CDT 67 1.2 0.6 1 [1,1]
EarlyAD
Male/female 16/40
Age(yrs.) 56 72.7 9.2 74 [67,80]
Education(yrs.) 56 11.1 2.9 11 [8,13]
GDS 56 3.1 2.2 3 [2,4.5]
MMSE 55 22.3 2.9 22 [20,25]
CDT 56 2.8 0.9 3 [3,3]
GDS=Geriatric Depression Scale; MMSE=Mini Ment al State
Examination;CDT=ClockDrawingTest.
Figure 1 illustrates examples of tree drawings
from two subjects of the control group, and two
subjects from the early AD group. As can be seen, the
pictures clearly differ in their use of colours.
However, there are also obvious differences in the
shaping and the complexity of the pictures.
Analysis of the Use of Colour for Early Detection of Dementia
317
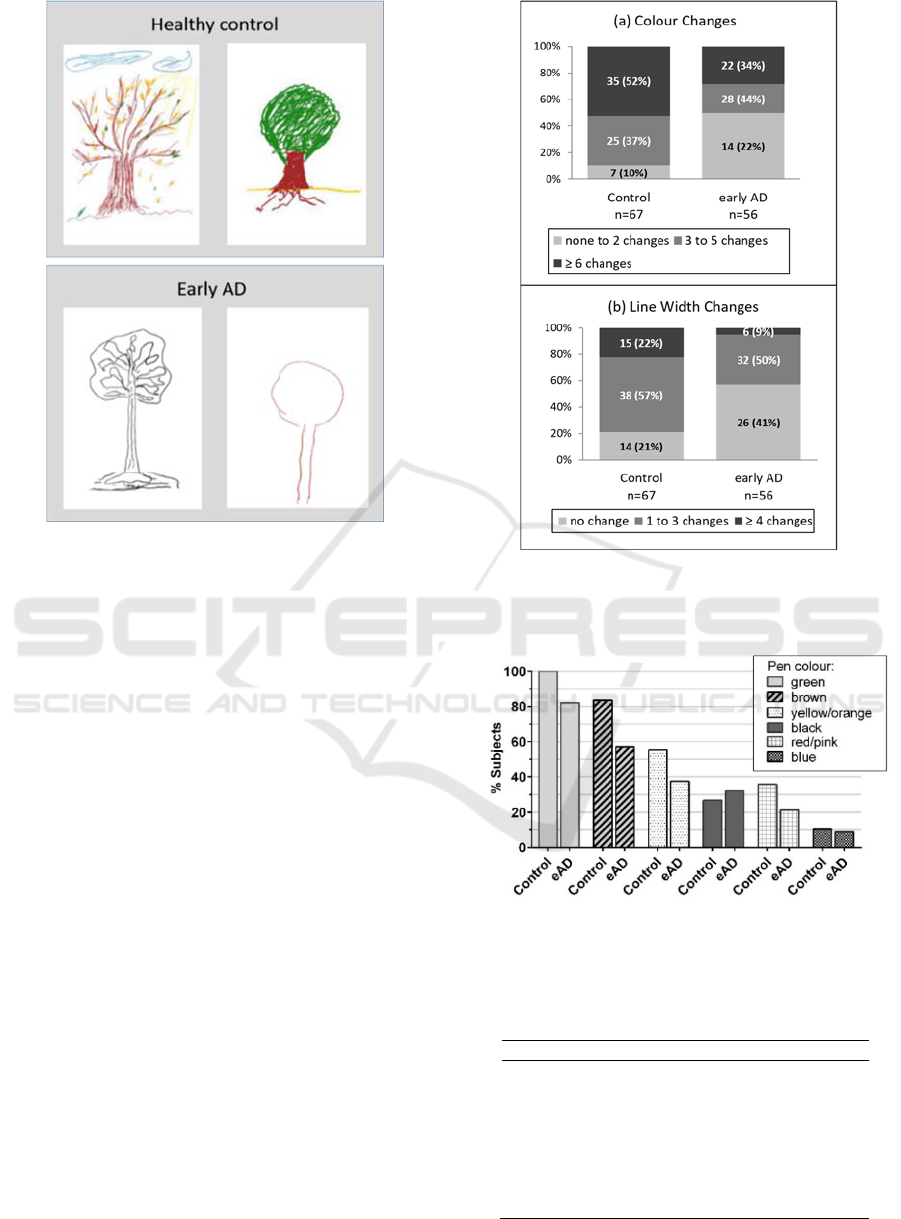
Figure 1: Examples of digital tree drawings of two healthy
controls and two early AD participants.
Number of Colour- and Line Width Changes
There were significant differences in the number of
line width and colour changes during the painting
process between the subject groups (Figure 2, all p-
values of chi-square test < .0001) with less colour and
line width changes in cognitive impaired patients
compared to healthy subjects. Fifty percent of the
patients with early AD only used one colour
compared to 10% in the control group.
Number of Different Colours and Line Widths
In both subject groups, the most used colours were
green and brown, followed by yellow-orange. Except
for black, all colours were more often used by healthy
subjects (Figure 3).
There was a significant difference in the mean
number of used colours and line widths between
healthy and early AD subjects (Table 2, p-values
<.001), indicating less colour and line width
variations in cognitive impaired individuals.
Figure 2: Number and percentages (in brackets) of subjects
with number of colour and line width changes during the
drawing process.
Figure 3: Percentage of subjects using a specific colour,
grouped by healthy control and early AD (eAD).
Table 2: Means, standard deviations (SD), median (Med)
and interquartile range (IQR) of dTDT characteristics.
Mean SD Med IQR
Control
No.ofcolours 4.6 1.8 4 [3,6]
No.ofline
widths 2.2 0.8 2 [2,3]
EarlyAD
No.ofcolours 3.3 1.6 3 [2.5,4]
No.ofline
widths 1.6 0.7 1 [1,2]
HEALTHINF 2020 - 13th International Conference on Health Informatics
318
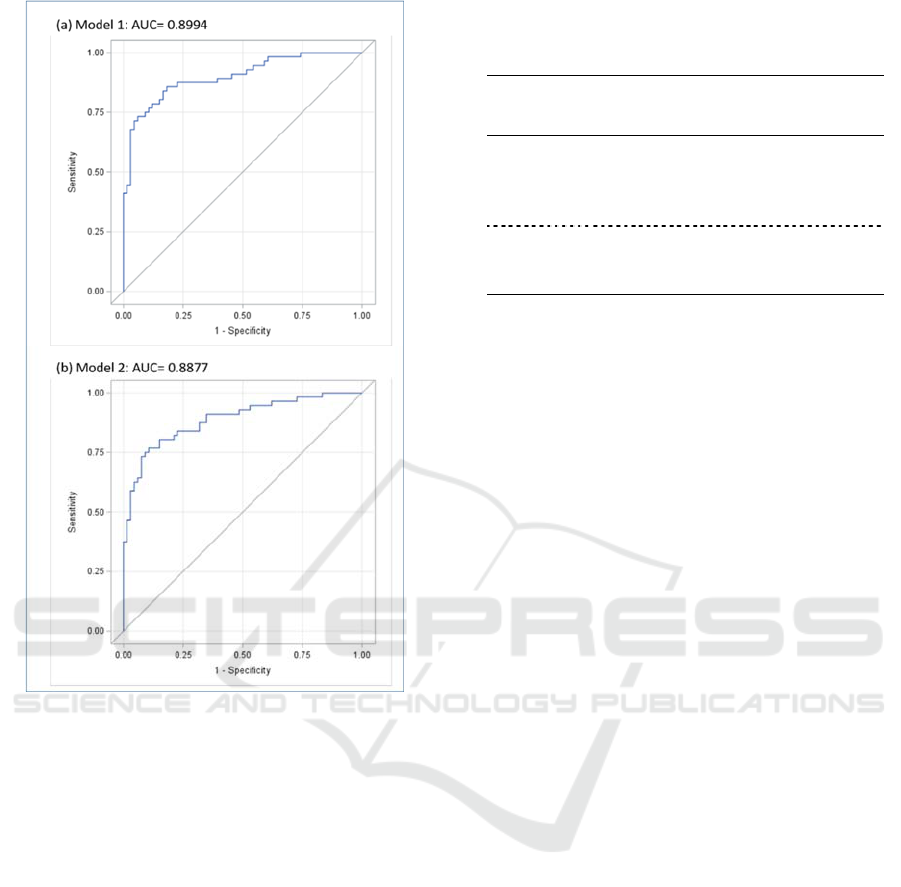
Figure 4: ROC-curves of model 1 (a) with number of
colours, number of line widths and average velocity as
factors and model 2 (b) with number of line widths and
average velocity as factors. Both models were adjusted for
age, gender and years of education.
Table 3 summarizes the results of the two logistic
regression models with and without colour variables
included (model 1 and model 2, respectively). Both
models were adjusted by age, gender and education
level by including these variables as covariates. In
both models, the number of used line widths is a
significant and stable predictor with ORs of 0.328
(model 1) and 0.283 (model 2). The same stability
holds for the average velocity of the strokes, which is
quite comparable within both models (ORs of 0.840
and 0.850). The AUC’s of the ROC-curves based on
both logistic regression models (figure 4) ranged
between 0.89 (model 2, without colours) and 0.90
(model 1), indicating only a slight loss of
discrimination power for model 2. Youden-Index
calculations resulted in sensitivities of 86% (model 1)
and 77% (model 2) and in specificities of 82% (model
1) and 89% (model 2).
Table 3: Results of logistic regression of healthy controls
(n=67) versus patients with early AD (n=56). Models
adjusted for gender, age and education.
Model
AUC
Spec.
%
Sens.
%
Variable OR 95%CI
OR
1 .90 82 86 Colours 0.67 [0.47,0.97]
Line
widths
0.33 [0.17,0.64]
Velocity 0.84 [0.74,0.96]
2 .89 89 77 Line
widths
0.28 [0.15,0.54]
Velocity 0.85 [0.74,0.97]
AUC: Area under curve of receiver operating curve, ß: Estimated
logistic regression coefficient, OR: Odds ratio, CI
OR
: Confidence
Interval of odds ratio; Specificity (Spec.) and Sensitivity (Sens.)
are based on Youden-Index calculations.
4 CONCLUSIONS
In accordance with the literature we observed reduced
colour variations in the images of early AD patients
and found a good separation of healthy from early AD
subjects by combining the number of used colours
with the average painting velocity and the number of
line width changes (ROC AUC=0.90).
After omitting the colour information from the
logistic regression the corresponding AUC was still
good and only slightly smaller (AUC= 0.89), but the
Youden-index calculation revealed a reduction in
sensitivity (0.77).
Several drawing deficits have been reported with
early stages of AD, e.g. image simplifications,
reduced image sizes and disorders of spatial relations
and perspectives (Gragnaniello, Kessler, Bley, &
Mielke, 1998; Heymann et al., 2018; Trojano &
Gainotti, 2016). Paintings of AD patients have been
described as a reduction in colour variations with a
preference to yellow-red in early stages and a
tendency to darker colours in later stages (Lee et al.,
2015; Maurer & Prvulovic, 2004). Results of Wijk et
al. (Wijk et al., 1999) and Pache et al. (Pache et al.,
2003) suggest colour vision deficiencies in AD
patients with difficulties in discriminating between
blue-green colours.
One limitation of the current study is its small
sample size and the results have to be validated in
larger clinical settings. The differences concerning
demographic parameters as age, gender, and
education level, indicated an adjustment in the
logistic regression model. With larger sample sizes,
pre analysis matching of subjects can be applied to
avoid demographic differences between subject
groups.
Analysis of the Use of Colour for Early Detection of Dementia
319

In further analyses, the percentage composition of
colours should be examined, too, as this might be an
important characteristic for identifying patients with
early AD.
Our results suggest that the number of colours
used in a free tree-drawing task has an impact on
discriminating healthy subjects from patients with
early AD. Nevertheless, a good separation of both
subject groups was also achieved by only including
the average velocity and the number of stroke
changes in the ROC-curve analysis.
REFERENCES
Freedman, M., Leach, L., Kaplan, E., Winocur, G.,
Shulman, K., & Delis, D. C. (1994). Clock Drawing: A
Neuropsychological Analysis: Oxford University
Press.
Gragnaniello, D., Kessler, J., Bley, M., & Mielke, R.
(1998). Copying and free drawing by patients with
Alzheimer disease of different dementia stages.
Nervenarzt, 69(11), 991-998.
Heymann, P., Gienger, R., Hett, A., Muller, S., Laske, C.,
Robens, S., Loy,R.,Ostermann, T., Elbing, U. (2018).
Early Detection of Alzheimer's Disease Based on the
Patient's Creative Drawing Process: First Results with
a Novel Neuropsychological Testing Method. J
Alzheimers Dis, 63(2), 675-687.
Lee, Y. T., Tsai, Y. C., & Chen, L. K. (2015). Progressive
changes in artistic performance of a Chinese master
with Alzheimer's disease. Cortex, 69, 282-283.
Maurer, K., & Prvulovic, D. (2004). Paintings of an artist
with Alzheimer's disease: visuoconstructural deficits
during dementia. J Neural Transm (Vienna), 111(3),
235-245.
McKhann, G., Drachman, D., Folstein, M., Katzman, R.,
Price, D., & Stadlan, E. M. (1984). Clinical diagnosis
of Alzheimer's disease: report of the NINCDS-ADRDA
Work Group under the auspices of Department of
Health and Human Services Task Force on Alzheimer's
Disease. Neurology, 34(7), 939-944.
Muller, S., Preische, O., Heymann, P., Elbing, U., & Laske,
C. (2017). Increased Diagnostic Accuracy of Digital vs.
Conventional Clock Drawing Test for Discrimination
of Patients in the Early Course of Alzheimer's Disease
from Cognitively Healthy Individuals. Front Aging
Neurosci, 9, 101.
Pache, M., Smeets, C. H., Gasio, P. F., Savaskan, E.,
Flammer, J., Wirz-Justice, A., & Kaiser, H. J. (2003).
Colour vision deficiencies in Alzheimer's disease. Age
Ageing, 32(4), 422-426.
Reisberg, B., Ferris, S. H., de Leon, M. J., & Crook, T.
(1982). The Global Deterioration Scale for assessment
of primary degenerative dementia. Am J Psychiatry,
139(9), 1136-1139.
Robens, S., Heymann, P., Gienger, R., Hett, A., Muller, S.,
Laske, C., Loy,R.,Ostermann, T., Elbing, U. (2019).
The Digital Tree Drawing Test for Screening of Early
Dementia: An Explorative Study Comparing Healthy
Controls, Patients with Mild Cognitive Impairment, and
Patients with Early Dementia of the Alzheimer Type. J
Alzheimers Dis, 68(4), 1561-1574.
Robens, S., Ostermann, T., Unger, S., Heyman, P., Müller,
S., Laske, C., & Elbing, U. (2019). Digital Picture Co-
occurrence Texture Characteristics Discriminate
between Patients with Early Dementia of Alzheimer’s
Type and Cognitive Healthy Subjects. 12th
International Conference on Health Informatics.
Safar, L. T., & Press, D. Z. (2011). Art and the Brain:
Effects of Dementia on Art Production in Art Therapy.
Art Therapy, 28(3), 96-103.
Shin, M. S., Park, S. Y., Park, S. R., Seol, S. H., & Kwon,
J. S. (2006). Clinical and empirical applications of the
Rey-Osterrieth Complex Figure Test. Nat Protoc, 1(2),
892-899.
Shulman, K. I., Gold, D. P., Cohen, C. A., & Zucchero, C.
A. (1993). Clockdrawing and dementia in the
community: A longitudinal study. Int J Geriatr
Psychiatry, 8(6), 487-496. doi:doi:10.1002/gps.
930080606
Souillard-Mandar, W., Davis, R., Rudin, C., Au, R., Libon,
D. J., Swenson, R., Price, C.C., Lamar, M., & Penney,
D. L. (2016). Learning Classification Models of
Cognitive Conditions from Subtle Behaviors in the
Digital Clock Drawing Test. Mach Learn, 102(3), 393-
441.
Trojano, L., & Gainotti, G. (2016). Drawing Disorders in
Alzheimer's Disease and Other Forms of Dementia. J
Alzheimers Dis, 53(1), 31-52.
Wijk, H., Berg, S., Sivik, L., & Steen, B. (1999). Colour
discrimination, colour naming and colour preferences
among individuals with Alzheimer's disease. Int J
Geriatr Psychiatry, 14(12), 1000-1005.
HEALTHINF 2020 - 13th International Conference on Health Informatics
320
