
Segmentation of Diabetic Retinopathy Lesions by Deep Learning:
Achievements and Limitations
Pedro Furtado
a
CISUC, Universidade de Coimbra, Polo II, Coimbra, Portugal
Keywords:
Medical Imaging, Deep Learning, Segmentation, EFI.
Abstract:
Analysis of Eye Fundus Images (EFI) allows early diagnosis and grading of Diabetic Retinopathy (DR), de-
tecting micro-aneurisms, exudates, haemorrhages, neo-vascularizations and other signs. Automated detection
of individual lesions helps visualizing, characterizing and determining degree of DR. Today modified deep
convolution neural networks (DCNNs) are state-of-the-art in most segmentation tasks. But the task of seg-
menting lesions in EFI is challenging due to sizes, varying shapes, similarity and lack of contrast with other
parts of the EFI, so that the results are ambiguous. In this paper we test two DCNNs to do a preliminary eval-
uation of the strengths and limitations using publicly available data. We already conclude that the accuracies
are good but the segmentations still have relevant deficiencies. Based on this, we identify the need for further
assessment and suggest future work to improve segmentation approaches.
1 INTRODUCTION
Diabetic Retinopathy (DR) is a fast-progressing dis-
ease, often resulting in blindness, early diagnosis is
crucial to prevent further damage. Analysis of Eye
Fundus Images (EFI) allows detection of lesions and
the degree of DR. In earliest stages, a few micro-
aneurisms can be seen in the EFI (enlarged capillaries
resembling small red dots, e.g. less than 5) (Wilkin-
son et al., 2003). Later stages may include exudates
(which are yellow deposits corresponding to proteins
and lipids) (Oliveira, 2012) and haemorrhages. The
number of micro-aneurisms may also have increased.
In later (Proliferative) Diabetic retinopathy there is
neo-vascularization (Jaafar et al., 2011) and related
lesions.
Automated detection allows the medical doctor
to visualize the lesions, characterize them and con-
clude regarding the degree of DR (Wilkinson et al.,
2003). Deep convolution neural networks (DCNN)
are state-of-the-art in segmentation of medical im-
ages. Totally automated lesion detection can be
based in those segmentation DCNNs. A DCNN is
built and trained based on error back-propagation on
groundtruth images and corresponding segmentation
masks. A DCNN architecture designed for segmen-
tation has two main stages, encoding and decoding.
The encoding stage is similar to a deep convolution
a
https://orcid.org/0000-0001-6054-637X
neural network (DCNN), with convolution layers suc-
cessively compressing the image into smaller feature
maps. The fully-connected layer is replaced by addi-
tional convolution layers followed by up-sampling or
deconvolution layers that create outputs with larger
sizes than the inputs, this way successively restoring
the original image size. Training consists in giving
images as inputs and the backpropagation learning al-
gorithm iteratively backpropagates the error between
the correct segmentation masks given as groundtruth
and the output of the encode+decode network, thus
effectively learning how to segment images for a spe-
cific purpose.
DCNNs are most often cited as achieving very
high accuracies in either classification or segmenta-
tion, therefore we wanted to test the quality of seg-
mentation in lesion detection. There are several dif-
ficult challenges in the task, in particular the small
sizes of many lesions, microaneurisms and others,
varied lesion morphologies and also some similar-
ity of colour and texture between lesions and other
structures, such as parts of the vascular tree. In or-
der to train and experiment with segmentation DC-
NNs, both eye fundus images and corresponding le-
sion mask groundtruths are needed. The Indian Di-
abetic Retinopathy Image Dataset (IDRiD) (Porwal
and Meriaudeau, 2019) is such a dataset, prepared for
experimentation with identification, localization and
segmentation of lesions and structures in the EFI. Ac-
Furtado, P.
Segmentation of Diabetic Retinopathy Lesions by Deep Learning: Achievements and Limitations.
DOI: 10.5220/0008881100950101
In Proceedings of the 13th International Joint Conference on Biomedical Engineering Systems and Technologies (BIOSTEC 2020) - Volume 2: BIOIMAGING, pages 95-101
ISBN: 978-989-758-398-8; ISSN: 2184-4305
Copyright
c
2022 by SCITEPRESS – Science and Technology Publications, Lda. All rights reserved
95
cording to its authors, IDRID dataset is the only one
having pixel-level annotations of diabetic retinopathy
lesions and of other retinal structures. This dataset
provides information on the disease severity of di-
abetic retinopathy, and diabetic macular edema for
each image. This makes it perfect for development
and evaluation of image analysis algorithms for early
detection of diabetic retinopathy”. The first sub-
challenge of IDRID, of especial interest to our current
work, is segmentation of retinal lesions associated
with diabetic retinopathy, microaneurysms, haemor-
rhages, hard exudates and soft exudates.
In this work we do some preliminary testing with
two DCNNs to provide evidence for the research
questions: What is the accuracy segmenting DR le-
sions, and are there significant limitations? We pro-
vide preliminary evidence, and suggest future work to
evaluate and improve the solutions.
The paper is structured as follows: section 2 re-
views related work. Section 3 discusses materials and
methods, in effect summarily introducing the two ar-
chitectures tested, the dataset and the experimental
setup. Results are shown and analyzed in detail in
section 4, section 5 concluding the paper.
We end the current section by illustrating the seg-
mentation context using an example image. The
problem of segmenting diabetic retinopathy lesions
equates to finding, identifying and outlining microa-
neurysms (MA), soft exudates (SE), hard exudates
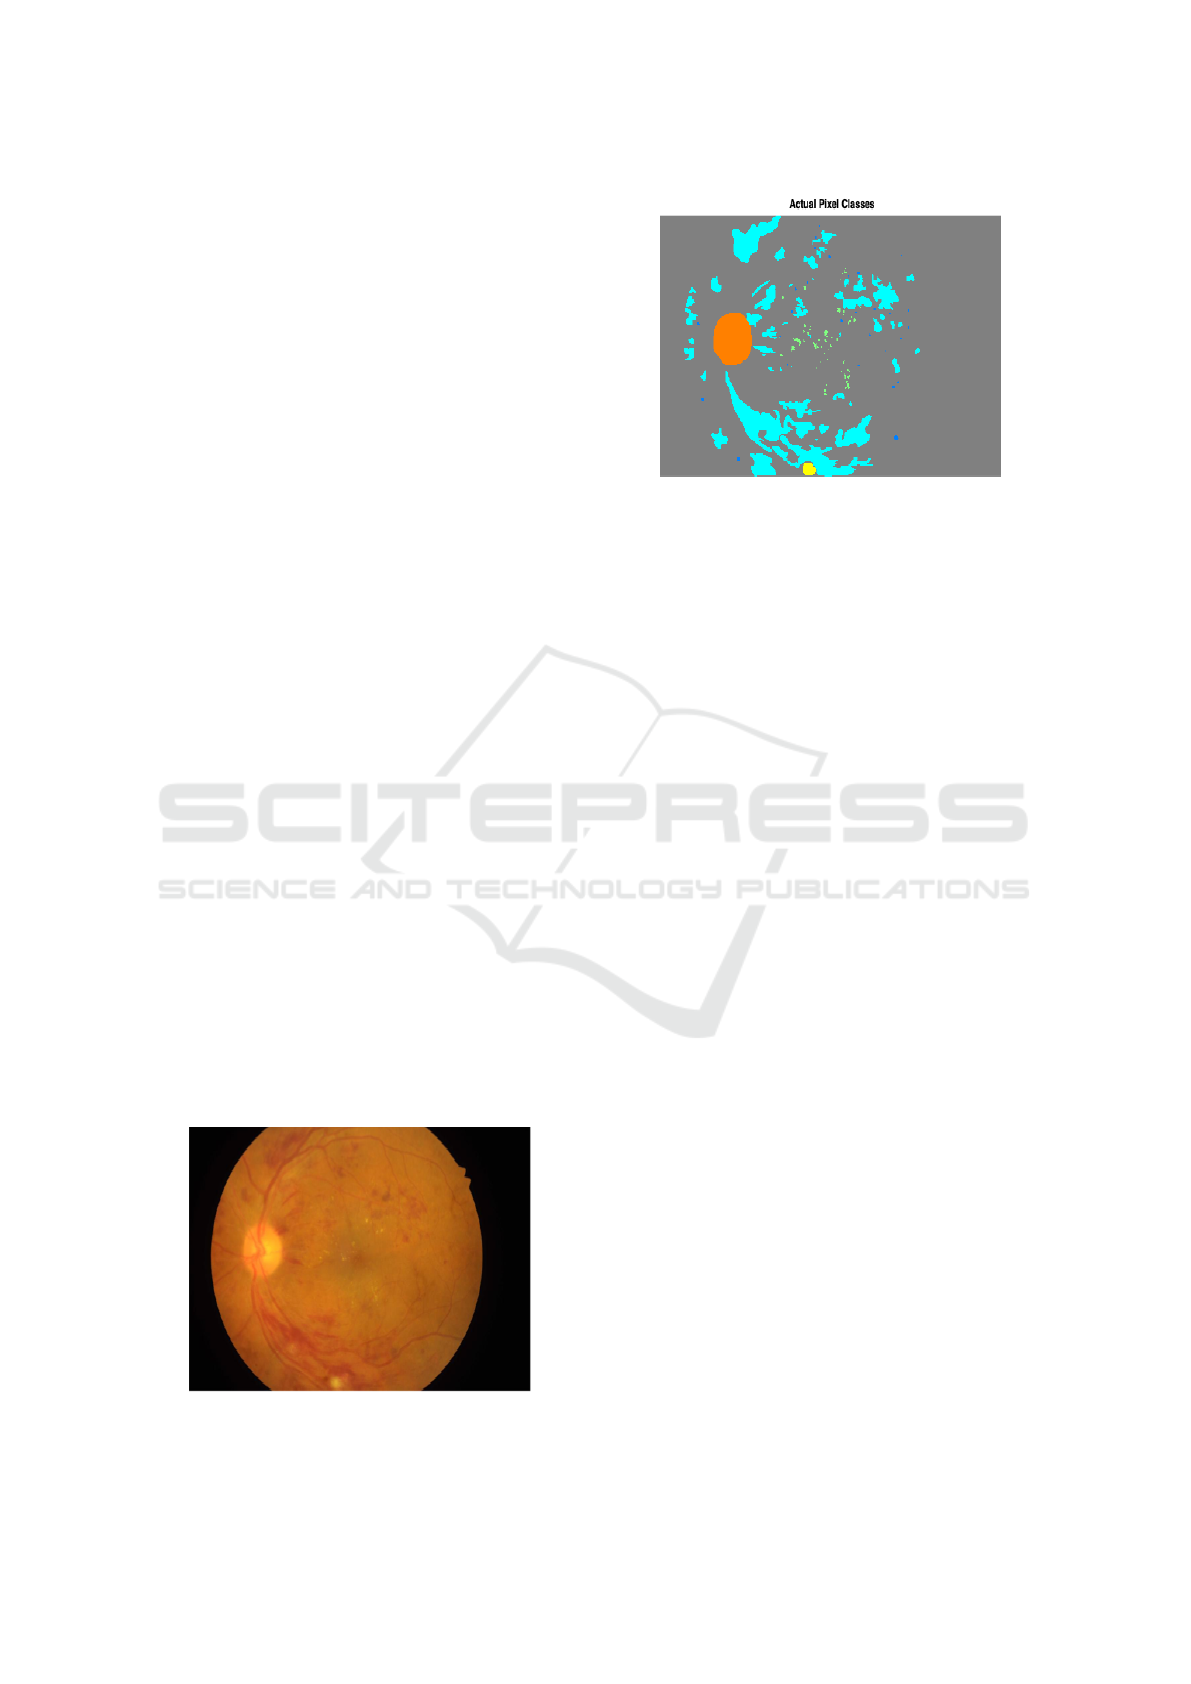
(EX) and hemorrhages (HE) in EFI images. Figure
1 shows an example EFI from IDRID dataset, and
Figure 2 shows the corresponding groundtruth mask
detecting the lesions and the optic disk structure as
well. Put very simply, the optic disk is a big rounded
yellowish region, haemorrhages are blood-coloured
regions, microaneurisms are very small red dots and
exudates are small yellowish plus larger yellowish re-
gions. Figure 1 is the EFI image, Figure 2 is the pix-
elmap groundtruth with actual lesions and optic disk
locations.
Figure 1: Example EFI.
Figure 2: Example EFI GT pixelmap.
2 RELATED WORK
The Indian Diabetic Retinopathy Image challenge
(IDRiD) (Porwal and Meriaudeau, 2019) is a chal-
lenge for segmentation of EFI images that supplies
a dataset with pixel-level annotations of diabetic
retinopathy lesions and of other retinal structures. The
aim of the challenge, posed as part of the organiza-
tion of the ”Diabetic Retinopathy: Segmentation and
Grading Challenge” workshop at IEEE International
Symposium on Biomedical Imaging (ISBI-2018), is
to evaluate algorithms for automated detection and
grading of diabetic retinopathy and diabetic macu-
lar edema using retinal fundus images, and in par-
ticular sub-challenge 1 involves segmentation of reti-
nal lesions associated with diabetic retinopathy. The
IDRiD leaderboard for sub-challenge 1 shows a set
of results ranked by score of segmentation of mi-
croaneursms (MA), hard exudates (HE), soft exudates
(SE) and haemorrhages (EX) score. The scores are
very far from perfection (whch would be a value of
1). Consequently, it is important to evaluate the qual-
ity of these deep learning approaches on the task.
In this paper we test two DCNN architectures and
do a preliminary analysis of the results to draw con-
clusions regarding achievements and limitations of
the approaches. Segmentation of biological structures
using deep learning has been the focus of much re-
search in latest years, and (Menze et al., ) (BRATS,
2014) already featured works applying deep convolu-
tion neural networks to segment brain tumours and
structures (Davy, 2014)(Urban et al., 2014)(ZikicD
et al., 2014), with for instance (ZikicD et al., 2014)
reporting 83.7+-9.4 accuracy on brain tumor tissues
versus 76.3+-12.4 for non-deep learning randomized
forests. Since then segmentation deep learning net-
works based on DCNNs became the standard in seg-
mentation tasks.
BIOIMAGING 2020 - 7th International Conference on Bioimaging
96

There has been some prior evidence in related
works that deep segmentation networks can have
some difficulties with variability and size of seg-
mented objects. For instance, in (Badrinarayanan
et al., 2017) the authors evaluate and compare ap-
proaches on a SUN RGB-D dataset (Song et al., 2015)
(a very challenging and large dataset of indoor scenes
with 5,285 training and 5,050 testing images). The
results have shown that all the deep architectures
share low Intersect over Union and boundary met-
rics, where larger classes have reasonable accuracy
and smaller classes have lower accuracies.
Next, we briefly review some of the milestones
in the evolution of deep learning segmentation net-
works, from the first ones to DeepLabV3 and alike.
The Fully Convolutional Network (FCN) for image
segmentation was proposed in [14]. It modified well-
known architectures, such as VGG16 [15], replacing
all the fully connected layers by convolutional lay-
ers with large receptive fields and adding up-sampling
layers based on simple interpolation filters. Only the
convolutions part of the network was fine-tuned to
learn deconvolution indirectly. The authors achieved
more than 62% on the Intersect over Union (IoU)
metric over the 2012 PASCAL VOC segmentation
challenge using pretrained models on the 2012 Im-
ageNet dataset. The authors in (Noh et al., 2015)
proposed an improved semantic segmentation algo-
rithm, by learning a deconvolution network. The con-
volutional layers are also adapted from VGG16, while
the deconvolution network is composed of deconvolu-
tion and unpooling layers, which identify pixel-wise
class labels and predict segmentation masks. The
proposed approach reached 72.5% IoU on the same
PASCAL VOC 2012 dataset. (Ronneberger et al.,
2015) proposed the U-Net, a DCNN specially de-
signed for segmentation of biomedical images. The
authors trained the network end-to-end from very few
images and outperformed the prior best method (a
sliding-window convolutional network) on the ISBI
challenge for segmentation of neuronal structures in
electron microscopic stacks. The contracting part of
the U-Net computes features, while the deconvolution
part localizes patterns spatially in the image. The con-
tracting part has an FCN-like architecture, extracting
features with 3x3 convolutions, while the expanding
part uses deconvolutions to reduce the number of fea-
ture maps while increasing the size of the images.
Cropped feature maps from the contracting part are
also copied into the expanding part to avoid losing
pattern information. At the end, a 1x1 convolution
processes the feature maps to generate a segmenta-
tion map assigning a label to each pixel of the input
image. DeepLab (Chen et al., 2017) proposed three
main innovations. Convolutions with upsampled fil-
ters, or ‘atrous convolution’, explicitly controls the
resolution at which feature responses are computed
and enlarges the field-of-view of filters to incorporate
larger contexts without increasing the number of pa-
rameters or the amount of computation. Atrous con-
volution is also known as dilated convolution, consist-
ing of filters targeting sparse pixels with a fixed rate.
Atrous spatial pyramid pooling (ASPP) segments ob-
jects at multiple scales, by probing incoming convolu-
tional feature layers with filters at multiple sampling
rates and effective fields-of-views, thus capturing ob-
jects as well as image context at multiple scales. Fi-
nally, localization of object boundaries is improved
by combining methods from deep convolution neural
networks (DCNNs) and probabilistic graphical mod-
els. This is done by combining the responses at
the final DCNN layer with a fully connected Condi-
tional Random Field (CRF), which improves localiza-
tion both qualitatively and quantitatively. “DeepLab”
achieved 79.7% IoU on PASCAL VOC-2012 seman-
tic image segmentation task, and improvement over
(Long et al., 2015) and (Noh et al., 2015).
3 MATERIALS AND METHOD
For this work we apply one of the most recent and
best performing DCNN segmentation network archi-
tectures, DeepLabV3 (Chen et al., 2017), and also
Segnet (Badrinarayanan et al., 2017), for comparison
purposes. In this section we review the two architec-
tures briefly and the IDRiD dataset that was used in
our experimental analysis. Finally, we discuss train-
ing setup, timings and results.
3.1 DCNN Architectures
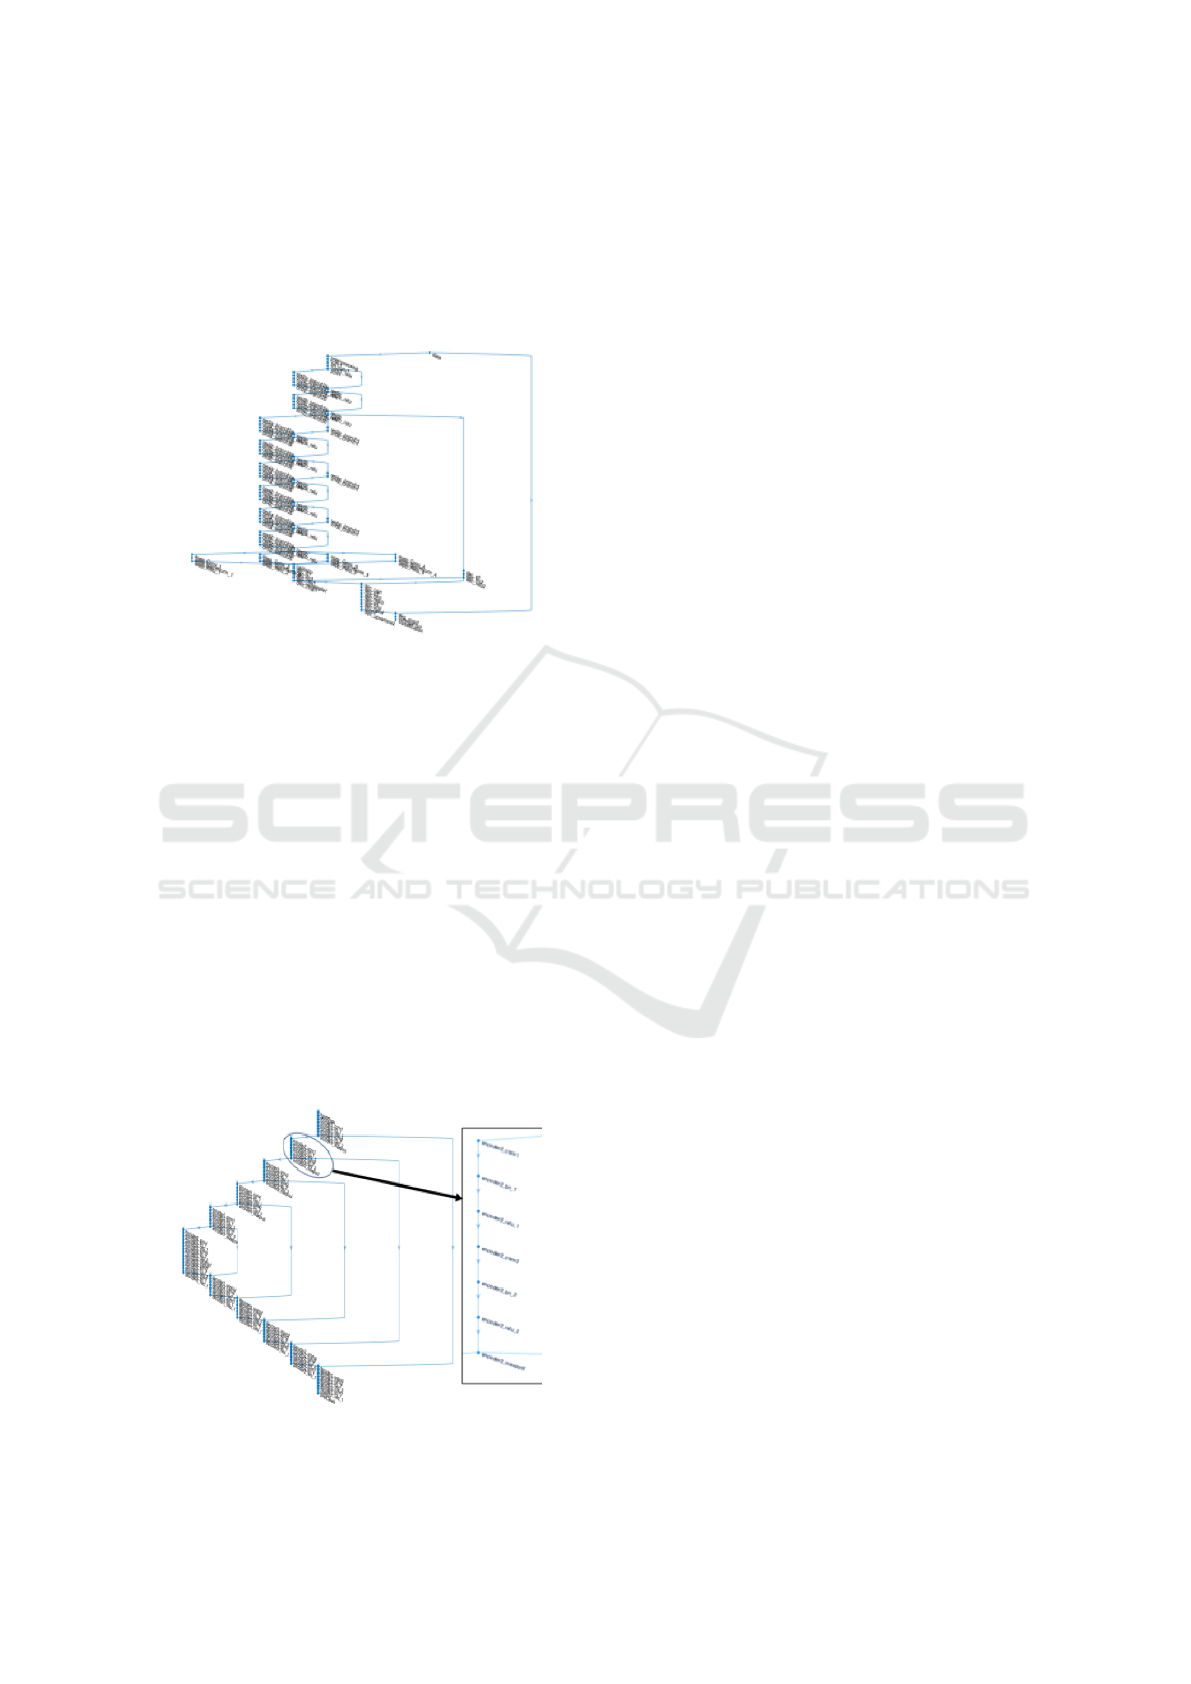
The DeepLabV3 (Chen et al., 2017) architecture in
this work uses imageNet’s pretrained Resnet-18 net-
work, with atrous convolutions as its main feature ex-
tractor. DeepLabV3 introduces a set of innovations.
Figure 3 shows a plot of the overall architecture of
DeepLabV3 we used. First of all, it uses multiscale
processing, by passing multiple rescaled versions of
original images to parallel CNN branches (Image
pyramid) and by using multiple parallel atrous convo-
lutional layers with different sampling rates (ASPP).
In the modified ResNet model, the last ResNet block
uses atrous convolutions with different dilation rates,
and Atrous Spatial Pyramid Pooling and bilinear up-
sampling are used in the decoder module on top of the
modified ResNet block. Additionally, structured pre-
diction is done by fully connected Conditional Ran-
dom Field (CRF). CRF is a postprocessing step used
Segmentation of Diabetic Retinopathy Lesions by Deep Learning: Achievements and Limitations
97
to improve segmentation results, a graphical model
which ‘smooths’ segmentation based on the underly-
ing image intensities. CRF works based on the obser-
vation that similar intensity pixels tend to be labeled
as the same class. CRFs can typically boost scores by
1-2%.
Figure 3: Matlab2019 plot of DeepLabV3 net.
Segnet is another deep convolutional encoder-
decoder architecture for image segmentation pro-
posed in (Badrinarayanan et al., 2017) and shown
in Figure 3, with 5 encoder and 5 decoder “stages”,
plus the central encoder-decoder stage, resulting in
a total of 87 layers and corresponding connections.
At the encoder, convolutions and max pooling are
performed. There are 13 convolutional layers from
VGG-16. Each encoder stage is made of two suc-
cessive conv+bn+relu layers (bn is batch normaliza-
tion), plus 2x2 max pooling, with the correspond-
ing max pooling indices (locations) used as forward
connecting links, to perform non-linear up-sampling.
Each decoder stage does unpool (using the pooling in-
dices), followed by two deconv+bn+relu. The last two
layers are softmax and the pixel classification layer,
with weight balancing.
Figure 4: Matlab2019 plot of Segnet.
3.2 The IDRID Dataset
The challenge of the Indian Diabetic Retinopathy Im-
age Dataset (IDRiD) (Porwal and Meriaudeau, 2019)
is to evaluate algorithms for automated detection and
grading of diabetic retinopathy and diabetic macu-
lar edema using retinal fundus images. According
to the organizers of the challenge, “IDRiD is the
only dataset constituting typical diabetic retinopathy
lesions and normal retinal structures annotated at a
pixel level. The dataset provides information on the
disease severity of diabetic retinopathy, and diabetic
macular edema for each image. This makes it per-
fect for development and evaluation of image analy-
sis algorithms for early detection of diabetic retinopa-
thy. In particular, the lesion segmentation task of the
challenge aims at segmenting retinal lesions associ-
ated with diabetic retinopathy, which can be microa-
neurysms, hemorrhages, hard exudates and soft ex-
udates. The task also includes identifying and seg-
menting the optic disc correctly”. The fundus im-
ages in IDRiD were captured by a retinal special-
ist at an Eye Clinic located in Nanded, Maharash-
tra, India. From the thousands of examinations avail-
able, 516 images were extracted to form the dataset
(from which 81 were selected for the lesion segmen-
tation sub-challenge). Experts verified that all im-
ages are of adequate quality, clinically relevant, that
no image is duplicated and that a reasonable mix-
ture of disease stratification representative of diabetic
retinopathy (DR) and diabetic macular edema (DME)
is present. The medical experts graded the full set of
516 images with a variety of pathological conditions
of DR and DME.
The images were acquired using a Kowa VX-10
alpha digital fundus camera with 50-degree field of
view (FOV), and all are centered near to the macula.
The images have a resolution of 4288x2848 pixels
and are stored in jpg file format. The size of each im-
age is about 800 KB. This dataset for the lesion seg-
mentation sub-challenge consists of 81 colour fundus
images with signs of DR. Precise pixel level annota-
tion of abnormalities associated with DR like microa-
neurysms (MA), soft exudates (SE), hard exudates
(EX) and hemorrhages (HE) is provided as a binary
mask for performance evaluation of individual lesion
segmentation techniques. It includes color fundus im-
ages (.jpg files) and binary masks made of lesions (.tif
files). Number of images (some images contain multi-
ple lesions) with binary masks available for particular
lesion is given as follows: MA – 81, EX – 81, HE –
80, SE – 40. In addition to all the abnormalities, bi-
nary masks for the optic disc region are provided for
all 81 images.
BIOIMAGING 2020 - 7th International Conference on Bioimaging
98
3.3 Experimental Setup
The original IDRiD training dataset was divided
randomly into 5 folds with 80%/20% combinations
used by choosing one of the folds as test data
and the remaining dataset as train data. Our ex-
periments involved evaluating DeepLabV3 and Seg-
net in the task of segmenting the IDRiD dataset.
The networks and experimental setup were imple-
mented in Matlab2018, and the networks were mod-
ified to balance class weights. The following ini-
tial training options were used, the validation pa-
tience was set to infinite and the number of train-
ing epochs was set to 500, but an interactive training
progress view and manual stopping option allowed us
to stop when visual inspection of the training curve
showed that the training progress converged to a fi-
nal steady state. MR classNames=[”BackGround”,
”MA”, ”HE”, ”SE”, ”EX”]; ’LearnRateSchedule’ =
’piecewise’, ’LearnRateDropPeriod’ = 10, ’LearnRat-
eDropFactor’=0.8, ’Momentum’, 0.9, ’InitialLearn-
Rate’, 0.001; ’MaxEpochs’=500, ’MiniBatchSize’=8,
’Shuffle’=’every-epoch’, ’Plots’=’training-progress’,
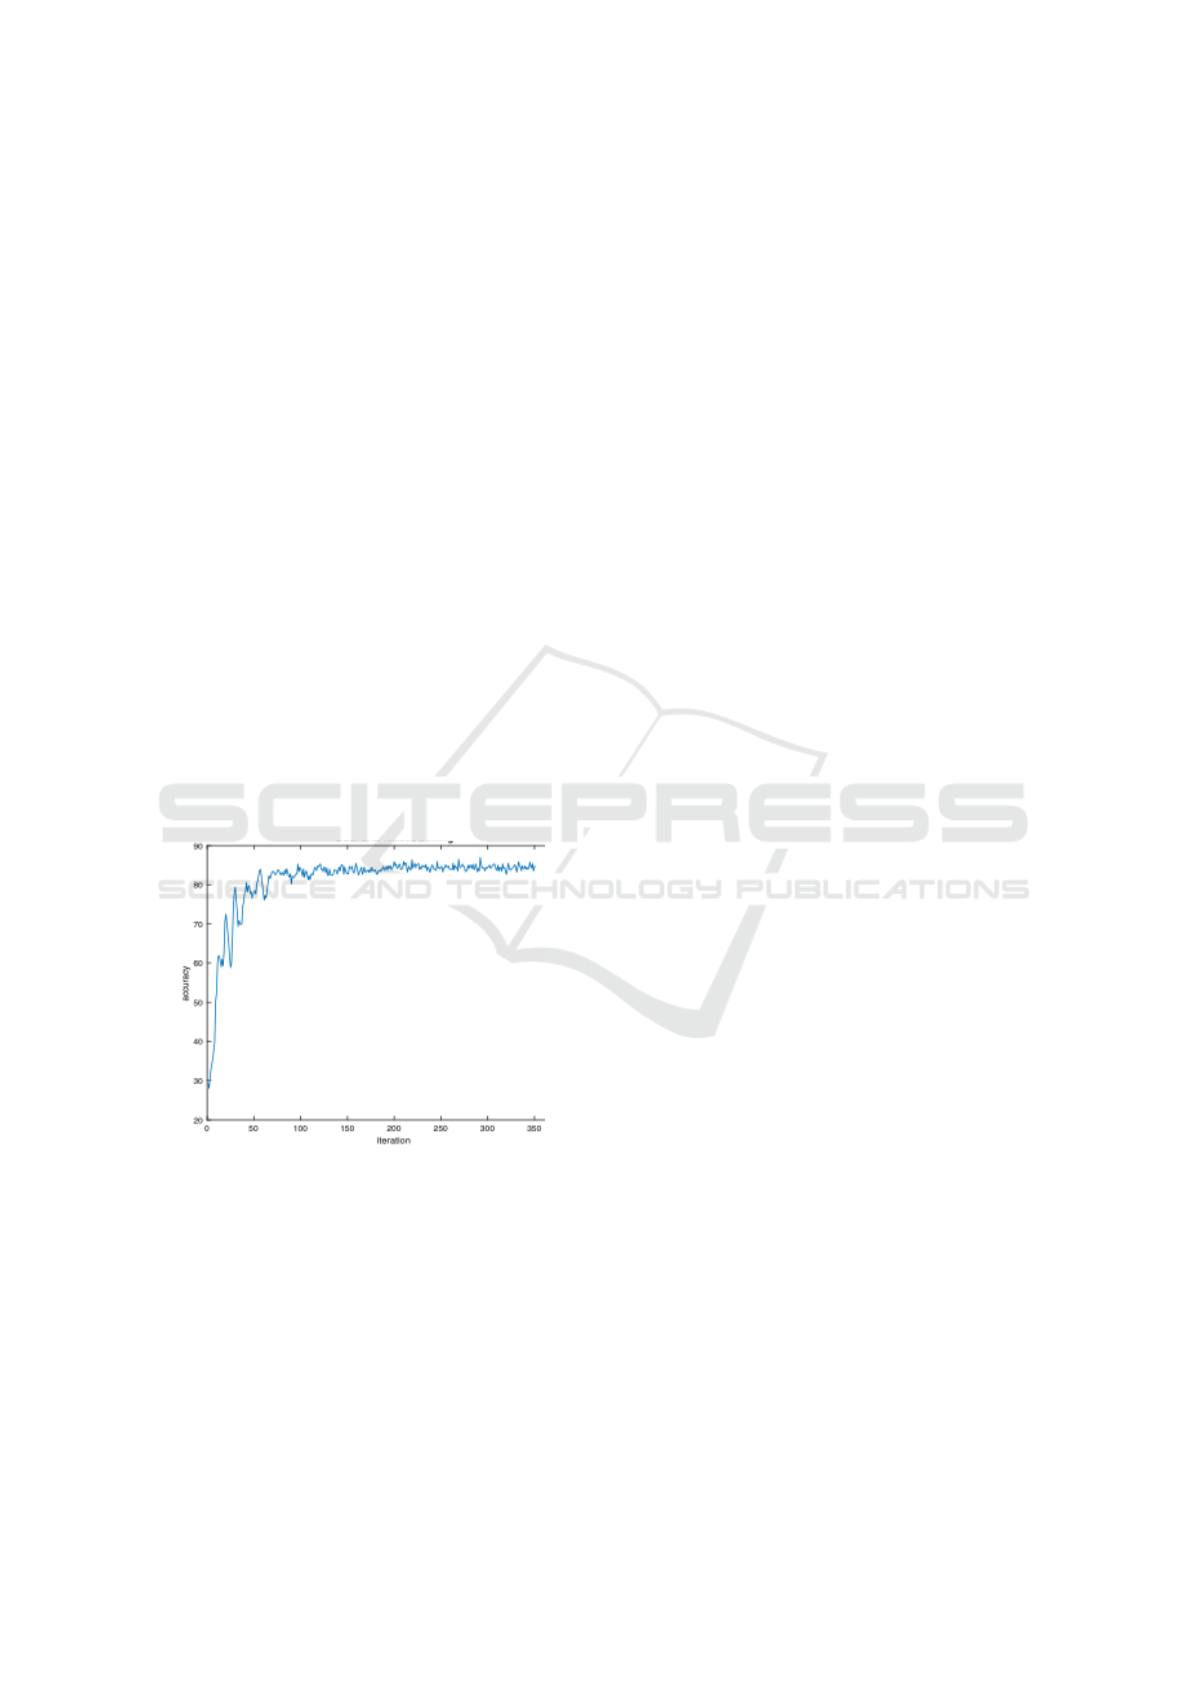
’ValidationPatience’=Inf; Average training time of
DeepLabV3 was 19 mins, Segnet was 362 minutes.
Figure 5 is a depiction of deepLabV3 training accu-
racy evolution along iterations.
Figure 5: Evolution of DeepLabV3 training accuracy.
3.4 Analysis Metrics
The metrics used to analyse the results are some of
the most commonly available in DCNN toolboxes, in-
cluding accuracy and intersect-over-the-union (IoU)
or Jaccard Index. The IoU is one of the most
commonly used metrics for evaluating segmentation
(sometimes the Dice coefficient is used instead, how-
ever the two are highly positively correlated). In prac-
tice, all these metrics are useful in the evaluation of
segmentation outcomes, each one returning an impor-
tant interpretation of what is observed. Importantly,
we analyse the results not only overall (global accu-
racy, mean accuracy, mean IoU, weighted IoU), but
considering each class (lesion) separately (per-class
accuracy, IoU). The use of these metrics was funda-
mental to allow us to reach relevant conclusions re-
garding the strengths and limitations.
4 RESULTS
After training the networks with IDRiD we proceeded
to analyse and interpret the results. Section 4.1. visu-
alizes sample images and corresponding results. This
gives an initial impression of the quality of segmenta-
tion, although still only specific cases. In section 4.2.
we report numerical results using the defined metrics,
analyze and interpret those results. This allows us to
conclude regarding the quality, strengths and limita-
tions of the approaches, together with suggestion of
more evaluation and future work.
4.1 Visualizing Sample Images
Visual inspection helps verify the segmentation re-
sult on samples, a preliminary way to test the qual-
ity of segmentation. Figure 6 and Figure 7 show the
groundtruth (left) and segmentation (right) results for
two sample EFI using DeepLabV3 and Segnet. Fig-
ure 8 and Figure 9 shows the results for another im-
age. DeepLabV3 was able to segment the optic disk
almost perfectly in both samples, and it was also able
to detect and match many of the lesions, verified by
the similar lesion patterns in the groundtruth and the
segmentation itself. However, many background pix-
els were also identified as lesions. The same phenom-
ena is seen in Segnet, but there the false positives are
much more prevalent, together with more wrong pixel
classifications.
The main conclusion from inspection of these im-
ages is that DeepLabV3 seems to segment better, but
both DCNNs confuse parts of the background as le-
sions.
Figure 10 and Table 1 shows the evaluation of the
tested approaches based on global metrics (those that
evaluate over all pixels). Table 2 shows the metric
Intersection-over-the-union for each lesion.
4.2 Results and Analysis
Global accuracy metrics (Figure 10 and Table 1): the
results of DeepLabV3 reveal that global accuracy,
mean accuracy and weighted IoU are good (80 to
Segmentation of Diabetic Retinopathy Lesions by Deep Learning: Achievements and Limitations
99
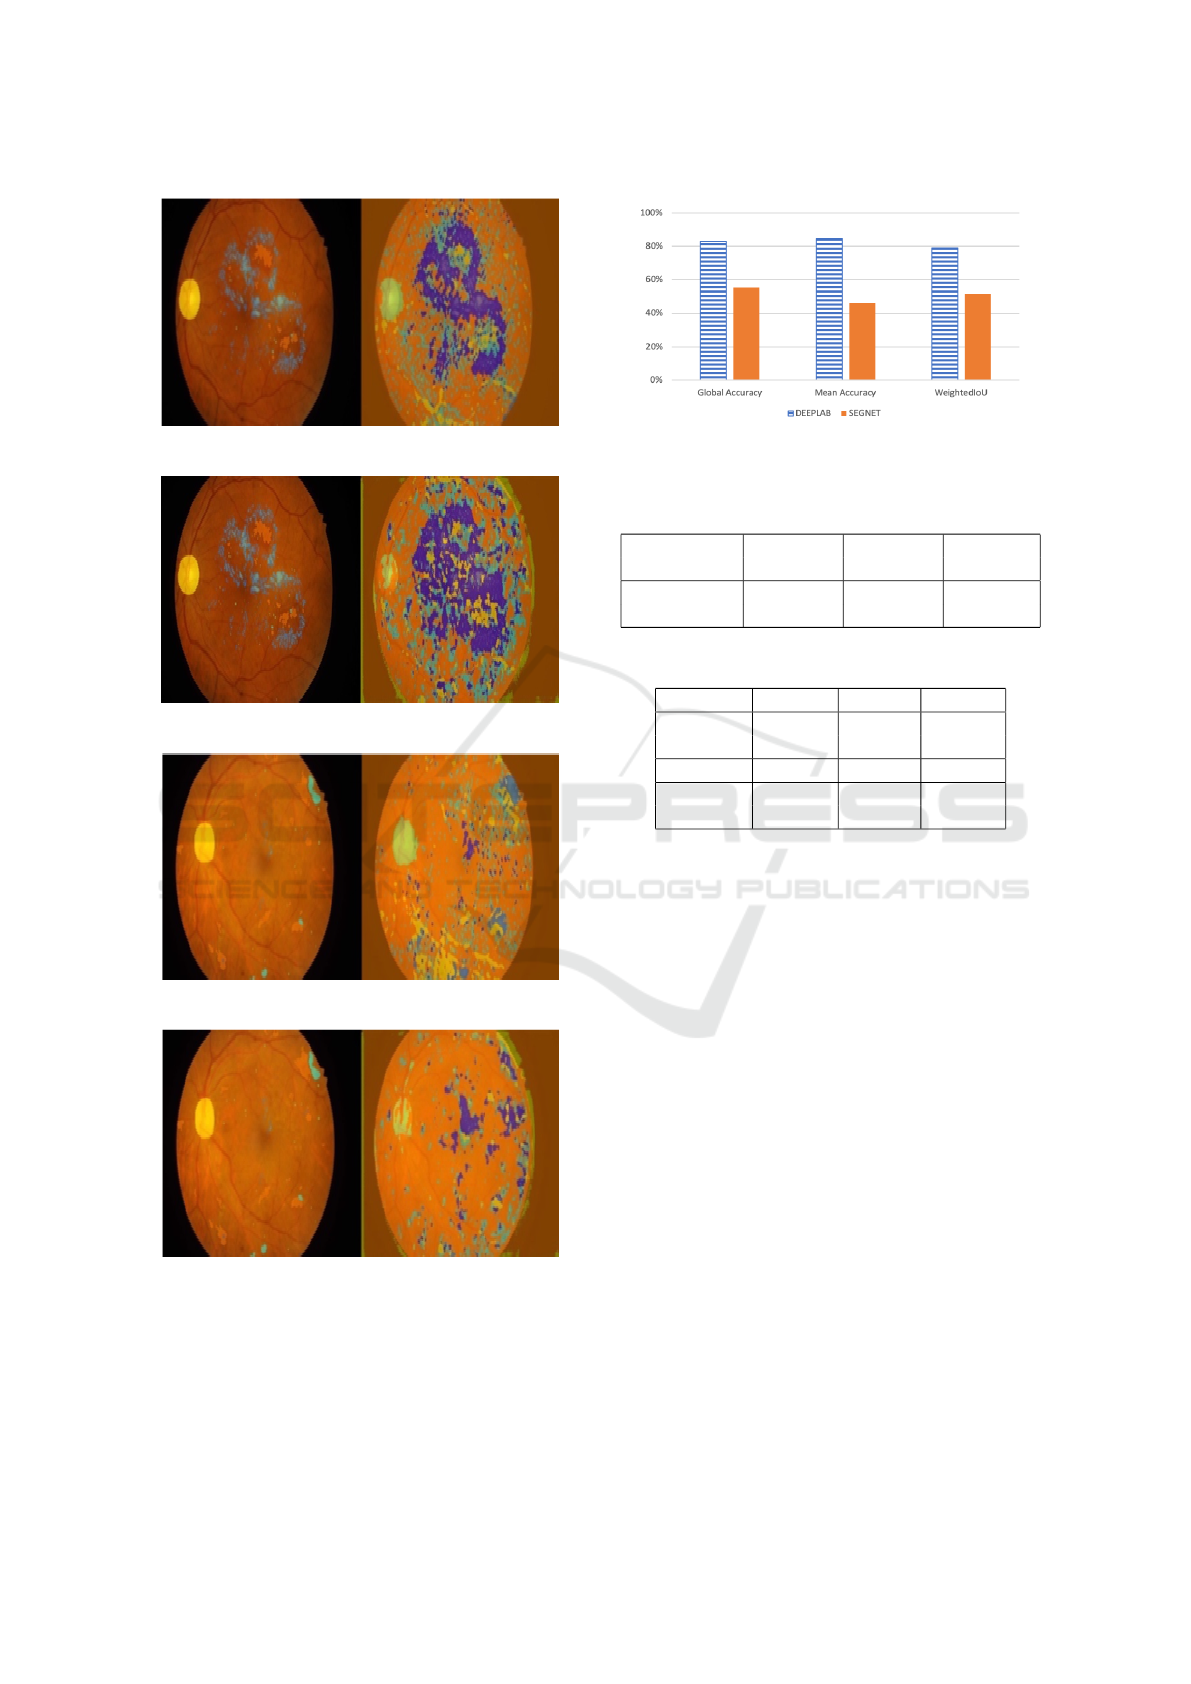
Figure 6: Segmentation of EFI image 1 (DeepLabV3).
Figure 7: Segmentation of EFI image 1 (Segnet).
Figure 8: Segmentation of EFI image 2 (DeepLabV3).
Figure 9: Segmentation of EFI image 2 (Segnet).
87%). Segnet has much worse results in all those met-
rics (47% to 57%), confirming that DeepLabV3 seg-
mentation results are much better than those of Seg-
net.
The IoU of each lesion, however, reveals that
the degree of matching of result segments with
Figure 10: Accuracy comparison.
Table 1: Comparison of accuracy (technique and data
setup).
Method Global Mean weighted
Accuracy Accuracy IoU
DeppLabV3 88% 82% 80%
Segnet 57% 47% 54%
Table 2: Comparison of IoU (technique and lesion).
Method Backg OpticD SoftEx
DeepLab 84% 71% 15%
Segnet 52% 18% 2%
Method HardEx Haemo MAneu
DeepLab 17% 21% 2%
Segnet 3% 15% 2%
groundtruth regions is only good for the background
and the optic disk in both approaches, much worse al-
ways in the case of Segnet. Good accuracy but bad
IoU of DeepLabV3 means the approach is good iden-
tifying lesion pixels but at the expense of wrongly
classifying many background pixels as lesions. These
results provide an indication that there are definite de-
ficiencies in the deep learning approaches applied to
segmentation of this kind of images. Further study,
evaluation and analysis of deep learning approaches
applied to this kind of problem is necessary, as well
as identification of the main limitations and proposals
of improvement avenues.
5 CONCLUSIONS AND FUTURE
WORK
Segmentation of medical images is a hard task in the
presence of difficulties such as lack of contrast, con-
fusion between structures and plasticity of shapes and
textures, among others. In this work we compared
two DCNN segmentation architectures in the task of
segmentation of lesions in Eye Fundus Images (EFI).
We defined the two typical DCNN segmentation ar-
BIOIMAGING 2020 - 7th International Conference on Bioimaging
100

chitectures and used a public dataset to experiment
with training and then testing segmentation of lesions
on EFI. By analysis of the results we concluded that
the best performing approach (DeepLabV3) was com-
petent segmenting lesions, but we also found that
there is a low degree of matching of segments to
groundtruth regions, which means that current state-
of-the-art still needs significant improvement. This
was a preliminary study, we propose as future work
a more complete evaluation and analysis of the ap-
proaches, plus proposal of possible improvements and
solutions to the problem.
ACKNOWLEDGMENTS
We use the IDRiD challenge dataset for this work
(Porwal and Meriaudeau, 2019). We would like there-
fore to thank the IDRiD challenge organizers for shar-
ing the dataset and making this work possible.
REFERENCES
Badrinarayanan, V., Kendall, A., and Cipolla, R. (2017).
Segnet: A deep convolutional encoder-decoder archi-
tecture for image segmentation. In In IEEE transac-
tions on pattern analysis and machine intelligence,,
pages 2481–2495.
BRATS (2014). Brain tumour segmentation
challenge. [URL Accessed 8/2019]. URL:
https://sites.google.com/site/miccaibrats2014/.
Chen, L. C., Papandreou, G., Kokkinos, I., Murphy, K., and
Yuille, A. L. (2017). Deeplab: Semantic image seg-
mentation with deep convolutional nets, atrous convo-
lution, and fully connected crfs”. In In IEEE trans-
actions on pattern analysis and machine intelligence,,
pages 834–848.
Davy, A. (2014). Brain tumor segmentation with deep neu-
ral networks. In Proceedings of Multimodal Brain Tu-
mour Segmentation Challenge.
Jaafar, H., Nandi, A., and Al-Nuaimy (2011). Automated
detection and grading of hard exudates from retinal
fundus images. In in European Signal Processing
Conference,, pages 66–70.
Long, J., Shelhamer, E., and Darrell, T. (2015). Fully con-
volutional networks for semantic segmentation. In
Proceedings of the IEEE conference on computer vi-
sion and pattern recognition, pages 3431–3440.
Menze, B. H., Jakab, A., Bauer, S., Kalpathy-Cramer, J.,
Farahani, K., and Kirby, J. The multimodal brain
tumor image segmentation benchmark (brats)",.
IEEE Transactions on Medical Imaging, pages 1993–
2024.
Noh, H., Hong, S., and Han, B. (2015). Learning decon-
volution network for semantic segmentation”. In In
Proceedings of the IEEE international conference on
computer vision, pages 1520–1528.
Oliveira, J. (2012). Estudo e desenvolvimento de tecnicas
de processamento de imagem para identificacao de pa-
tologias em imagem de fundo do olho. Biomedical
Engineering Thesis, U. Minho.
Porwal, Prasanna, S. P. R. K. M. K. G. D. V. S. and Meri-
audeau, F. (2019). Indian diabetic retinopathy image
dataset (idrid). IEEE Dataport.
Ronneberger, O., Fischer, P., and Brox, T. (2015). U-net:
Convolutional networks for biomedical image seg-
mentation”. In In International Conference on Medi-
cal image computing and computer-assisted interven-
tion, pages 234–241. Springer,, Cham.
Song, S., Lichtenberg, S. P., Xiao, J., and “SUN (2015).
Rgb-d: A rgb-d scene understanding benchmark suite.
In Proc. IEEE Conf. Comput. Vis. Pattern Recognit.,
pages 567–576.
Urban, G., Bendszus, M., Hamprecht, F., and Kleesiek1, J.
(2014). Multi-modal brain tumor segmentation using
deep convolutional neural networks. In Proceedings of
Multimodal Brain Tumour Segmentation Challenge.
Wilkinson, C., Ferris III, F. L., Klein, R. E., Lee, P. P.,
Agardh, C. D., Davis, M., Dills, D., Kampik, A.,
Pararajasegaram, R., Verdaguer, J. T., et al. (2003).
Proposed international clinical diabetic retinopathy
and diabetic macular edema disease severity scales.
Ophthalmology, 110(9):1677–1682.
ZikicD, I. Y., Brown, M., and A., C. (2014). Segmentation
of brain tumor tissues with convolutional neural net-
works. In Proceedings of Multimodal Brain Tumour
Segmentation Challenge.
Segmentation of Diabetic Retinopathy Lesions by Deep Learning: Achievements and Limitations
101
