
Examination of Interpersonal Attachment with the Help of a Digital
Tablet Application: A Proof of Concept Study
Sebastian Unger
1,3
, Cony Theis
2
and Thomas Ostermann
3
1
Didactics and Educational Research in Health Science, Faculty of Health, Witten/Herdecke University, Germany
2
Fine Arts, University of Applied Sciences and Arts Ottersberg, Germany
3
Department of Psychology and Psychotherapy, Faculty of Health, Witten/Herdecke University, Germany
Keywords: Interpersonal Attachment, Sizer Analysis, Digital Tablet Application, Screen Recording, C# Programming.
Abstract: At present, interpersonal attachment has a subordinate role in the field of healthcare, but recent research results
assume this as an important parameter, especially in prevention and mental health. Our aim was to develop a
digital application that extends the previous approaches with a measurement over a specific time interval.
Designed specifically for Windows-based tablets, this application performs a drawing test while capturing the
transitions of two mental states, transmitted by the users. The results were collected over a period of three
minutes, allowing the application itself, along with the SiZer analysis, to determine how closely the
participants were mentally connected. The tablet application has shown its first usefulness to enhance the
healthcare, but further investigations are strongly recommended. In addition, its ease to use allows an
uncomplicated integration into similar areas.
1 INTRODUCTION
Attachment describes the tendency of humans to seek
contact among themselves as a specific part of
interpersonal relationships (Fearon et al., 2017). It
addresses a bundle of topics from developmental
aspects (i.e. the relationship of children to their
parents) to adult relationships or group coherence
(Ein-Dor and Hirschberger, 2016). Recent studies
suggest that attachment on a higher level can also
contribute to understand socio cultural phenomena,
which may affect actual problems such as migration
or the feeling of social inequality (Sroufe, 2016).
In the field of healthcare, interpersonal attachment
has been ignored for a long time as a specific
parameter to enhance therapeutic outcome, i.e. in
group settings or in the field of individual care, giving
in nursing (Blanco et al, 2018). Recent research
suggests that such interpersonal relationships play an
important role for prevention and healthcare
especially in the field of mental health (Degnan et al.,
2016, Diener et al., 2011).
However, when it comes to measure attachment
dynamics, most of the approaches use questionnaire
assessments for single time points, i.e. using
questionnaires like the Interpersonal Relationship
Anxiety Questionnaire (Naz and Kauser, 2015) or
maternal and paternal antenatal attachment scales
(Göbel et al, 2019). Sándor et al. (2012) who used a
pictorial assessment for the description of
interpersonal relationship in children presented an
unconventional idea beyond questionnaires. Still, in a
similar context, it has already been proposed to
perform a detailed moment-by-moment analysis, as
assessments that only capture a snapshot may neglect
the fluidity and interactions of a parameter (Shaw et
al., 2019). Taking into account recent research on the
dynamics in the tree drawing process in patients with
Alzheimer’s disease (Robens et al., 2019) and based
on communications with art therapists, we developed
a prototype of a digital app to measure interpersonal
attachment over the course of time called IU, which
due to its easy to use design has a low threshold and
thus can be used in various contexts.
2 MATERIAL AND METHODS
2.1 Overall Description
As a new approach to determine interpersonal
attachment between two people, the digital tablet
application IU was created. The name IU has emerged
from the main function of the application, the
310
Unger, S., Theis, C. and Ostermann, T.
Examination of Interpersonal Attachment with the Help of a Digital Tablet Application: A Proof of Concept Study.
DOI: 10.5220/0008881003100315
In Proceedings of the 13th International Joint Conference on Biomedical Engineering Systems and Technologies (BIOSTEC 2020) - Volume 5: HEALTHINF, pages 310-315
ISBN: 978-989-758-398-8; ISSN: 2184-4305
Copyright © 2024 by Paper published under CC license (CC BY-NC-ND 4.0)

measurement of two mental states of a person (see
also Figure 3). The first state is to be with oneself and
the second is to be with the other. The letters “I” and
“U” stand for the English personal pronouns “I” and
“You”, representing these two states. In addition, the
IU is the first application that supports that kind of
data in a digital from used in a further step of
determining interpersonal attachment: the evaluation
of measurement results.
2.2 Setting
No ethical permission was required for this proof of
concept study in healthy subjects. However, each
participant had to sign a consent form. After agreeing
to participate, they were asked to sit opposite each
other in pairs, holding eye contact during the whole
drawing process. A tablet with an installed version of
the IU-App was in front of both. The starting point of
the digital pen was a centerline, which divides the
screen into two sections. The one closest to the
subject is defined as the “I”-state, while the area near
the counterpart is defined as the “U”-state. When
participants feel attached to the other, they are
advised to move their pen beyond the centerline
towards the “U”-state until they feel unconnected or
more connected to themselves. In that case, the pen is
moved to the “I”-state and probably crosses the
centerline. This process continues for three minutes
(min). Within this period, both participants have
created a line drawing. One example is presented in
Figure 1. Although the final drawings might look
similar, the attachment of participants might either be
“in touch”, meaning that both participants mainly
were interconnected with both pens, located in the
“U”-state, or they were not attached to each other,
resulting in different locations of the pen (“I” versus
“U”).
2.3 Hard- and Software
In order to ensure the user a realistic and best possible
drawing experience, the application was developed
especially for tablet computers with touch function,
using a digital pen or a finger as interaction medium.
The wide range of user acceptance of Windows
operating systems and the support of a stylus with
pressure sensitivity of 1024 for future purposes led to
use an ASUS Transformer Mini T102HA (see Figure
1) for these needs.
It is also equipped with a high definition (HD)
display, having a resolution of 1280 x 800 pixels, and
4 gigabytes (GB) of random-access memory (RAM),
resulting in adequate image quality and system
performance.
Figure 1: Data acquisition via ASUS Tablet.
As programming language for the back-end of the
application, C# was chosen. This dynamic language
is used by a growing community of developers and
convinces by its simple object model, small libraries
resulting in efficient syntax and coding which finally
enables more agile development (Thomas, 2008).
The used development environment was
Microsoft Visual Studios along with the .NET
framework 4.5.2. The framework is compatible to the
Microsoft Expression Encoder 4 application,
recording the tablet’s screen during the drawing, and
includes Windows Presentation Foundation (WPF),
an approach to a Graphical User Interface (GUI)
framework. The Extensible Markup Language
(XML)-based WPF was applied for designing the
front-end.
2.4 Functionality
The GUI of the application can be divided into three
main parts: First, the start page, second, the drawing
page and, third, the review page. All pages are
designed in order to be user-friendly according to the
same principle. They have a bar for selecting the
general functions on the top and interaction options
designed to be touchable.
The start page is the center of the IU. It shows up
after launching the application and is the same page
to close it again. Furthermore, users can switch to the
other two pages from this hub.
The data acquisition is accomplished in the
drawing page. The figure 2 shows the process up to
saving the result. At the beginning, users have to
provide some personal data. In addition to age, gender,
Examination of Interpersonal Attachment with the Help of a Digital Tablet Application: A Proof of Concept Study
311
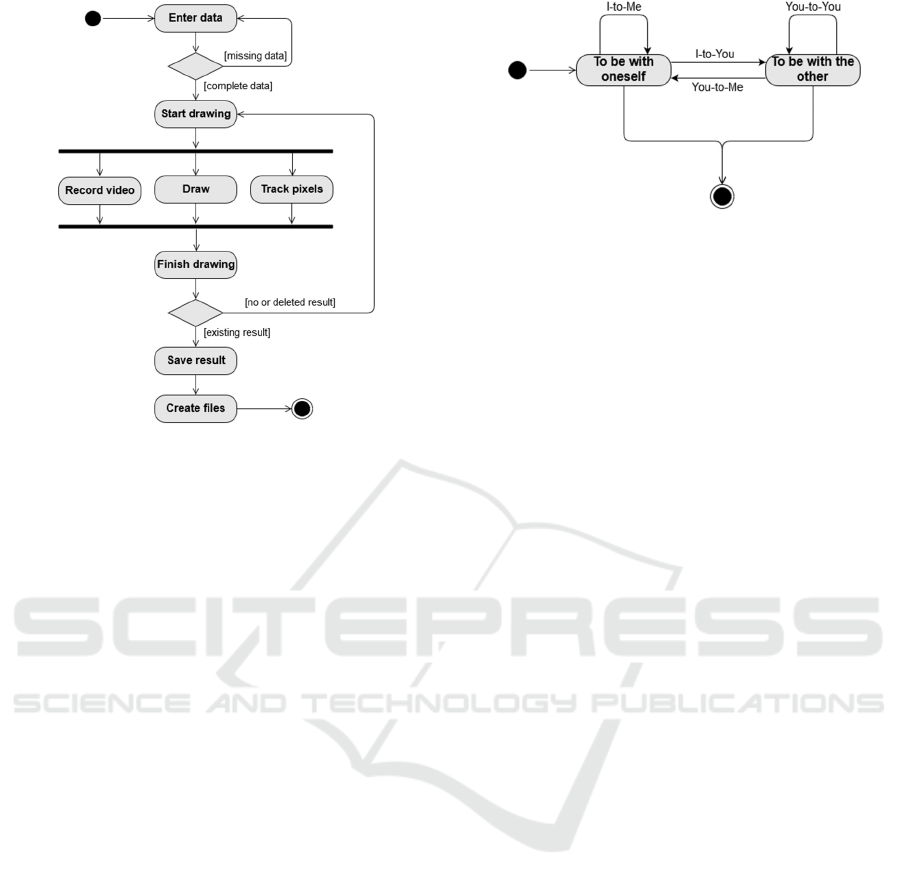
Figure 2: Activity diagram of the drawing page.
profession and user (identifier) ID a questionnaire on
social orientation was implemented. The
questionnaire consists of ten items with four possible
answers to choose. An ID to specify the measurement
itself is automatically generated from the current date
and time. Once the data is completed, the drawing can
be started. To clarify the beginning and the end of the
drawing, they are initiated by a beep sound. The
measurement has a fixed time span during which the
drawing is being recorded as video and coordinates
(x, y) of the touched screen pixels are being tracked
with an interval of 100 milliseconds (ms). After
finishing the measurement, users can decide to either
store or delete the current result including the
measured data and the drawn picture. If it gets
deleted, the measurement can easily be repeated. By
saving the result the IU generates a XML file for the
raw data, a Portable Network Graphics (PNG) file for
the picture and an Expression Encoder Screen
Capture (XESC) file for the video.
The visualization of results takes place on the last
of the three pages, the review page. To load a result,
a list box displays all available results by their ID
from where it can be chosen. The application imports
the data of the XML file. In addition to the personal
information, the transitions (see Figure 3) between
the states are displayed in percent. Each percentage is
calculated based on the length of stay in relation to
the total time. All information can be faded in and out.
The PNG and XESC file are being linked during
the load process. Simultaneously, a time course of the
y-coordinates is being created. The IU is designed to
show
only one of this visual information at a time.
Figure 3: Diagram of mental states.
Users can decide at which information they want to
look at. By selecting the video, they can pause and
play it at any time. Moreover, by selecting the time
course, they can add the time course of the partner for
comparison purposes as well.
2.5 Sizer Analysis
For statistical evaluation, the data analysis tool
SIgnificance of ZERo crossing of the differences
(SiZer) was used. It was first introduced with the goal
to identify and locate local extrema of a derivative
(Chaudhuri and Marron, 1999). Instead of coloring
these extrema as significant features, this extended
version of SiZer compares two time series based on
the difference of two kernel estimates (Park et al.,
2009).
The drawing process was analyzed on filtered data
from the XML files and displayed as time series t(y,
s), using the y-coordinate of the digital pen location
as outcome parameter. The SiZer tool uses a local
linear smoothing of length 2h around a measured
value for the time series to be considered. The value
h is also referred to statistically as bandwidth and is
varied for the comparison of the two time series, so
that smoothing windows with large and small
bandwidths arise. The smoothing is performed by the
least squares method, with the weights normally
being distributed. For each bandwidth h and each time
of the time series t the difference between the two
regression lines f
1,h
(t) and f
2,h
(t) is tested. Therefore,
the null hypothesis can be formulated as:
H
0
: f
1,h
(t) = f
2,h
(t) (1)
while the alternative hypothesis is:
H
1
: f
1,h
(t) ≠ f
2,h
(t) (2)
The test is carried out by using the properties of
the standard normal distribution over the confidence
interval (CI) of the difference between the empirically
ascertained adjustments:
f
1,h
(t) - f
2,h
(t)
(3)
HEALTHINF 2020 - 13th International Conference on Health Informatics
312
If the CI contains the value zero, then there is no
significance. Otherwise, if the zero is not contained,
the two adjustments are significantly different. Hence,
the initial name SiZer arises: SIgnificant ZERo
crossing of the derivatives. The SiZer analysis plots
the result of this test graphically over the time t and
the bandwidth h in the coordinate system (t, h). A blue
f
1,h
(t) > f
2,h
(t)
(4
)
or red point
f
1,h
(t) < f
2,h
(t)
(5
)
at the position (t, h) indicates a significant difference
in time series, while a purple dot does not mark a
significant difference. Inadequate data is shown in
grey in this illustration.
3 RESULTS
The first case presents two adults (male 18 and
diverse 58) which were familiar with each other as
nephew and uncle. After a total time of three min, the
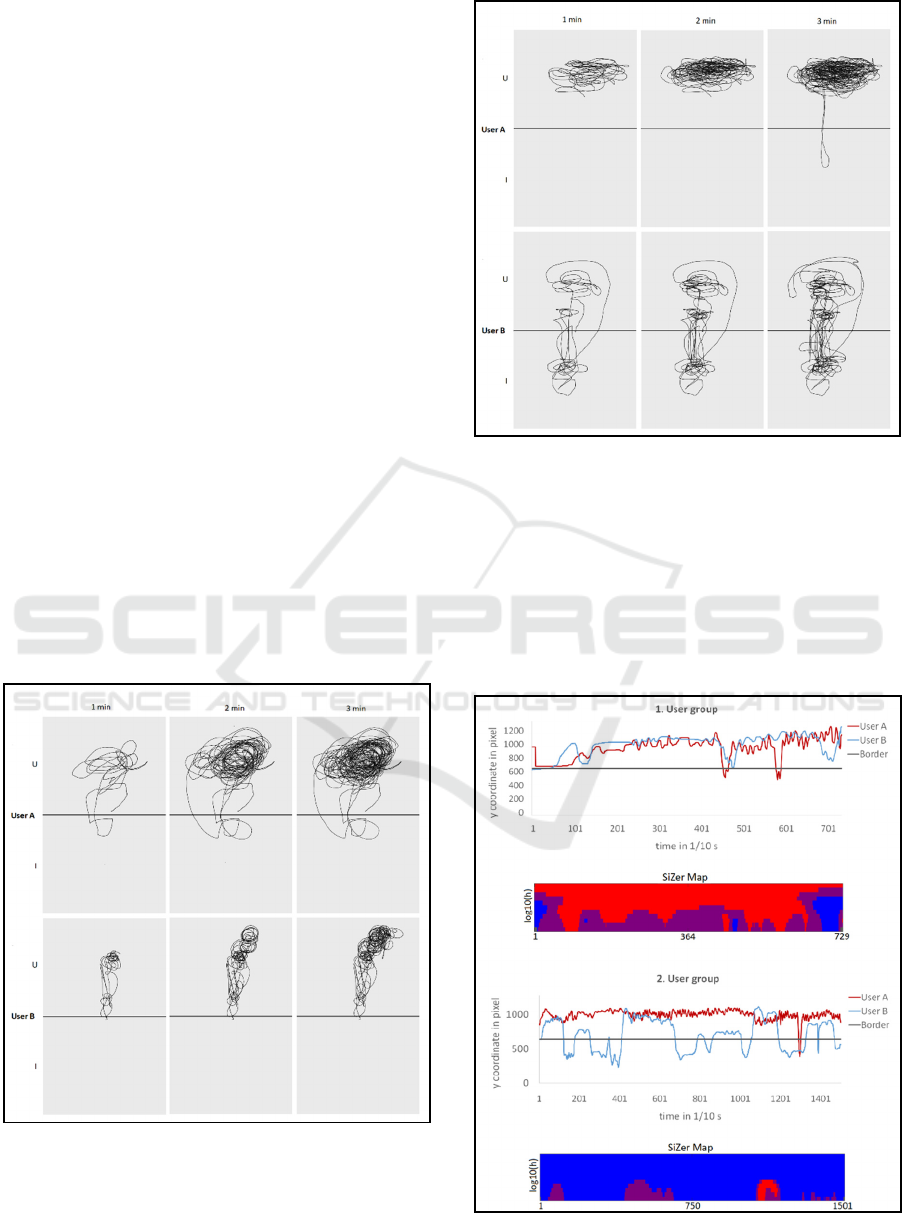
examination was completed. Figure 4 displays
snapshots, which were taken at intervals of 1 minute
from the videos recorded and played with the IU. As
can be seen already, there is an observable
congruence in the graphics, which may indicate a
high amount of interpersonal attachment.
Figure 4: Snapshots of test group A.
Another user pair with unknown relationship
(female 21 and male 26) represents the second case.
As shown in Figure 5, they have behaved completely
Figure 5: Snapshots of test group B.
different. While user A stayed on the partner’s side
most of the time (except for one move at a time of two
min and 35 seconds (s)), user B tried to attach his
counterpart several times. However, the SiZer plot
visualized no measurable response.
The complete drawing process in the course of
time together with the results of the SiZer analysis is
presented in figure 6.
Figure 6: Results of the SiZer analysis tool.
Examination of Interpersonal Attachment with the Help of a Digital Tablet Application: A Proof of Concept Study
313

As expected from the snapshots in Figure 4, a high
amount of similarity was found in the first two
participants. This is on the one hand indicated by
similar curves, which in 88 % (user A) and 91.4 %
(user B) of the time were above the border, depicted
by the black line. In the associated SiZer map (1. User
group), the purple pixels are widely distributed in
mostly the lower bandwidths, indicating a high
amount of correlation. This leads to the assumption
that the user pair was most of the time mentally
attached to each other. Thus, the null hypothesis in (1)
cannot be neglected.
In contrast to this and in accordance with Figure
5, the curves of the second two participants are
unequivocally different. User A remained 90.6 % and
user B only 54.9 % of the time above the border.
There is almost no correlation between these curves,
represented by the SiZer map (2. User group) with
mostly blue pixels in all bandwidths. Likewise, a
reflection of the y-coordinates of one of the users led
to a significant dissimilarity, confirming the
alternative hypothesis in (2). This suggests the
assumption that this user pair had completely
different trains of thought.
4 DISCUSSION
In this proof of concept study on the analysis of a
digital tablet application for the examination of
interpersonal attachment, we were able to measure
the attachment of two people by analyzing the drawn
lines on a tablet by the IU-App. That the first user
pair was mostly mentally attached could be associated
with nonverbal interpersonal synchrony such as
smiling or blinking, meaning that social-cognitive
functions such as self-esteem or the feeling of being
connected to the partner (Lumsden et al., 2014) might
be reflected in the synchronous trains of thought of a
familiar pair. This is supported by Ramseyer and
Tschacher (2011), who observed that nonverbal
synchrony is expressed in the perceived quality of the
relationship, which here is probably rated higher by
the first user pair than by the second user pair, whose
relationship is unknown. At least in our two
examples, we found a good correspondence between
the drawing process in the course of time and the
results of the SiZer analysis. Hence, a future study
with a higher number of participants should be
observed to obtain results that are more meaningful.
Moreover, it might be interesting to compare the
results with those of electroencephalography (EEG),
skin resistance or similar physiological measures.
Although the analysis of digital drawing
processes actually has been given a high amount of
attention in the field of health informatics, i.e. in the
analysis the tree drawing process of patients with
mental impairments such as dementia (Robens et al.,
2019), the kinematic analysis of the clock drawing
test in elderly people with depressive disorders
(Heinik et al., 2010) or the neuropsychological testing
of perceptual and motor skills in children (Lange-
Küttner, 1998), this application, to our knowledge, is
the first that uses a tablet application for the analysis
of interpersonal attachment.
In line of the suggestions of Zapata et al. (2015),
we were able to demonstrate that our app is easy to
use and was understood and accepted by the
participants. Especially its easiness in use is an
important feature of this app, which points to the use
in clients with high thresholds for written
psychological test instruments, such as young
children or participants with language barriers or
speech or writing delay (Gómez-Durán et al., 2018).
This app thus may contribute to mitigate these
barriers.
After having shown its usability, the next step is
to evaluate this app by means of its validity and
reliability. Therefore, its congruence with
relationships scales or social skills inventories (see
Jewell et al. (2019) for a review of instruments) will
be performed in a next step.
Apart from measuring interpersonal attachment,
our app might also be used as a rating instrument for
assessing agreement and disagreement or sympathy
and antipathy with a given situation in the course of
time. Especially in the case of dynamic process of
changing, i.e. in the observation of therapeutic
processes such as therapists and clients emotional
expression (Peluso et al., 2018) or the classification
of behaviour into normal or abnormal states
(Mabrouk et al., 2018) or movement analysis as
narratively described in Chyle et al. (2018), this app
might be adapted as a rating instrument for processes
within a continuum between two opposite end points.
REFERENCES
Blanco, S., Peñacoba, C., Sanromán, L., Pérez-Calvo, S.
2018. Analysis of quantitative and qualitative measures
of attachment in patients with fibromyalgia: The
influence on nursing care. International Journal of
Mental Health 47(1): 50-63.
Chaudhuri, P., Marron, J. S. 1999. SiZer for exploration of
structures in curves. Journal of the American Statistical
Association 94(447): 807-823.
HEALTHINF 2020 - 13th International Conference on Health Informatics
314

Chyle, F., Ostermann, T., Boehm, K. 2018. Body-and
movement-based interventions with male offenders–a
narrative review. International Journal of Comparative
and Applied Criminal Justice, 42(4), 359-375.
Degnan, A., Seymour‐Hyde, A., Harris, A., Berry, K. 2016.
The role of therapist attachment in alliance and
outcome: A systematic literature review. Clinical
Psychology & Psychotherapy 23: 47– 65.
Diener, M. J., Monroe, J. M. 2011. The relationship
between adult attachment style and therapeutic alliance
in individual psychotherapy: A meta‐analytic review.
Psychotherapy 48: 237– 248.
Ein-Dor, T., Hirschberger, G. 2016. Rethinking attachment
theory: From a theory of relationships to a theory of
individual and group survival. Current Directions in
Psychological Science 25(4): 223-227.
Fearon, R. M. P., Roisman, G. I. 2017. Attachment theory:
progress and future directions. Current Opinion in
Psychology 15: 131-136.
Göbel, A., Barkmann, C., Goletzke, J., Hecher, K., Schulte-
Markwort, M., Arck, P., Diemer, A., Mudra, S. 2019.
Psychometric properties of 13-item versions of the
maternal and paternal antenatal attachment scales in
German. Journal of reproductive and infant
psychology: 1-13.
Gómez-Durán, E., Jones, R. 2018. Challenging Language
Barriers. In: Forensic Psychiatry and Psychology in
Europe Springer, Cham. pp. 131-142.
Heinik, J., Werner, P., Dekel, T., Gurevitz, I., Rosenblum,
S. 2010. Computerized kinematic analysis of the clock
drawing task in elderly people with mild major
depressive disorder: an exploratory study. International
psychogeriatrics 22(3):479-488.
Jewell, T., Gardner, T., Susi, K., Watchorn, K., Coopey, E.,
Simic, M., Fonagy, P., Eisler, I. 2019. Attachment
measures in middle childhood and adolescence: a
systematic review of measurement properties. Clinical
Psychology Review, 68, 71–82.
Lange-Küttner, C. 1998. Pressure, velocity, and time in
speeded drawing of basic graphic patterns by young
children. Perceptual and motor skills 86:1299-1310.
Lumsden, J., Miles, L.M., Macrea, C.N. 2014. Sync or sinc?
Interpersonal synchrony impacts self esteem. Frontiers
in psychology 5, 1064.
Mabrouk, A. B., Zagrouba, E. 2018. Abnormal behavior
recognition for intelligent video surveillance systems:
A review. Expert Systems with Applications, 91, 480-
491.
Naz, F., Kausar, R. 2015. Translation and Validation of
Interpersonal Relationship Anxiety Questionnaire
(IRAQ). FWU Journal of Social Sciences 9(1): 118-
126.
Park, C., Vaughan, A., Hannig, J., Kang, K.-H. 2009. SiZer
Analysis for the Comparison of Time Series. Journal of
Statistical Planning and Inference 139(12):
3974-3988.
Peluso, P. R., Freund, R. R. 2018. Therapist and client
emotional expression and psychotherapy outcomes: A
meta-analysis. Psychotherapy, 55(4), 461-472.
Ramseyer, F., Tschacher, H. 2011. Nonverbal synchronity
in psychotherapy: coordinated body movement reflects
relationsship quality and outcome. Journal of
consulting and clinical psychology 79(3):284-295.
Robens, S., Heymann, P., Gienger, R., Hett, A., Müller, S.,
Laske, C., Loy, R., Ostermann, T., Elbing, U. 2019. The
Digital Tree Drawing Test for Screening of Early
Dementia: An Explorative Study Comparing Healthy
Controls, Patients with Mild Cognitive Impairment, and
Patients with Early Dementia of the Alzheimer Type.
Journal of Alzheimer's Disease 68(4): 1561-1574.
Sándor, M., Fülöp, M., Sebestyén, N. 2012. Description of
the Pictorial Assessment of Interpersonal Relationship
(PAIR). Magyar Pszichológiai Szemle 67(2): 267-294.
Shaw, C., Lo, C., Lanceley, A., Hales, S., Rodin, G. 2019.
The Assessment of Mentalization: Measures for the
Patient, the Therapist and the Interaction. Journal of
Contemporary Psychotherapy: 1-9.
Sroufe, L. A. 2016. Attachment theory: A humanistic
approach for research and practice across cultures.
Attachment Across Clinical and Cultural Perspectives:
23-49.
Thomas, D. 2008. Enabling application agility: Software as
a service, cloud computing and dynamic languages.
Journal of object technology, 7(4), 29-32.
Zapata, B. C., Fernández-Alemán, J. L., Idri, A., Toval, A.
2015. Empirical studies on usability of mHealth apps: a
systematic literature review. Journal of medical
systems, 39(2), 1.
Examination of Interpersonal Attachment with the Help of a Digital Tablet Application: A Proof of Concept Study
315
