
A Public Dataset of Overground and Treadmill Walking in Healthy
Individuals Captured by Wearable IMU and sEMG Sensors
Harald Loose, Laura Tetzlaff and Jon Lindström Bolmgren
Technische Hochschule Brandenburg, University of Applied Sciences,
Magdeburger Str. 50, 14770 Brandenburg, Germany
Keywords: Public Dataset, Overground and Treadmill Walking, Wearables, IMU and sEMG Sensors.
Abstract: The paper presents our public Gait Analysis Data Base (http://gaitanalysis.th-brandenburg.de), which contains
3D walking kinematics and muscle activity data from healthy adults walking at normal, slow or fast pace on
the flat ground or at an incremental speeds on treadmill. The acceleration, angular velocity and magnetic rate
vectors are measured using XSens MTw sensors attached to both feet, shanks, thighs and the pelvis. EMG
recordings are acquired using PLUX sEMG sensors applied at various leg muscles. The paper gives not only
a detailed description of the data base, its webpage and the used terms (scenario, proband, experiment and
trial), but also an overview about the experimental setup, the acquisition of data and the procedure of the
experiments, the data processing and evaluation. Results of exemplary applications are described in the second
part of the paper. Here the focus is set on the performance of walking: the individual ability to control, to
repeat and to reproduce the pace or the dependence of gait parameters on the pre-set velocity.
1 INTRODUCTION
Since 2000 the platform PhysioNet
1
offers free web
access to large collections of recorded physiologic
signals (PhysioBank) and related open-source
software (PhysioToolkit). PhysioNet is an online
forum for the dissemination and exchange of recorded
biomedical signals and open-source software for
analyzing them. It provides facilities for the
cooperative analysis of data and the evaluation of
proposed new algorithms (Goldberger et al., 2000).
Gait databases
2
contain stride interval (gait cycle
duration) time series in text form.
Data sharing and increased acceptance of
replication studies have been advocated to overcome
experimental limitations and to validate the
inferences made by previous gait studies (Ferber et
al., 2016; Knudson, 2017). Only a handful of walking
biomechanics datasets have been made publicly
available (Hnat, Moore & Van den Bogert, 2015;
Kirtley, 2014; Willson & Kernozek, 2014). There is
an objective need to share data and to have normative
databases to improve and to evaluate the
1
http://www.physionet.org
2
https://physionet.org/physiobank /database/#gait
3
http://demotu.org/datasets/walk/
interpretation of gait analysis outcomes. In the 1990s
the first gait datasets were made available (Winter,
1993; Winter 2009; Perry, 1992), including patterns
for joint angles, joint moments and reaction forces,
later patterns of muscle activities were added (Bovi,
2011).
The MMClab
3
of the University of ABC, Brazil,
provides a public dataset of 3D walking kinematics
and kinetics data on healthy young and older adults at
a range of gait speeds in both the treadmill and
overground environments. The datasets include both
raw and processed kinematic and kinetic data
(Fukuchi et al. 2018).
Our GaitAnalysisDataBase
4
contains 3D walking
kinematics and muscle activity data from healthy
adults walking on the flat ground or at a treadmill.
The acceleration, angular velocity and magnetic rate
vectors are measured using inertial measurement
units (IMU Xsens MTw
5
) applied to both feet, shanks,
thighs and the pelvis. EMG recordings are acquired
using acceleration and surface EMG sensors (PLUX
XYZ and PLUX
6
sEMG) applied at various leg
muscles. The data sets include unfiltered, gravity
compensated kinematic data of Xsens sensors and
4
http://gaitanalysis. th-brandenburg.de
5
xsens.com
6
plux.info
164
Loose, H., Tetzlaff, L. and Bolmgren, J.
A Public Dataset of Overground and Treadmill Walking in Healthy Individuals Captured by Wearable IMU and sEMG Sensors.
DOI: 10.5220/0008879501640171
In Proceedings of the 13th International Joint Conference on Biomedical Engineering Systems and Technologies (BIOSTEC 2020) - Volume 4: BIOSIGNALS, pages 164-171
ISBN: 978-989-758-398-8; ISSN: 2184-4305
Copyright
c
2022 by SCITEPRESS – Science and Technology Publications, Lda. All rights reserved
unprocessed raw data of PLUX acceleration and
sEMG sensors.
The GaitAnalysisDataBase collects data sets
acquired under the supervision of the authors during
the last years at the Brandenburg University of
Applied Sciences (THB), at FH Vorarlberg (Austria),
at the University of Oulu (Finland) and at MMUST
(Kenya), indoor and outdoor, on paved and unpaved
trails, at various climatic conditions, investigating
various aspects of human movement.
Students and professors, technicians and
researchers have been involved in the process of
preparing and executing measurements as well as in
storing and evaluating the acquired data. All these
volunteers – healthy adults between 18 and 65 from
several nationalities – provided informed consent
about the experiments, data storage and the future use
of data.
Following the initial idea of the PhysioNet
platform, the GaitAnalysisDataBase are meant to
facilitate “the cooperative analysis of data and the
evaluation of proposed new algorithms”, to support
the development of robust algorithms and to be used
for teaching and other educational purposes. The data
were collected by lecturers and students guided by
prescribed procedures and checklists. Recordings
containing measurement errors or procedural faults,
caused by equipment, subjects or instructors, have not
been excluded. They should be detected by
automatically proceeding and robustness algorithms.
The data sets serve as useful examples for testing
newly implemented algorithms.
The paper is divided into two main parts: the
description of the public dataset and exemplary
applications to demonstrate possible investigations
using the provided data. This paper is not intended to
explain all aspects of the developed
methods/algorithms, including all related to them
problems, and to discuss the results of the exemplary
applications. More details are presented in e.g. Loose
(2015) and Loose et al. (2016).
2 SYSTEM AND EXPERIMENTS
We have focused on human walking, tried to
understand the underlying process and to find the best
positions of sensors. Robust and reliable algorithms
which apply to a wide range of walking scenarios (~2-
8 km/h) were developed. The algorithms were
evaluated on data sets acquired from IMUs attached
to the foot, shank, thigh, pelvis or from sEMG,
7
http://www.seniam.org/
applied to various muscles, supplemented by an
accelerometer placed at the heel. Two main scenarios
- repetitive walking on the flat ground and walking on
a treadmill - were addressed with a large number of
healthy subjects.
2.1 Experimental Setup
The Xsens sensors are clipped on body straps
attached similarly on the left and right lower limbs
and one in the middle of the back. Typically one pair
is sitting on the metatarsus, two directly above the
ankle and the knee. The distances of the sensors from
the floor, as well as the length of the limbs are stored
in the subject’s individual experiment record.
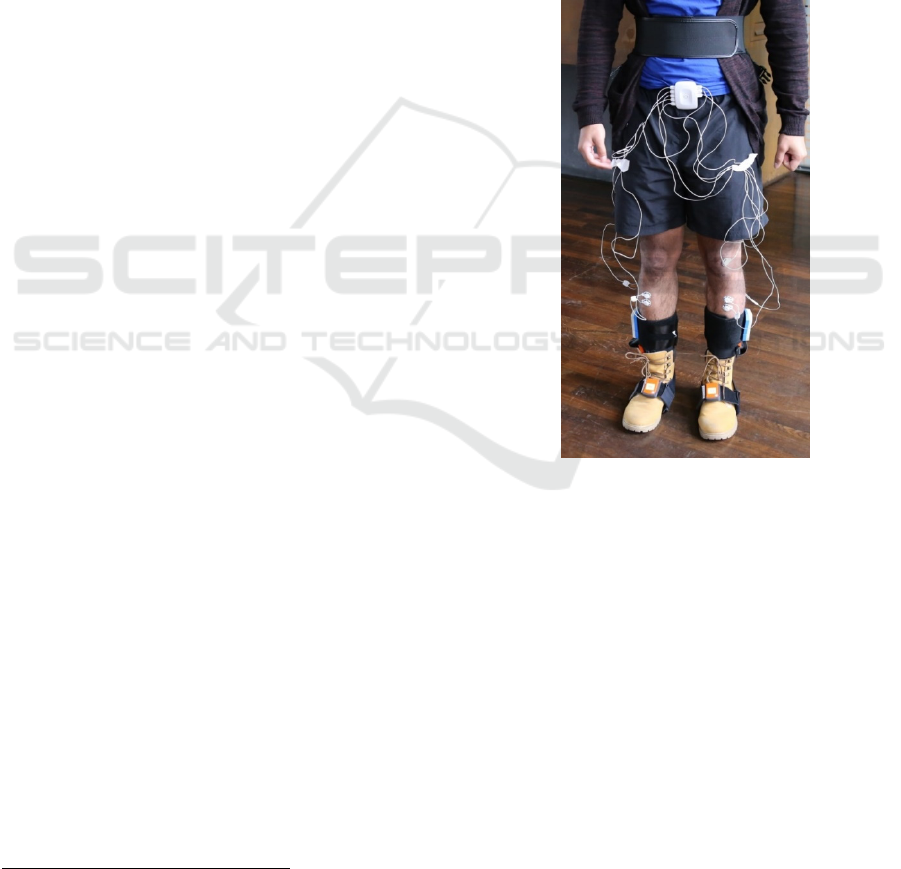
Figure 1: Experimental setup – Xsens and PLUX sensors
are applied.
When PLUX sensors are included in the
experimental setup, sEMG pads are (mostly)
positioned accordingly the recommendations of
SENIAM
7
symmetrically on muscles involved in
locomotion activities,: m. gluteus maximus, m. rectus
femoris, m. biceps femoris, m. vastus lateralis
femoris, m. vastus medialis femoris, m. tibialis
anterior, m. tibialis posterior, m. gastrocnemius
lateralis, m. gastrocnemius medialis, m. soleus.
Accelerometers are applied to the heel to supplement
sEMG records.
A Public Dataset of Overground and Treadmill Walking in Healthy Individuals Captured by Wearable IMU and sEMG Sensors
165
2.2 Sensors and Software
During the gait analysis courses three generations of
the 9DOF Xsens MTw sensors have been used to
acquire accelerations, angular velocities and
magnetic rates as well as the sensor orientation at a
sampling rate between 60 and 100 Hz. Two
generations of the PLUX equipment have been
applied to record muscle activities (sEMG) and the
related acceleration at a sampling rate of 1 kHz.
2.2.1 Xsens MTw Sensors
The 9DOF Xsens MTw sensor (Roetenberg, 2009)
incorporates three microelectromechanical sensors:
triple-axis gyroscope, accelerometer and,
magnetometer.
Onboard the data of the primary sensors are
sampled with 1800 Hz, strapped down by integration
(SDI) incorporating the estimate of orientation to the
transfer rate 60 Hz for seven sensors or 100 Hz for
two sensors (first generation).
The MTw are connected via Bluetooth to one
Awinda station and the data acquisition software “MT
Manager, versions 3.81, 4.21 and 4.9”.
All involved sensors are synchronized with high
accuracy (< 0.01 ms). The software provides linear
acceleration a, angular velocity ω, magnetic field m
and quaternion q (estimated on-board with < 1° of
static and 2° RMS of dynamic accuracy).
Before the measurement the sensors need a calm
or slow motion for calibration, to determine the initial
orientation of the sensor with respect to the world
coordinate system.
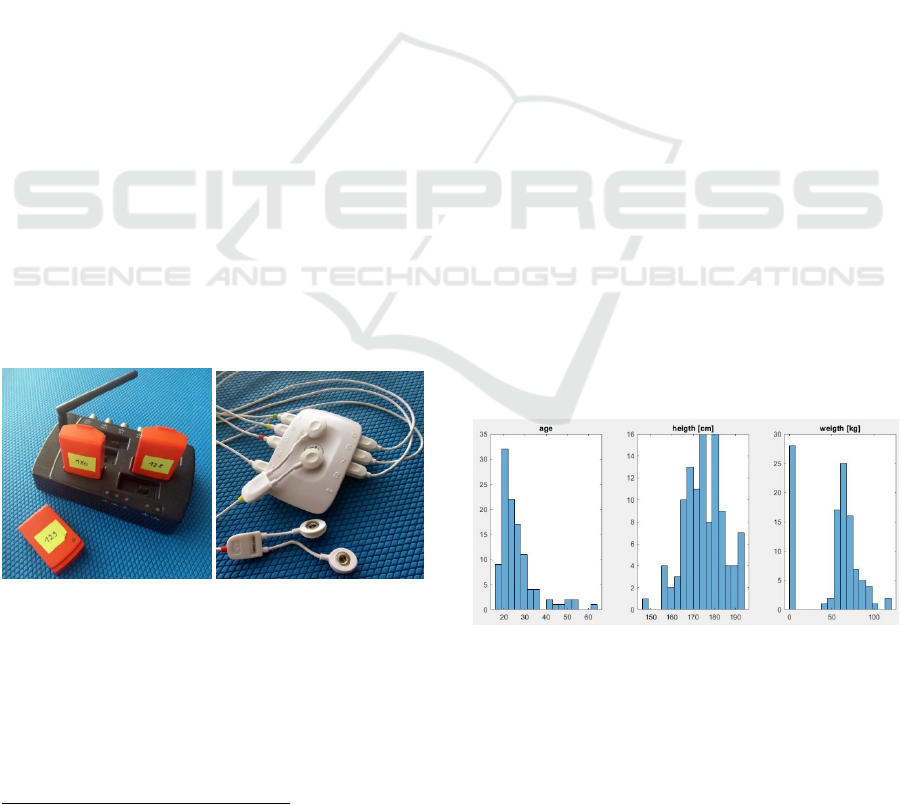
Figure 2: IMU Xsens Mtw sensors and AVIRA unit (left)
and PLUX Channel hub and connected sensors (right).
2.2.2 PLUX Sensors
The PLUX biosignal kit
8
includes a wireless 8
channel hub, various sensors and the data acquisition
software "OpenSignals". The non-filtered sensor data
were acquired at a sampling rate of 1 kHz.
8
https://plux.info/12-biosignalsplux
In most of the experiments, 5 sEMG and a triaxial
accelerometer sensors were connected to a hub (one
for each leg), sometimes two similar hubs were used
simultaneously.
2.3 Scenarios
All data sets have been acquired in two main
scenarios:
“The Catwalk”: walking a distance of mostly 20
m (in a range of 10 m to 80 m) on flat ground at
usual/normal, reduced/slowed and increased/fast
speed,
“The Treadmill”: walking on a treadmill at
incremental speed settings from 3.5 to 6.5 km/h or
2 to 8 km/h).
The specifications of the experimental setup for
each dataset is given on the GaitAnalysisDataBase
website and is included in META data of any record.
A test scenario was involved in the examination
of distance accuracy: Straight forward, steady
walking outdoor on a long enough distance (~175 m),
on flat and paved ground. The distance was measured
alternatively with GPS and tape line. The trial was
repeated twice.
2.4 Cohorts
Study participants included 108 healthy volunteers
between 17 - (average: 26, median: 23) - 63 years old,
147 – (174) – 194 cm height, 54 – (76) – 120 kg
weight and a body mass index of 19 – (24) – 37. There
were 45 females and 63 males. Figure 3 shows the
distribution of age, height, and weight of all
volunteers. The 0 kg bin is caused in the lack of data
in one scenario.
Figure 3: Age, height and weight distribution.
Only in 2017 (March – October) a subject was
monitored during the recovery process after the
surgery caused by a fibula fracture (“Cat walking”
and “Treadmill).
BIOSIGNALS 2020 - 13th International Conference on Bio-inspired Systems and Signal Processing
166

2.5 Procedure
All gait trials were performed in everyday conditions,
and the participants were comfortably dressed. Before
data collection, each participant received a brief
explanation of the study and signed the consent form.
Body height and body mass were measured. The year
of birth was asked.
Each recording was started and terminated with a
three second calm phase independent of whether the
subject was walking on flat ground or on the
treadmill. Each trial is recorded and stored separately.
The subject is asked to stop at the end of a trial and
not to turn or to move before the recording is
terminated.
2.6 Evaluation
All algorithms used in all steps of data evaluation
were developed, implemented and tested in
MATLAB®
9
by ourselves. An open script is
organized to process experimental data automatically
step by step. After each step, the intermediate results
are saved.
The developed algorithms are designed on a
robust stride detection and a stride-by-stride
determination of derived characteristics allowing
recalibrations at the beginning of each stride.
The term “stride” or “gait cycle” is defined as the
period between two successional gait events. Perry
(Perry, 1992) and others defined the initial contact,
i.e. the moment of the heel strike, as the beginning of
the gait cycle. To choose the period from mid-stance
to mid-stance for calculation is more constructive,
because at this moment obviously the foot is not
moving, it stands on the floor and the leg is vertical
elongated.
2.6.1 Xsens Sensor Data Processing
9DOF Xsens MTw sensors provide accelerations,
angular velocities, magnetic rates and orientation
data. The sampled data of all involved in the trial
sensors are received by the Xsens MT manger via
Bluetooth and stored in one proprietary file. This data
file is exported in text csv-files, one for each sensor.
The data of each Xsens sensors are evaluated
separately. The following steps are included:
Pre-processing: reading and reorganizing the
acquired data, given in the sensor related
coordinate system (SCS), transformation of
sensor data into world coordinate system (WCS),
9
www.mathworks.com
elimination of gravity, calculation of orientation
relative to the initial one, calculation of angles
between z-axes of a sensor and the vertical or the
horizontal plane, calculation of joint angles.
Processing: estimation of direction of motion,
calculation of candidates for gait events,
plausibility check, determination of gait cycles,
transformation of data into motion coordinate
system (MCS), integration of acceleration,
calculation of velocity and position data stride by
stride.
Post-processing: calculation of stride related and
average features, determination of average
motion.
Evaluation: building figures, extracting and
processing tables.
The database contains the pre-processed datasets
of each sensor. Additional the following computed
parameters are available at the website: duration in
[s], distance in [m], cadence in [steps/min] and
number of strides. Other features are determined
during post-processing and evaluation.
Remark: All sensors are treated in the same way
independent on their position. Because of this the
calculated velocities do not include the steady part of
motion, which is zero for the foot sensors. The steady
motion increases together with the height of the
sensor position (see Loose, 2015).
2.6.2 PLUX Sensor Data Evaluation
sEMG sensors were mostly used in combination with
XYZ accelerometers placed at the heel, sometimes
without them. The following two different
approaches to detect gait cycles were implemented. If
an XYZ accelerometer is used the outstanding local
minima related to the heel strike are determined and
the signals are partitioned beginning and terminating
at heel strikes. Otherwise the main frequency of all
available signals is calculated. The correspondent
period of time (average stride duration) is taken to
partition them.
The following steps are included:
Pre-processing: reading, reorganizing and
conditioning the acquired data, calculation of
sEMG envelopes based on rms-methods.
Processing: determination of gait cycles,
partitioning sensor signals and envelopes.
Post-processing: calculation of mean and median
frequencies, power spectrums and energy
characteristics, determination of average curves.
A Public Dataset of Overground and Treadmill Walking in Healthy Individuals Captured by Wearable IMU and sEMG Sensors
167

Evaluation: building figures, extracting and
processing tables.
3 ORGANIZATION OF THE
DATA BASE
The data sets collected in the database were acquired
by lecturers and students, in undergraduate and
graduate courses dealing with various aspects of gait
analysis, experimental and evaluation methods. In
each course the scenario, the experimental setup and
the procedure of the trials were explained and
discussed with all participants. The execution of the
experiments following pre-defined checklists has
been supervised by the lecturer (authors). Any
measurement errors or procedural faults, caused by
equipment, probands or instructors, were noted and
were excluded only in the case that nothing
substantial was recorded. They serve as useful
examples for testing the robustness of algorithm
implementations.
Before getting access to the database, the user
needs to register in the system entering his username,
password and email address. Later he can sign in by
username and password. The personal data of the
registration are used only for statistics about access to
the database.
3.1 Terms
The most important terms in the database are
scenarios, probands, experiments, the chosen
experiment and the individual recordings.
A Scenario describes the conditions of all
experiments proceeded during a course: overground
or treadmill, speed levels, used sensors, number of
trials.
A Proband relates to a real person participating
in one or more experiments. Any proband has an
individual ID "Pxxx".
An experiment relates to one scenario and one
proband. It groups all trials and recordings of the
chosen experiment. Each experiment is identifiable
by a unique number.
A Test/Trial is related to a walk of the proband.
Each test is characterized by a unique number.
Each Sensor has a unique key in the form of
[F/S/T/VP] [L/R] or EMG or XYZ, where F - Foot, S
- Shank, T - Thigh, VP - Pelvis, L - Left, R - Right,
EMG - sEMG, XYZ – accelerometer, e.g. FsL or SR.
10
http://gaitanalysis. th-brandenburg.de
3.2 Webpage
A webpage
10
serves the entry point - the graphical
user interface - to the GaitAnalysisDataBase. The
webpage offers two informative subpages, a
download area and three approaches to search data
sets via scenarios, probands or experiments.
Tab “Scenarios”: all scenarios extended by a
table of related experiments are listed.
Tab “Probands”: all anonymized subjects, their
personal data and a table of scenarios, where they
were involved, is presented.
Tab “Experiments”: the table of all experiments
provides links to individual pages where all datasets
sorted by the number of trials and the sensors are
listed. Any entry includes the abbreviation of the
sensor position, stride characteristics and the number
of strides as well as links to the preview and the
download of the selected dataset.
3.3 Recordings
Each record consists of two parts: the metadata block,
describing the data, and the binary coded data.
3.3.1 Xsens MTw Recordings
Xsens IMUs record acceleration, angular velocity and
magnetic rate vectors, as well as the orientation of the
sensor. The acquired data were transformed from the
sensor related coordinate system into the world
coordinate system and gravity compensated.
Each dataset contains the measurements from a
single IMU. The metadata block includes: date,
proband ID, number of test, sensor position, sensor id,
number of columns, number of samples, precision,
sampling rate, duration of recording, number of speed
levels, scaling factors of acceleration, angular
velocity and quaternions.
3.3.2 PLUX Recordings
PLUX units sample up to 8 channels depending on
the number and the type of primary sensors. While a
sEMG has only one signal, an XYZ sensor has three
channels - one for each direction.
Each EMG or XYZ dataset contains the
measurements of a single unit. The metadata block
includes: date, alias, number of test, type of sensor,
number of columns, abbreviations of muscles,
number of samples, sampling rate, precision, duration
of recording, number of speed levels.
BIOSIGNALS 2020 - 13th International Conference on Bio-inspired Systems and Signal Processing
168
3.4 Export and Import of Data Files
Any recording can be downloaded from the specified
experiment page.
The names of the data files are transliterated as
YYYMMDD_Pnnnn_ttt_XXX_mmm,
where YYYYMMDD - date, Pnnnn - proband ID,
ttt - trail, XXX - sensor type and , mmm - sensor id,
e.g. . 20141029_P0008_001_FsL_125.dat.
All data sets could be downloaded at once if
meaningful.
To import the downloaded data files into the
MATLAB workspace, two functions are provided.
4 EXEMPLARY APPLICATION
The datasets included in the database were acquired
in study and research projects for different objectives.
First of all, we – students and lecturers - have learned
a lot about walking and gait, about sensors and signal
processing, about good practice when conducting
experiments with individuals, documenting them,
collecting and storing data, and, last but not least,
making the data available for public use.
Anyway each series of experiments was
originated and motivated by specific questions. Two
of them will be presented in the following sections.
One typical testing in gait analysis is the
“Catwalk” scenario where the subjects are asked to
pass several times a distance at a constant, self-
selected pace. The distance depends on the available
equipment and space. In standard clinical conditions
the subject walks about 10 m in one direction, so that
at least 4 normal strides could be observed. If mobile,
wearable sensors are used, the distance could be
extended to 20 m (indoor) or more (outdoor). In this
case the number of observable gait cycles is greater
than 10 and an averaging could make sense.
In various studies the subjects are asked to walk
“normal, slow and fast”, with “self-selected
comfortable, reduced or increased velocity”, i.e. on
three discriminable speed levels what the subject can
easily perform, replicate and control. It should be
mentioned that there are large differences between the
“normal” speeds of persons, because it depends on
physiological characteristics, e.g. height, weight, age
and gender, and for one subject in dependence of the
personal situation (daily routine, walk with friends,
shopping.)
4.1 Individual Pace Control
Examples of investigated questions are:
What velocities are chosen by any individual as
comfortable, reduced and increased?
Is the individual able to control their walking
pace, to separate normal, slow and fast, and to
replicate them?
How do the individuals realize the increase of the
pace – by increasing the stride length or the
cadence or both simultaneously?
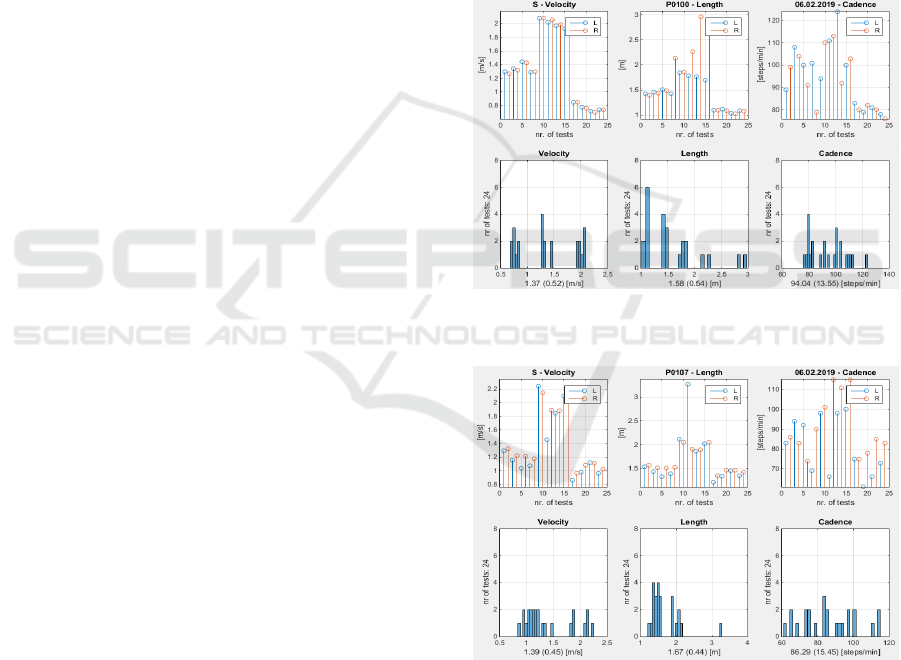
Figures 4a and b include two types of images.
Above the determined average stride velocities,
length and cadence are shown for both the left and the
right shank sensors and for each of the trials. Below
their frequency distribution is represented in form of
histograms added by the mean value (standard
deviation).
Figure 4a: Individual stride velocity, length and cadence
(above) and their histogram (below) of P0100.
Figure 4b: Individual stride velocity, length and cadence
(above) and their histogram (below) of P0107.
Figure 4 presents two different cases:
In figure 4a the three levels are clearly separated.
The change of pace is a result of varying both the
length and the cadence was changed.
Figure 4b presents the case where the normal and
slow are on the same level.
A Public Dataset of Overground and Treadmill Walking in Healthy Individuals Captured by Wearable IMU and sEMG Sensors
169
4.2 Overall Velocity Distribution
In 2014 and 2015 two groups were involved in the
scenario B70Z12, B57E12 and B77E12 “Repetitive
Indoor Walking”. The participants were asked to pass
four times a distance of about 20 meters at constant
pace, first at a self-selected comfortable velocity, then
with reduced and last with increased speed. 18
subjects were collected for the test group -
experiments 001-018, October/November 2014, age
28 (12), height 178 (9). 10 persons created the control
group – experiments 052, 053-062, October 2015, age
24 (9), height 177 (11).
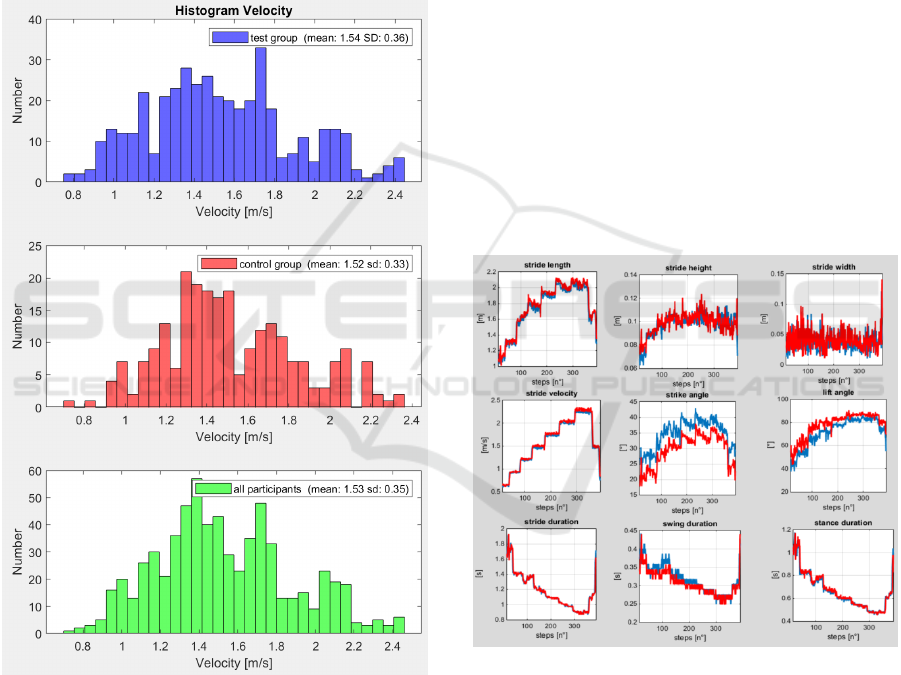
Figure 5: Velocity histogram of the test group (above), the
control group (central) and both groups (below).
Seven Xsens MTw sensors were applied: one in the
middle of the back, 6 pairwise above the knee, above
the ankle and on the shoe. The only difference
between the experiments in 2014 and 2015 concerns
to the position of the foot sensors: lateral centric in
2014 and on the metatarsus in 2015.
Figure 5 shows the velocity distribution of the test
(above) and control group (below) and all together. It
could be mentioned that the results (mean value and
the standard deviation) are very close. The small
difference could be a result of the different positions
of the foot sensors. The distance between the foot
sensor positioned lateral and the hip is obviously
greater than the correspondent distance from the
metatarsus (on the top of the foot). It follows that the
measured accelerations and the calculated velocities
are a bit higher in 2014.
4.3 Dependencies of Gait Parameters
on Walking Velocity
There are various ways to investigate the dependency
of stride characteristics on the walking velocity. The
scenarios of “Repetitive Walking” or “Walking on a
treadmill with pre-set speeds or incremental speed
profile” could be employed. Here the scenario
L70Z01 – “Treadmill with incremental speed profile”
was chosen. 7 speed levels run through, including at
least 40 seconds periods of stabilized walking, during
each trial. The disadvantage of this approach could be
the influence of the moving belt on the walking
pattern.
Figure 6: Influence of the treadmill speed on stride
characteristics: length, height, width, velocity, strike and
lift angle, duration of stride, stance and swing (red – left,
blue – right leg).
Figure 6 illustrates the dependency of stride
characteristics like stride length, height, width and
velocity, strike and lift angle, duration of stride,
stance and swing on the numbers of steps for a single
experiment (Loose, 2016). The number of executed
strides corresponds to the belt velocity which was
incremented every 60 seconds by 1 km/h and
BIOSIGNALS 2020 - 13th International Conference on Bio-inspired Systems and Signal Processing
170

decremented later every 30 seconds. It increases
together with treadmill speed (see subplot “stride
velocity”). Obviously stride length, height, strike and
lift angle rise with increasing stride velocity, while
stride, stance and swing duration descend. A higher
stride velocity is achieved by increasing the stride
length and shortening the stride duration. The
relationship between the stance and swing phases is
changing. The stance phase becomes shorter
relatively to the swing phase.
5 CONCLUSIONS
This paper presents the GaitAnalysisDataBase, which
provides data sets of walking for public use, that
could be used to develop and evaluate algorithms, and
to investigate different research problems without
having to collect own data.
The paper gives a detailed description of the
database, its webpage and the used terms (scenario,
proband, experiment and trial). An overview about
the experimental setup, the acquisition of data, the
procedure of experiments, data processing and
evaluation is included. Results of exemplary
investigations are described in the second part of the
paper.
The public database opens up manifold
opportunities for research and development tasks as
well as for educational projects and studies in the field
of gait analysis.
To extend the database including so-called
annotation files, providing intermediate results, i.e.
detected gait events, duration and length of strides, is
still under consideration. The presented results on any
experiment page are not intended for comparison, but
for classification of the trial.
We would be pleased to see the offer taken up and
would appreciate any hint to improve or extend the
database. We kindly ask you to cite this paper should
you use this database for your publications or the
research.
ACKNOWLEDGEMENTS
We would like to thank all volunteers, students,
employees and colleagues who participated in or
contributed to our gait studies in various roles as
proband, experimenter, evaluator, software developer
or supervisor.
REFERENCES
Bovi, G., Rabuffetti, M., Mazzoleni, P., Ferrarin,M. (2011).
A multiple-task gait analysis approach: Kinematic,
kinetic and EMG reference data for healthy young and
adult subjects. Gait & Posture 33 (2011) 6-13.
Ferber R, Osis ST, Hicks JL, Delp SL. 2016. Gait
biomechanics in the era of data science. Journal of
Biomechanics 49:3759_3761 DOI 10.1016/j.jbiomech.
2016.10.033.
Fukuchi, C.A., Fukuchi, R.K., Duarte, M., 2018. A public
dataset of overground and treadmill walking kinematics
and kinetics in healthy individuals. PeerJ 6:e4640; DOI
10.7717/peerj.4640
Goldberger, A.L., Amaral, L.A.N., Glass, L, Hausdorff,
J.M., Ivanov, P.Ch., Mark, R.G., Mietus, J.E., Moody,
G.B., Peng, C-K, Stanley, H.E., 2000. PhysioBank,
PhysioToolkit, and PhysioNet: Components of a New
Research Resource for Complex Physiologic Signals.
Circulation 101(23): e215-e220 [Circulation Electronic
Pages; http://circ.ahajournals.org/content/101/23/e215.
full]; 2000 (June 13)
Hnat SK, Moore JK, Van den Bogert AJ. 2015. Command
treadmill motions for perturbation experiments.
Available at https://zenodo.org/ record/ 16064#.WtU4
U62ZPBI.
Kirtley C. 2014. CGA normative gait database. Available at
http:// www.clinicalgaitanalysis.com/ data/ .
Knudson D. 2017. Confidence crisis of results in
biomechanics research. Sports Biomechanics
16:425_433 DOI 10.1080/14763141.2016.1246603.
Loose, H., (2015). Gait Patterns in Standard Scenarios:
Using Xsens MTw Inertial Measurement Units.
Proceedings of REM 2015, Bochum, Germany, 18-20
November 2015.
Loose, H., Orlowski, K., Tetzlaff, L. (2016): Estimation of
the Average Gait Velocity based on Statistical Stride
Parameters of Foot Sensor Data. In Proceedings of the
9th International Joint Conference on Biomedical
Engineering Systems and Technologies, ISBN 978-
989-758-170-0, pages 277-283. DOI: 10.5220/00058
22602770283
Perry, J. (1992). Gait Analysis - Normal and Pathological
Function. Slack Inc.
Roetenberg, D., Luinge, H., and Slycke, P. (04/2009).
Xsens mvn: Full 6 dof human motion tracking using
miniature inertial sensors. XSENS TECHNOLOGY,
White Paper.
Willson JD, Kernozek T. 2014. Gait data collected at
university of wiscosin-la crosse. Available at https://
innsport.com/ related-products/ data-sets/uw-l-gait-
data-set.aspx.
Winter D.A., Knowledge base for diagnostic gait
assessments. Medical Progress Through Technology
19:61_81.
Winter D.A., Biomechanics and Motor Control of Human
Movement, WILEY, 2009.
A Public Dataset of Overground and Treadmill Walking in Healthy Individuals Captured by Wearable IMU and sEMG Sensors
171
