
Towards Deep People Detection using CNNs Trained on Synthetic Images
Roberto Mart
´
ın-L
´
opez, David Fuentes-Jim
´
enez
a
, Sara Luengo-S
´
anchez,
Cristina Losada-Guti
´
errez
b
, Marta Marr
´
on-Romera
c
and Carlos Luna
Department of Electronics. University of Alcal
´
a, Politechnics School, Campus Universitario S/N, Alcal
´
a de Henares, Spain
Keywords:
People Detection, Synthetic images, Convolutional Neural Networks, Depth Images.
Abstract:
In this work, we propose a people detection system that uses only depth information, provided by an RGB-D
camera in frontal position. The proposed solution is based on a Convolutional Neural Network (CNN) with
an encoder-decoder architecture, formed by ResNet residual layers, that have been widely used in detection
and classification tasks. The system takes a depth map as input, generated by a time-of-flight or a structured-
light based sensor. Its output is a probability map (with the same size of the input) where each detection is
represented as a Gaussian function, whose mean is the position of the person’s head. Once this probability map
is generated, some refinement techniques are applied in order to improve the detection precision. During the
system training process, there have only been used synthetic images generated by the software Blender, thus
avoiding the need to acquire and label large image datasets. The described system has been evaluated using
both, synthetic and real images acquired using a Microsoft Kinect II camera. In addition, we have compared
the obtained results with those from other works of the state-of-the-art, proving that the results are similar in
spite of not having used real data during the training procedure.
1 INTRODUCTION
People detection has earned increasing importance in
different research fields due to its application in multi-
ple areas like video surveillance, security, access con-
trol, etc. In most of the previous works (Ramanan
et al., 2006; Jeong et al., 2013) detection is performed
using RGB images. In (Ramanan et al., 2006) a sys-
tem that learns people’s appearance models is pro-
posed, while the work (Jeong et al., 2013) is based
on the classification of interest points.
Systems that use color information may cause
problems related to privacy since the information
available in an image makes it possible to recognize
the identity of people appearing on it. As an al-
ternative in order to solve these problems, different
proposals have appeared in the literature. Some of
them (Bevilacqua et al., 2006; Zhang et al., 2012;
Stahlschmidt et al., 2013; Luna et al., 2017), as
the one described in this paper, use depth sensors
(2.5D) (Lange and Seitz, 2001; Sell and O’Connor,
2014). Depth images provide information about the
distance from each scene point to the camera. They
a
https://orcid.org/0000-0001-6424-4782
b
https://orcid.org/0000-0001-9545-327X
c
https://orcid.org/0000-0001-7723-2262
then allow detecting people, but not identifying them
(since it is not possible to recognize their identities).
The use of systems based on Deep Learning has in-
creased significantly in recent times, using both RGB
and RGB-D (combination of depth and color) images.
Other works, like (Wang and Zhao, 2017; Zhao et al.,
2017) base the detection only on depth information,
as the system presented herein.
It is important to emphasize that most of the pre-
vious works use these depth sensors located in an
overhead position, thus avoiding the problem of oc-
clusions but covering an area that may result in too
small in many applications. In order to increase the
area of study, this work proposes an elevated frontal
position of the camera. Figure 4 shows the perspec-
tive of the images with this elevated frontal position
of the camera. One of the main problems to solve
with the chosen perspective is the occlusions, which
must be absorbed by the algorithm to provide a robust
detection.
This work proposes a detection system that uses
a convolutional neural network (CNN) for the robust
detection of multiple people in depth images with el-
evated frontal location of the camera. The system
has been trained end-to-end using synthetic data, and
the corresponding outputs have been labeled automat-
Martín-López, R., Fuentes-Jiménez, D., Luengo-Sánchez, S., Losada-Gutiérrez, C., Marrón-Romera, M. and Luna, C.
Towards Deep People Detection using CNNs Trained on Synthetic Images.
DOI: 10.5220/0008879102250232
In Proceedings of the 15th International Joint Conference on Computer Vision, Imaging and Computer Graphics Theory and Applications (VISIGRAPP 2020) - Volume 5: VISAPP, pages
225-232
ISBN: 978-989-758-402-2; ISSN: 2184-4321
Copyright
c
2022 by SCITEPRESS – Science and Technology Publications, Lda. All rights reserved
225
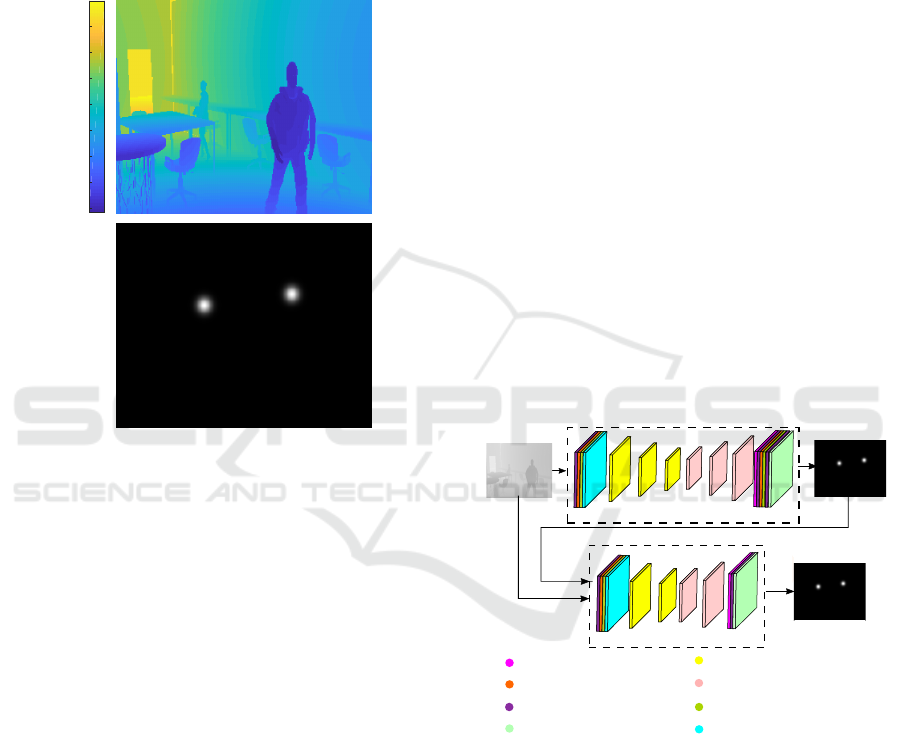
ically, with a Gaussian function whose mean is the
position of each person’s head. Figure 1 shows an
example of a synthetic image used as input and the
corresponding labeled output. To evaluate and vali-
date the system synthetic data have been used in the
first place, followed by real data. Besides, real data
results have been compared with the results of other
state-of-the-art proposals.
4000
4500
5000
5500
6000
6500
7000
7500
Figure 1: Input image (where depth values in millimeters
are shown using a colormap) and labeled output image.
The rest of this paper is organized as follows: sec-
tion 2 explains the architecture of the proposed Deep
Neural Network (DNN), then section 3 presents the
training procedure using synthetic data. Section 4 de-
scribes the main results. Finally, section 5 includes
the main conclusions and future work.
2 CNN ARCHITECTURE
As has already been mentioned in the introduction,
we propose a system for people detection based on
CNNs. The system processes the input depth images
and delivers a likelihood map at the output that must
contain as many detections as the number of people in
the image. This likelihood map has the same dimen-
sions as the input image (240 × 320 pixels) and its
appearance is shown in figure 1, where it can be seen
how each detection is indicated in the output likeli-
hood map as a Gaussian function around the 2D po-
sition of each detected person head. It is worth to
highlight that an output likelihood map with the same
size as the input depth image allows better accuracy
in the detections, and immunizes the system in terms
of speed influenced by the number of detections in the
image, as it does not depend on the number of people
detected.
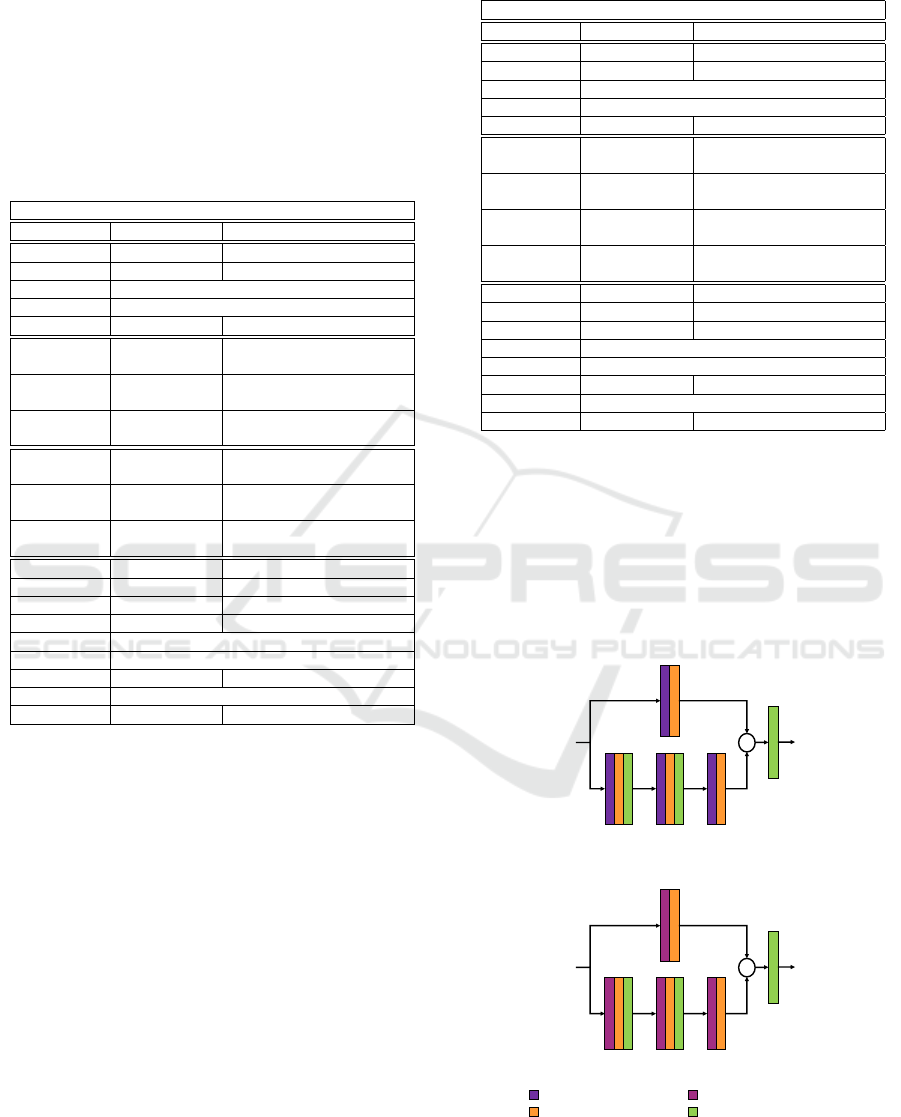
With a focus from the outside to the inside of the
proposed network, the first step is to define and ex-
plain the two main blocks that form the system, shown
in figure 2: the Main Block (MB) and the Hypothesis
Reinforcement Block (HRB).
Both Blocks are based in an encoder-decoder
structure that is described in detail below. The input
image is processed by the MB, which generates the
first likelihood map. Then, this likelihood map and
the input image are concatenated, creating a matrix
with dimensions 240 × 320 × 2 that is processed by
the HRB. The likelihood map generated by the HRB
is the final output of the system. The HRB improves
the detection of the MB, creating a refined likelihood
map with better distinguishable Gaussians and reduc-
ing the number of False Positives (FP) that the MB
generates.
The MB has an encoder-decoder structure, based
on ResNet (He et al., 2016) that uses separable layers
based on the ones proposed in (Chollet, 2016). This
kind of convolutional layer has been chosen because
they are much faster than the conventional convolu-
tional layers, maintaining its accuracy.
Main Block (MB)
Hypothesis Reinforcement Block (HRB)
Encoder
Decoder
Encoder
Decoder
UpSampling
Batch Normalization
Decoding Convolutional Block
Encoding Convolutional Block
ReLU Activation
Max Pooling
Sigmoidal Activation
Separable Convolution
Input
Output
Figure 2: Architecture of the proposed CNN for people de-
tection.
Table 1 summarizes all layers included in the MB,
indicating the output dimensions as well as the differ-
ent parameters involved. Parameters a, b and c of the
Encoding Convolutional Blocks (ECB) and Decoding
Convolutional Blocks (DCB) represent the number of
filters for each internal convolutional layer.
First of all, a separable convolutional layer con-
sisting of 64 kernels of 7 × 7 and a stride of 2 × 2 is
used. After that, there are applied a Batch Normaliza-
tion (BN) layer (Ioffe and Szegedy, 2015), followed
by a Rectified Linear Unit (ReLU) activation one and
VISAPP 2020 - 15th International Conference on Computer Vision Theory and Applications
226
finally a Max Pooling one of 3 × 3. Then, there are
included three ECB and three DCB. These blocks are
based in ResNet (He et al., 2016), and they are ex-
plained below. Finally, the MB contains some layers
of Cropping, ZeroPadding and UpSampling to adjust
the output size, followed by two Separable Convo-
lutional Layers. The former is followed by a Batch
Normalization and a ReLU activation and the latter
by a Sigmoid one.
Table 1: Detailed architecture of the Main Block (MB).
Main Block (MB)
Layer Output size Parameters
Input 240 × 320 × 1 -
Convolution 120 × 160 × 64 kernel=(7, 7) / strides=(2, 2)
BN -
Activation ReLU
Max Pooling 40 × 53 × 64 size=(3, 3)
CBE 40 × 53 × 256
kernel=(3, 3) / strides=(1, 1)
(a=64, b=64, c=256)
CBE 20 × 27 × 512
kernel=(3, 3) / strides=(2, 2)
(a=128, b=128, c=512)
CBE 10 × 14 × 1024
kernel=(3, 3) / strides=(2, 2)
(a=256, b=256, c=1024)
CBD 10 × 14 × 256
kernel=(3, 3) / strides=(1, 1)
(a=1024, b=1024, c=256)
CBD 20 × 28 × 128
kernel=(3, 3) / strides=(2, 2)
(a=512, b=512, c=128)
CBD 40 × 56 × 64
kernel=(3, 3) / strides=(2, 2)
(a=256, b=256, c=64)
Cropping 40 × 54 × 64 cropping=[(0, 0) (1, 1)]
Up Sampling 120 × 162 × 64 size=(3, 3)
Convolution 240 × 324 × 64 kernel=(7, 7) / strides=(2, 2)
Cropping 240 × 320 × 64 cropping=[(0, 0) (2, 2)]
BN -
Activation ReLU
Convolution 240 × 320 × 1 kernel=(3, 3) / strides=(1, 1)
Activation Sigmoid
Output 240 × 320 × 1 -
The HRB structure is similar to the one of MB
previously described, but it incorporates a few modi-
fications that change its final size, as shown in Table 2,
that describes all the layers of the HRB, defining out-
put parameters and dimensions. The first layers are
identical to the ones in the MB: Separable Convolu-
tion layer, Batch Normalization, ReLU activation, and
Max Pooling. The number of ECB and DCB layers is
reduced to two blocks per type. The output stage is
also similar to the one of the MB: two convolutional
layers, followed by BN, a ReLu activation and a final
Sigmoid activation one. ZeroPadding, Cropping and
UpSampling layers are different in terms of parame-
ters to adjust the final output size.
The ECB and DCB have a similar structure,
formed by two unbalanced bonds, the first one has
three convolutional layers, while the second has only
one convolutional layer. The output of the bonds
is added and normalized to create the output of the
block. The main difference between the ECB and
Table 2: Detailed architecture of the Hypothesis Reinforce-
ment Block (HRB).
Hypothesis Reinforcement Block (HRB)
Layer Output size Parameters
Input 240 × 320 × 2 -
Convolution 120 × 160 × 64 kernel=(7, 7) / strides=(2, 2)
BN -
Activation ReLU
Max Pooling 40 × 53 × 64 size=(3, 3)
CBE 40 × 53 × 256
kernel=(3, 3) / strides=(1, 1)
(a=64, b=64, c=256)
CBE 20 × 27 × 512
kernel=(3, 3) / strides=(2, 2)
(a=128, b=128, c=512)
CBD 40 × 54 × 128
kernel=(3, 3) / strides=(2, 2)
(a=512, b=512, c=128)
CBD 80 × 108 × 64
kernel=(3, 3) / strides=(2, 2)
(a=256, b=256, c=64)
Up Sampling 240 × 324 × 64 size=(3, 3)
Cropping 240 × 320 × 64 cropping=[(0, 0) (2, 2)]
Convolution 240 × 320 × 64 kernel=(3, 3) / strides=(1, 1)
BN -
Activation ReLU
Convolution 240 × 320 × 1 kernel=(3, 3) / strides=(1, 1)
Activation Sigmoidal
Output 240 × 320 × 1 -
DCB is that the former uses convolutions whereas the
latter uses transposed convolutions as an approxima-
tion of deconvolutions.
Figure 3 shows the structure of a ECB and a DCB
blocks, where the parameters a, b and c are the depth
of the layer or the number of filters of the correspond-
ing layer.
+
c
c
b
a
+
c
c
b
a
Convolution
Batch Normalization
Transposed Convolution
ReLU activation
Decoding Convolutional Block (DCB)
Encoding Convolutional Block (ECB)
Figure 3: ECB and DCB architecture.
As it can be observed in figure 3, the number of
filters of the third convolution in the bottom line has
Towards Deep People Detection using CNNs Trained on Synthetic Images
227
to be equal to the number of filters in the top line (c
parameter). Parameters a, b y c of tables 1 and 2 and
in figure 3 have the same meaning.
3 TRAINING
As it has been explained in the introduction, the pro-
posed CNN has been trained using only synthetic
images. To do that, it has been used the GEIN-
TRA Synthetic Depth People Detection (GESDPD)
dataset (GESDPD, 2019), created by the authors, and
made available to the scientific community
1
. The
main characteristics of the GESDPD dataset are de-
scribed below. The use of synthetic depth images has
allowed the automatic labeling of the images, avoid-
ing the need for manual labeling.
3.1 The GESDPD Dataset
The GESDPD dataset (GESDPD, 2019) contains
22000 depth images, that simulate to have been taken
with a sensor in an elevated front position, in an in-
door working environment, generated using the sim-
ulation software Blender (Roosendaal et al., 2007).
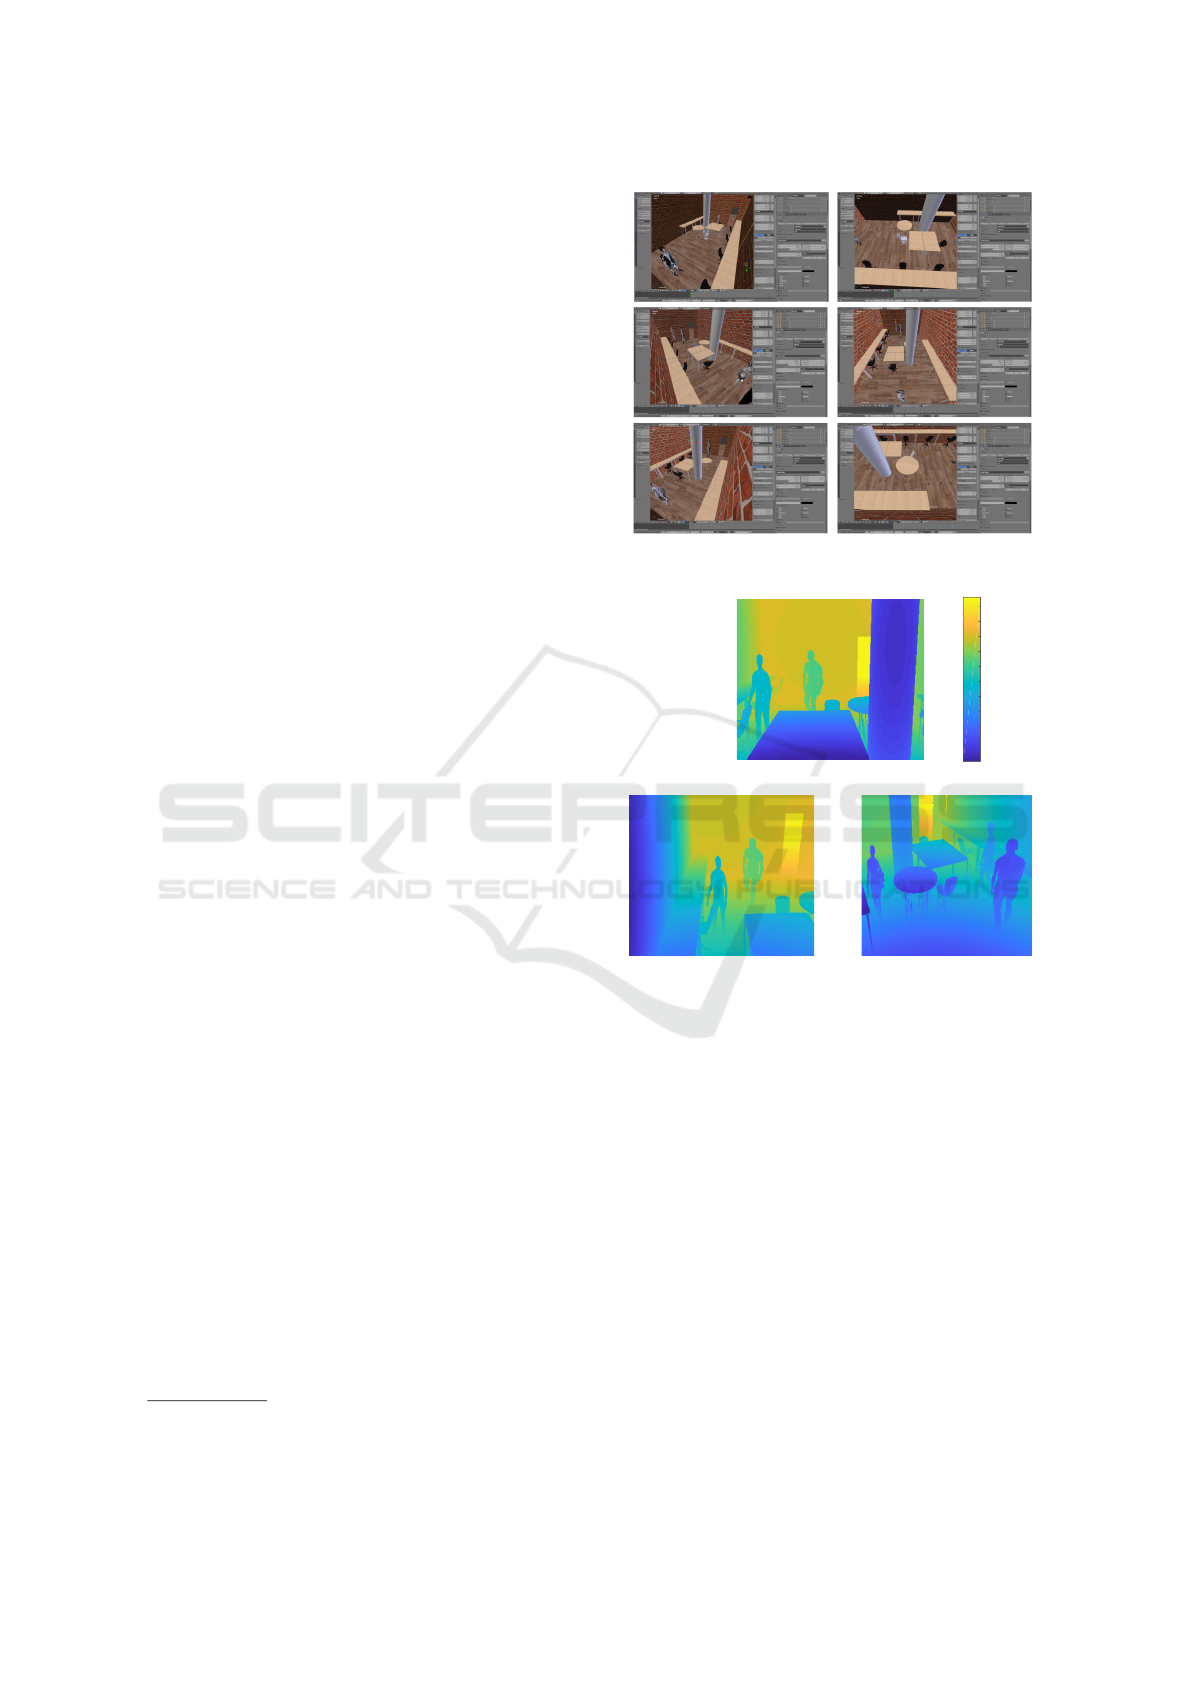
The simulated scene shows a room with different
people walking in different directions. The camera
perspective is not stationary, as it rotates and moves
along the dataset, which avoids a constant background
that could be learned by CNN in the training, as
can be seen in figure 4, that shows different perspec-
tives of the synthetic room in the simulation software
Blender (Blender Online Community, ). Using dif-
ferent backgrounds around the synthetic room allows
the CNN to see the background as noise and focus
the training in the people that come along the image,
immunizing the network to the change of camera per-
spective and assembly conditions.
The generated images have a resolution of 240 ×
320 pixels codified in 16 bits. Some examples of
the synthetic images are shown in figure 5, the im-
ages correspond to three different perspectives, and
the depth values are represented using a colormap.
Regarding the labeling, there have been placed
Gaussian functions over the centroid of the head of
each person in the scene, so that the centroid corre-
sponds to the center of the head 2D position and has
a normalized value of one. The standard deviation
(eq. 1) is constant for all the Gaussians, regardless of
the size of each head and the distance from the head to
the camera. Its value has been calculated based on an
1
Available online http://www.geintra-uah.org/datasets/
gesdpd
Figure 4: Blender simulated room with different perspec-
tives.
2500
3000
3500
4000
4500
5000
5500
6000
6500
7000
7500
Figure 5: Examples of synthetic depth images belonging to
the GESDPD dataset.
estimated value of the average diameter of a person’s
head, taking into account anthropocentric considera-
tions. Under these considerations, the chosen value is
15 pixels.
σ = D/2.5 = 15/2.5 = 6 (1)
Another important point related to labeling is the
overlap of different Gaussians. When two heads are
very close or overlapping with each other, the labeled
Gaussians do not add each other, instead of that, the
maximum value of them prevail, as shown in figure 6.
That modification provides a set of Gaussians that are
always separated, so that the CNN can learn to gener-
ate that separation between Gaussians in its output, fa-
cilitating the subsequent individual detection of peo-
ple in the scene.
VISAPP 2020 - 15th International Conference on Computer Vision Theory and Applications
228
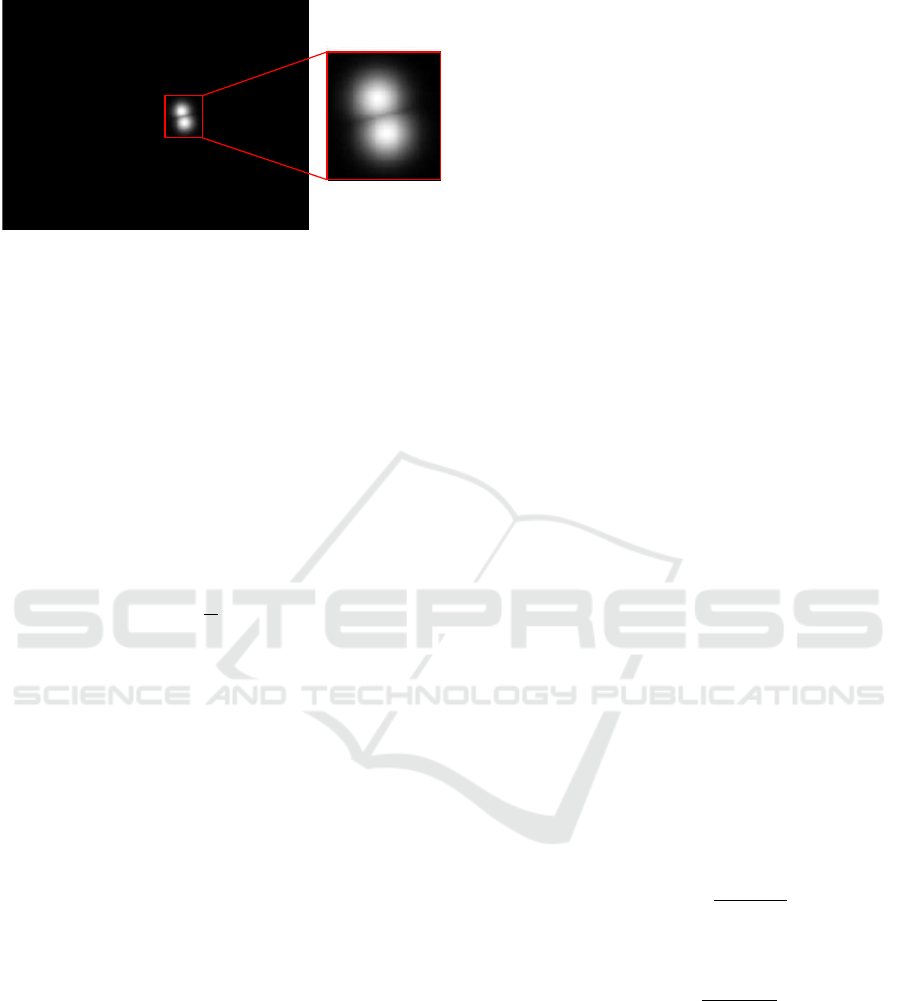
Figure 6: Labeled Gaussians detail.
3.2 Training Parameters
The 22000 available synthetic depth images have
been split into two groups: 19800 images (90%) are
used to train the CNN, whereas the remaining 2200
images (10%) are used for testing.
Regarding the parameters configured for the CNN
training, the loss function used is the Mean Square
Error between the ground-truth and the CNN output,
as it can be seen in the equation 2, where L repre-
sents the loss function, q
i
the network output and ˆq
i
the ground-truth.
L (q
i
, ˆq
i
) =
1
N
N
∑
i=1
( ˆq
i
− q
i
)
2
(2)
The chosen optimizer is Adam (Kingma and Ba,
2014), with a initial learning rate of 0.001 and early
stopping to avoid overfitting. Early Stopping allows
saving the best epoch weights of the CNN training
session, so the saved weights are the best of all the
training.
4 RESULTS
This section presents the main results obtained in this
work. As it has been said before, there have been used
2200 synthetic images (a 10% of the original dataset)
for the system evaluation. None of these images have
been used in the training stage. In a second test, there
have been obtained some results using real data from
the RGB-D Pedestrian Dataset (Bagautdinov, 2015;
Bagautdinov et al., 2015). In particular, there have
been used the EPFL-LAB scenes since it includes
people in a room at a distance and perspective similar
to the ones in the training dataset. However, both the
image sizes and camera locations are different from
the ones considered in the synthetic dataset.
To obtain the results, the same algorithm is used
for both tests, with the synthetic dataset and with the
real one. The only difference between them is the
variation of the region of interest (ROI), the area in
the image in which people are detected, which is ad-
justed depending on the characteristics of the dataset.
For each frame, there is a point array in the
ground-truth and another point array obtained by a bi-
narization (with a threshold of 0.6) of the confidence
map generated at the output of the HRB. Then, the
points from the ground-truth and the points gener-
ated by the CNN are associated, connecting between
them the closest ones, only if they are nearer than 37.5
pixels (that corresponds to the value of 2.5 times the
estimated average head diameter used in the expres-
sion 1). This limit must not be too restrictive be-
cause the ground-truth of the images in EPFL-LAB
dataset (Bagautdinov et al., 2015) is in bounding-box
format, so the estimated position of the head centroid
is not very precise.
The points in the ground-truth which are not con-
nected to any detection are considered as False Neg-
atives (FN) since the detection is not carried out. On
the other hand, the detections of the CNN which are
not connected to any point in the ground-truth are
False Positives (FP) since it is a wrong detection. Fi-
nally, the errors (FN or FP) outside the ROI are dis-
carded. It is worth highlighting that the ROI is defined
in 3 dimensions: the first two are a rectangle over the
image plane and the third one is a value of maximum
distance (depth). The number of FP and FN is shown
in absolute value and percentage respect to the total
number of points inside the ROI in the ground-truth.
To evaluate the people detection, there have also
been used the following metrics:
• Error: The total error represents the sum of False
Negatives (FN) plus False Positives (FP).
Error = FP + FN (3)
• Precision: represents the probability that a detec-
tion will be made correctly.
Precision =
T P
T P + FP
(4)
• Recall: represents probability that a person will
be detected.
Recall =
T P
T P + FN
(5)
4.1 Results with Synthetic Data
During the evaluation with synthetic data, the ROI
comprehends the whole image since there is no noise,
so there is no need to discard points in the ground-
truth or detections in the edges of the image. More-
over, the synthetic data does not present the prob-
lem of maximum valid distance so all points have
Towards Deep People Detection using CNNs Trained on Synthetic Images
229
been taken into account (both, for the ground-truth
and the detections), regardless of its distance. Table
3 presents the results obtained during the evaluation
with synthetic data.
Table 3: Results with synthetic data.
Region of interest (ROI) [(0, 0), (320, 240), inf]
Number of frames 2200
Points in the ground-truth 3176
False Negatives (FN) 212 (6.68%)
False Positives (FP) 3 (0.09%)
Error 215 (6.77%)
Precision 99.89%
Recall 93.32%
As it can be seen in table 3, the system barely
makes wrong detections. However, there is a 6.68%
of people in the ground-truth who are not detected.
Going deeper into this fact, it has been observed
that the errors occur at moments when several peo-
ple are very close and occlusions appear. It must
be taken into account that the dataset has been la-
beled automatically by the Blender simulation soft-
ware (Roosendaal et al., 2007), which labels people
even when total occlusions happen. In these cases, it
is impossible for the CNN to detect the person.
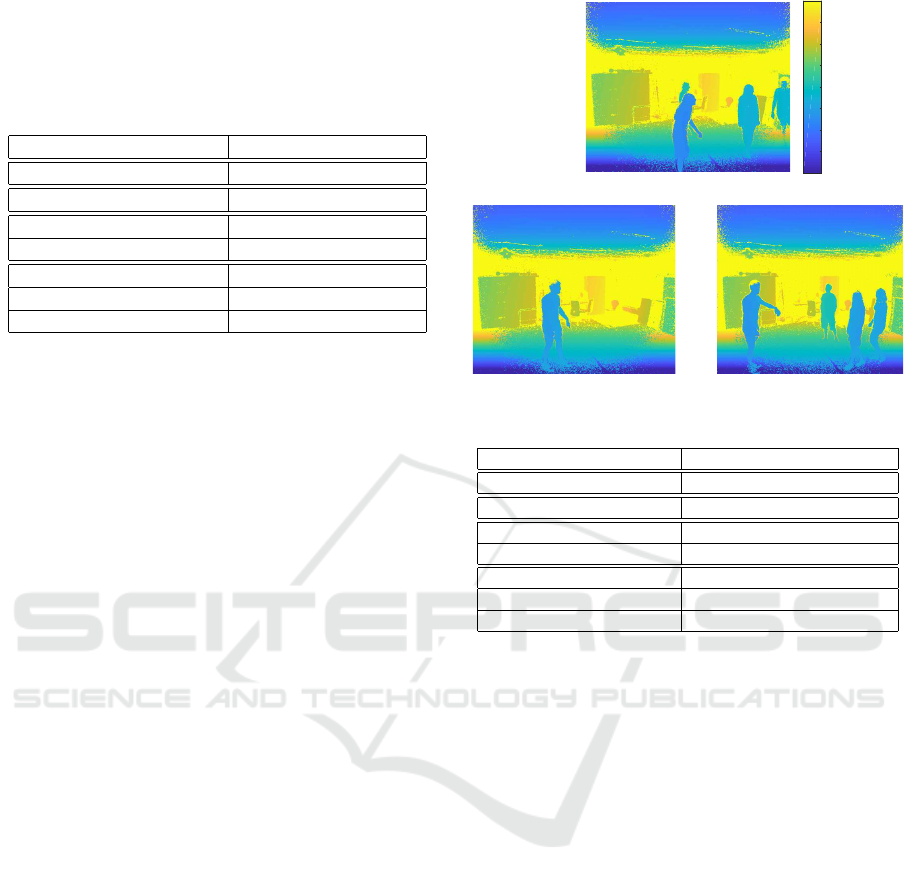
4.2 Results with Real Data
The system has also been evaluated using real data.
To do that, there have been carried out several exper-
imental tests using the EPFL-LAB dataset (available
in (Bagautdinov, 2015)), which includes 950 RGB-
D images, with a resolution of 512 × 424 pixels, that
are coded into 16-bit unsigned integers. To adapt
the images to the input layer, they have been scaled
to 320 × 240 pixels. In addition, the points with a
null value, which correspond to an erroneous distance
measurement have been replaced by the maximum
depth value in the dataset, because otherwise the net-
work process these values as points of zero distance
instead of errors. The EPFL-LAB images show a
room, similar to the one simulated in the synthetic
data, where it can appear up to 4 people. The cam-
era is in an elevated frontal position, within a slope
similar to the one in the training dataset. Figure 7
shows some examples of the images from the EPFL-
LAB dataset.
In these experiments, the ROI does not include the
edges of the scene where people does not appear com-
plete. Moreover, the maximum distance used for eval-
uation has been set to 3.5 meters as distance measure-
ments worsen significantly at greater distances. Table
4 shows the obtained results.
0
1000
2000
3000
4000
5000
6000
7000
8000
Figure 7: Images from the EPFL-LAB dataset.
Table 4: Results with real data.
Region of interest (ROI) [(20, 55), (300, 205), 3500]
Number of frames 950
Points in the ground-truth 1959
False Negatives (FN) 474 (24.07%)
False Positives (FP) 3 (0.15%)
Error 477 (24.35%)
Precision 99.80%
Recall 75.80%
Similarly to results in the case of synthetic data,
table 4 manifests that the system does not generate
wrong detections since there is not a significant num-
ber of FP. On the other hand, FN are more frequent
and they appear mainly when there exist important
occlusions in the scene.
The obtained results are also compared to other
methods in the state-of-the-art which use the same
dataset. These methods are DPOM, proposed in
(Bagautdinov et al., 2015), which use depth infor-
mation; ACF, detector of (Doll
´
ar, ) which uses color
information; PCL-MUNARO, proposed in (Munaro
and Menegatti, 2014) and based in RGB-D informa-
tion; and, finally, Kinect II with the results obtained
by Kinect for Windows SDK 2.0 (Microsoft, 2014)
which uses RGB-D information.
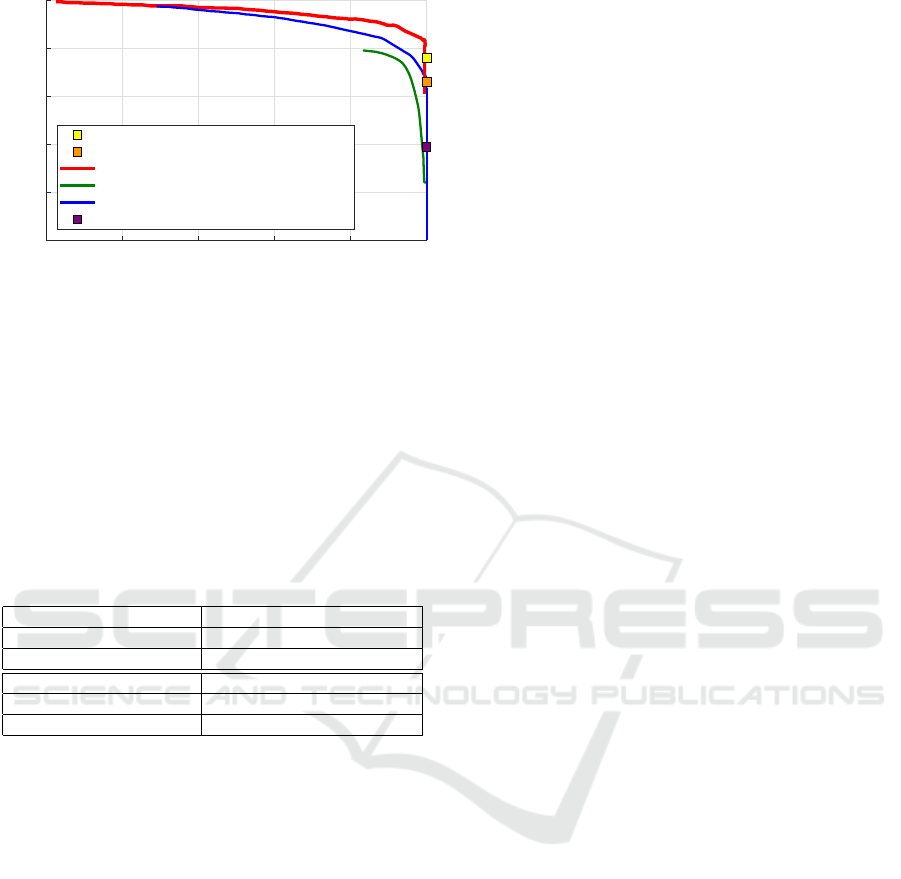
Figure 8 shows the results presented in (Bagaut-
dinov et al., 2015) for the mentioned algorithms.
The results of the proposed system (identified as
CNN) are also presented for two values of maximum
distance: 3.5 meters, used in the proposed evaluation,
and 4.5 meters, used in (Bagautdinov et al., 2015).
VISAPP 2020 - 15th International Conference on Computer Vision Theory and Applications
230
0 0.2 0.4 0.6 0.8 1
Precision
0
0.2
0.4
0.6
0.8
1
Recall
DPOM (D)
ACF (RGB)
PCL-MUNARO (RGB-D)
KINECT2 (RGB-D)
CNN (D) (maximum distance 3.5 m)
CNN (D) (maximum distance 4.5 m)
Figure 8: Comparison of the proposal with other ap-
proaches for people detection.
The proposals whose results are displayed with a
curve (DPOM, ACF, PCL-MUNARO) apply a thresh-
old in the detection algorithm that allows obtaining
different values for the Precision-Recall point. Our
system and Kinect II, only display the results with one
Precision-Recall point since the threshold to vary the
Precision-Recall point is not applied in the detection.
The numerical values of the Precision-Recall point
are shown in Table 5.
Table 5: Precision and recall results.
Region of interest (ROI) [(20, 55), (300, 205), 3500]
Precision 0.99
Recall 0.76
Region of interest (ROI) [(20, 55), (300, 205), 4500]
Precision 0.99
Recall 0.66
As it can be seen in figure 8 and Table 5, the pro-
posed system based on CNNs obtains close to a 100%
of accuracy since it does not generate FP, so the de-
tections are very precise. The recall values obtained
(0.66 and 0.76) indicate that the system generates FN
and the number of them increases with the maximum
distance of evaluation. It can be easily demonstrated
that people partially occluded, which are in the fur-
thest position of the scene, produce those FN. How-
ever, the system performs in a similar way or even bet-
ter than some of the state-of-the-art proposals shown
in figure 8, especially taking into account that the
training is performed using only synthetic data.
4.3 Timing Results
The average frame rate of the system is 42 FPS
(frames per second), benchmarked on a conventional
Linux desktop PC, with a Processor Intel
R
Core(TM)
i7-6700K CPU @ 4.00 GHz with 64 GB of RAM, and
an NVIDIA GTX-1080 TI GPU.
5 CONCLUSIONS
This work describes a system for people detection in
real-time from depth images, which allows preserving
people’s privacy since it is not possible to recognize
their identity from these images. The system is based
on a CNN, composed of two main stages: the main
block and the hypothesis refinement block, both of
them based on residual blocks. Moreover, the CNN
has been trained using only synthetic data, created and
labeled automatically by the Blender simulator. This
allows training the system with a high amount of data
without having to acquire and label them manually.
For the evaluation of the system there have been
used both, synthetic and real data, obtaining an accu-
racy close to the 100%, since it does not generate false
detections. In addition, these results have been com-
pared with those of other state-of-the-art alternatives
evaluated on the same dataset, determining that the re-
sults are similar, despite the fact that the training has
been carried out using only synthetic depth images.
In order to improve the robustness of the proposed
system, the main line of future work is to retrain the
system with real depth images. This training could
be carried out with a reduced number of data, as it is
based on a pre-trained network. In this way it is pos-
sible to train a system in two stages: first, with a large
number of synthetic data that do not need manual la-
beling, and then with a reduced number of real data,
avoiding the cost of manual acquisition and labeling
of a large dataset.
ACKNOWLEDGEMENTS
This work has been supported by the Spanish Min-
istry of Economy and Competitiveness under projects
HEIMDAL-UAH (TIN2016-75982-C2-1-R) and
ARTEMISA (TIN2016-80939-R), and by the Univer-
sity of Alcal
´
a under projects JANO CCGP2017/EXP-
025) and ACERCA (CCG2018/EXP-029).
REFERENCES
Bagautdinov, T. (2015). Rgb-d pedestrian dataset. https:
//cvlab.epfl.ch/data/data-rgbd-pedestrian/.
Bagautdinov, T., Fleuret, F., and Fua, P. (2015). Probabil-
ity occupancy maps for occluded depth images. In
The IEEE Conference on Computer Vision and Pat-
tern Recognition (CVPR).
Bevilacqua, A., Di Stefano, L., and Azzari, P. (2006). Peo-
ple tracking using a time-of-flight depth sensor. In
Video and Signal Based Surveillance, 2006. AVSS ’06.
IEEE International Conference on, pages 89–89.
Towards Deep People Detection using CNNs Trained on Synthetic Images
231

Blender Online Community. Blender a 3d modelling pack-
age.
Chollet, F. (2016). Xception: Deep learning with depthwise
separable convolutions. cite arxiv:1610.02357.
Doll
´
ar, P. Piotr’s Computer Vision Matlab Toolbox (PMT).
https://github.com/pdollar/toolbox.
GESDPD (2019). The GEINTRA Synthetic Depth Peo-
ple Detection (GESDPD) database. Available on-
line http://www.geintra-uah.org/datasets/gesdpd. (ac-
cessed July 2019).
He, K., Zhang, X., Ren, S., and Sun, J. (2016). Deep resid-
ual learning for image recognition. In Proceedings of
the IEEE conference on computer vision and pattern
recognition, pages 770–778.
Ioffe, S. and Szegedy, C. (2015). Batch normalization: Ac-
celerating deep network training by reducing internal
covariate shift. arXiv preprint arXiv:1502.03167.
Jeong, C. Y., Choi, S., and Han, S. W. (2013). A method
for counting moving and stationary people by interest
point classification. In Image Processing (ICIP), 2013
20th IEEE International Conference on, pages 4545–
4548.
Kingma, D. P. and Ba, J. (2014). Adam: A
method for stochastic optimization. arXiv preprint
arXiv:1412.6980.
Lange, R. and Seitz, P. (2001). Solid-state time-of-flight
range camera. Quantum Electronics, IEEE Journal
of, 37(3):390–397.
Luna, C. A., Losada-Gutierrez, C., Fuentes-Jimenez,
D., Fernandez-Rincon, A., Mazo, M., and Macias-
Guarasa, J. (2017). Robust people detection using
depth information from an overhead time-of-flight
camera. Expert Systems with Applications, 71:240–
256.
Microsoft (2014). Kinect for windows sdk 2.0.
Munaro, M. and Menegatti, E. (2014). Fast rgb-d people
tracking for service robots. Auton. Robots, 37(3):227–
242.
Ramanan, D., Forsyth, D. A., and Zisserman, A. (2006).
Tracking People by Learning Their Appearance. Pat-
tern Analysis and Machine Intelligence, IEEE Trans-
actions on, 29(1):65–81.
Roosendaal, T., Hess, R., and Foundation, B. (2007). The
Essential Blender: Guide to 3D Creation with the
Open Source Suite Blender. No Starch Press Series.
No Starch Press.
Sell, J. and O’Connor, P. (2014). The Xbox one system on
a chip and Kinect sensor. Micro, IEEE, 34(2):44–53.
Stahlschmidt, C., Gavriilidis, A., Velten, J., and Kummert,
A. (2013). People detection and tracking from a
top-view position using a time-of-flight camera. In
Dziech, A. and Czyazwski, A., editors, Multimedia
Communications, Services and Security, volume 368
of Communications in Computer and Information Sci-
ence, pages 213–223. Springer Berlin Heidelberg.
Wang, C. and Zhao, Y. (2017). Multi-layer proposal net-
work for people counting in crowded scene. In Intel-
ligent Computation Technology and Automation (ICI-
CTA), 2017 10th International Conference on, pages
148–151. IEEE.
Zhang, X., Yan, J., Feng, S., Lei, Z., Yi, D., and Li, S.
(2012). Water filling: Unsupervised people counting
via vertical Kinect sensor. In Advanced Video and
Signal-Based Surveillance (AVSS), 2012 IEEE Ninth
International Conference on, pages 215–220.
Zhao, J., Zhang, G., Tian, L., and Chen, Y. Q. (2017). Real-
time human detection with depth camera via a phys-
ical radius-depth detector and a cnn descriptor. In
2017 IEEE International Conference on Multimedia
and Expo (ICME), pages 1536–1541.
VISAPP 2020 - 15th International Conference on Computer Vision Theory and Applications
232
