
Ambient Light Contribution as a Reference for Motion Artefacts
Reduction in Photoplethysmography
Nicolas De Pinho Ferreira
a
, Claudine Gehin
b
and Bertrand Massot
c
INL, CNRS UMR5270, INSA Lyon, Univ. Lyon, Villeurbanne, France
Keywords:
Heart Rate, Photoplethysmography, Motion Artefacts, Ambient Light, Adaptive Filtering.
Abstract:
Measuring the heart rate from a convenient location such as the wrist is commonly achieved using photo-
plethysmography. As a consequence, this method is widely used on commercial wearable devices. Unfortu-
nately, it also highly suffers from motion artefacts superimposed into the cardiac frequency band which gener-
ally lead to incorrect heart rate estimation. In this paper we propose a new approach that uses the ambient light
contribution as a reference for motion artefacts reduction. Contrarily to accelerometer-based techniques, the
proposed method does not require any additional hardware. Moreover, it is especially efficient for reduction
of micro-motions that can’t be addressed using conventionally used accelerometry. Using the ambient light
signal as a reference in association with adaptive filtering has demonstrated promising results for the reduction
of artefacts during both periodic and random motion events.
1 INTRODUCTION
The most commonly used technique for heart rate
(HR) measurement with wearable devices is the
photoplethysmography (PPG). This non-invasive and
low-cost technique enables measurement from conve-
nient locations such as wrist, finger or earlobe. Ba-
sically, a photoplethysmographic measurement sys-
tem is comprised of two opto-electronic elements, a
photoemitter, usually a light-emitting diode (LED),
and a photodetector, usually a photodiode (PD). As
measurement front ends are readily available off-the-
shelf in tiny integrated circuits, it can be integrated in
small form factor devices and thus, used for ambula-
tory measurements.
The measurement principle of PPG is based on
the detection of volume change (plethysmography)
caused by cardiac activity. In this particular con-
figuration, changes are evaluated by an optical tech-
nique. In regard to cardiac activity, during diastole,
blood is ejected through the aortic valve in the cir-
culatory system which causes a local increase of vol-
ume in elastic arteries, muscular arteries and arteri-
oles. When this volume increases, the local absorp-
tion coefficient is augmented and consequently the
a
https://orcid.org/0000-0001-8462-6008
b
https://orcid.org/0000-0002-5399-119X
c
https://orcid.org/0000-0001-8489-888X
variation can be measured, according to the Beer-
Lambert Law (Hu et al., 2013). Depending on the
relative position between the LED and the PD, a pho-
toplethysmographic acquisition system can be used
in reflection-mode or transmission-mode. When both
optical elements are placed on the same surface and
applied onto the measurement site (for example, upon
the wrist), this is called reflection-mode. On the con-
trary, in the transmission-mode, optical elements are
placed from either side of the measurement site (for
example, across the finger).
When using photoplethysmography for heart rate
acquisition, motion artefacts are one of the main is-
sues to be addressed, particularly in ambulatory con-
ditions. As long as the user stays still and thus no mo-
tion is induced at the measurement site, photoplethys-
mographic signal frequency is representative of car-
diac activity and heart rate (Jan et al., 2019). How-
ever when the user starts a physical activity such as
walking, running or any other activity that can imply
motion on the measurement site, this will induce un-
wanted noise on the PPG signal. Unfortunately, this
noise has a spectral content which overlaps with car-
diac band and thus, can’t be removed using conven-
tional linear filtering techniques.
A common way of addressing this issue is to use
an auxiliary reference signal that contains correlated
information on motions that occur on the measure-
ment site. This reference signal can then be used with
De Pinho Ferreira, N., Gehin, C. and Massot, B.
Ambient Light Contribution as a Reference for Motion Artefacts Reduction in Photoplethysmography.
DOI: 10.5220/0008878800230032
In Proceedings of the 13th International Joint Conference on Biomedical Engineering Systems and Technologies (BIOSTEC 2020) - Volume 1: BIODEVICES, pages 23-32
ISBN: 978-989-758-398-8; ISSN: 2184-4305
Copyright
c
2022 by SCITEPRESS – Science and Technology Publications, Lda. All rights reserved
23

a signal processing technique such as adaptive filter-
ing. In the literature, accelerometry is a commonly
used reference signal as it contains motion-correlated
information (Lee et al., 2010). Other proposed tech-
niques use dual wavelength PPG, where one channel
is used as reference (Zhang et al., 2019). In con-
ventional PPG acquisition systems, ambient light is
removed from PPG signal as it represents a noise
source and could lead to wrong physiological param-
eters evaluation. In this work, we attempted to use the
contribution of this ambient light received directly by
the PPG sensor, as a reference signal for adaptive fil-
tering.
The paper is organised as follow : in section 2,
hardware developed for ambient light acquisition by
PPG sensor is described. Then in section 3, signals
acquired and their content are analysed; the high de-
gree of correlation obtained during motion artefacts
events is discussed. After demonstrating the inter-
est of ambient light for motion artefacts reduction, we
propose a signal processing toolchain developed with
MATLAB (The MathWorks, Massachusetts, US) in
section 4. This toolchain is used for addressing both
periodic and random motion artefacts.
2 MEASUREMENT SETUP
2.1 Hardware
Photoplethysmographic acquisitions were made us-
ing a MAX86140EVSYS (Maxim Integrated, Califor-
nia, US) evaluation kit and a custom designed optical
board. The original microcontroller board from the
evaluation kit and the custom designed optical board
were both linked with a flexible cable, allowing for
convenient placement of optical elements. PPG ac-
quisition relies on a MAX86141 (Maxim Integrated,
California, US) Analog Front End (AFE) in associa-
tion with SFH 2201 wide-band photo-diodes and LT
P4SG-V1AB-36 528 nm LEDs. During all measure-
ments, the system was battery powered for a maxi-
mum freedom of movement. The overall architecture
of the system is presented on Fig. 1.
In addition to classic PPG measurements, the opti-
cal board featured a 3-axis accelerometer whose data
were simultaneously recorded. Acquired measure-
ments can be directly stored in an embedded flash
memory or sent wirelessly in real-time via a Blue-
tooth radio-frequency communication. All recordings
presented in this paper were made on the left wrist,
and the optical board was placed on the bottom side
of the wrist while the microcontroller board was on
the upper side.
CPU BOARD
OPTICAL BOARD
SPI
PPG AFE
(MAX86141)
ACCELEROMETER
(BMA280)
CPU
(MAX32630)
BT RADIO
(NRF52832)
FLASH
(S25FS256)
LED
PD
LED
PMIC
(MAX20303)
23 mm
12 mm
BOTTOM
TOP
PD
35 mm
17 mm
Figure 1: Acquisition system architecture.
2.2 Ambient Light
When normally used, the MAX86141 PPG AFE au-
tomatically removes the ambient light contribution on
acquired samples. The acquisition timings of the cir-
cuit are represented on Fig. 2. As a first step, both
LEDs are driven on, and after a short settling time,
a sample from the photodiode is acquired and inte-
grated during the time T
INT
. Then, LEDs are turned
off and a new sample representative of the ambient
light is acquired from the photodiode. This process is
repeated periodically every T
SAMP
. The value stored
during the ambient exposure phase is then used to re-
move contribution of ambient light. Depending on
the analog front end used, different Ambient Light
Cancellation (ALC) strategies exist. For example,
the stored value can be used to drive an analog cir-
cuitry that will sink current corresponding to ambi-
ent exposure. Ideally, in this configuration, the digi-
tized value is free of ambient light contribution. This
method has the advantage of preventing saturation of
transimpedance amplifier and analog-to-digital con-
verters. In a digital approach, the measured ambient
sample value can be subtracted from the LED expo-
sure sample.
While internal ambient light cancellation is en-
abled, the PPG AFE can be configured to retrieve
the ambient light value measured. For this purpose,
the PPG front end configuration was modified and
both ambient light and PPG exposure were recorded.
This technique does not require any additional hard-
ware from a conventional PPG setup. However, as the
MAX86141 can be used with two photo-diodes, this
feature could be used in our case to increase robust-
ness of developed motion artefact reduction technique
as discussed in section 3.
BIODEVICES 2020 - 13th International Conference on Biomedical Electronics and Devices
24

LEDs
EXPOSURE
AMBIENT
EXPOSURE
T
PD
LED
Driving
LEDs
TSAMP
TINT TINT
T
Figure 2: PPG AFE Acquisition Timing.
3 ACQUIRED SIGNALS
3.1 First Approach
In a first approach, both ambient and PPG signals
were recorded while doing multiple, periodic and
wide amplitude motions such as arm shaking; as well
as lower amplitude movements such as hand waving
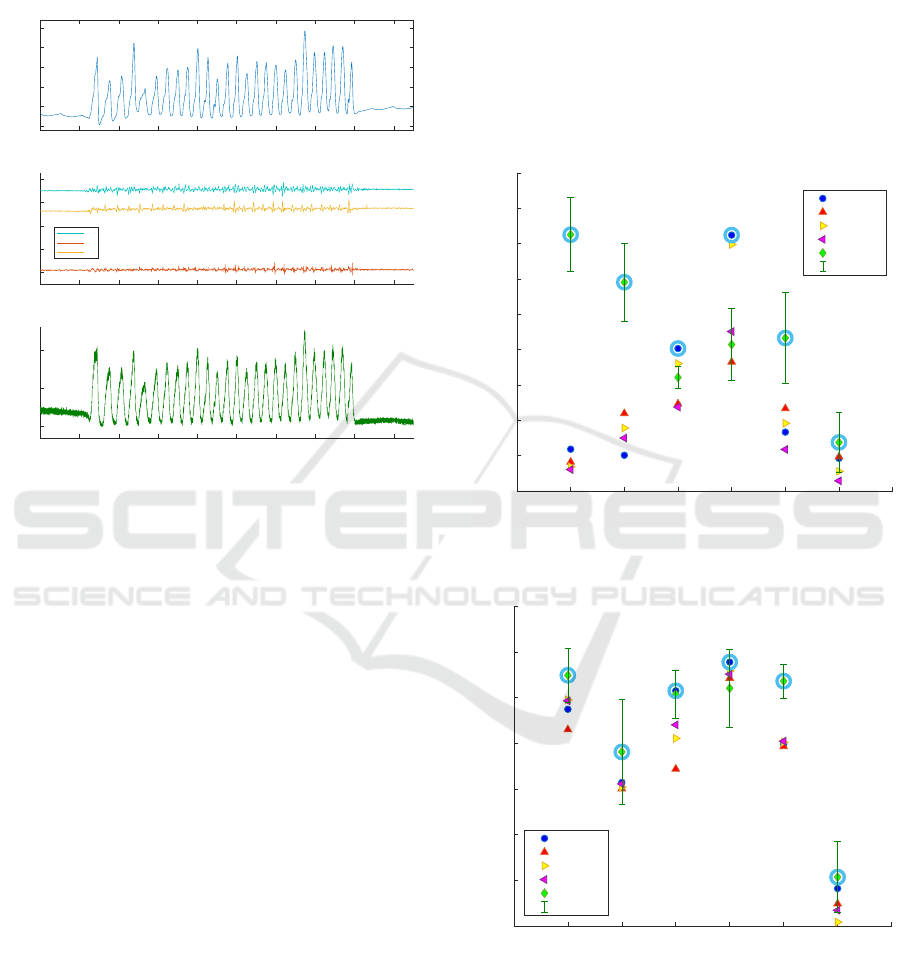
and opening/closing. Plots on Fig. 3 are unprocessed
data coming from the evaluation kit. Only signal nor-
malisation has been applied on PPG and ambient light
recordings. For all measurements presented in this pa-
per, internal ALC system of MAX86141 was enabled.
0 20 40 60 80 100 120 140
Time (s)
0.7
0.8
0.9
1
RAW PPG
0 20 40 60 80 100 120 140
Time (s)
0.5
0.6
0.7
0.8
0.9
1
RAW Ambient light
0 20 40 60 80 100 120 140
Time (s)
-0.5
0
0.5
Cros-correlation
Cross-correlation
Figure 3: PPG and ambient recording during motion events.
A clear matching between PPG and ambient light
recordings during motion events can be observed.
Additionally, windowed cross-correlation bears out
the visual similarity between both waveforms during
motion events. The window size is 512 points, which
represents a duration of 4 seconds, for a 128 Hz sam-
pling frequency.
This high degree of similarity can be explained as
follows: when motion occurs, the relative distance be-
tween user’s skin and optical elements is modified,
which implies a variation of the ambient light amount
received by the photo-detector. As the induced mo-
tion is periodic, the fine variation in amount of light
received follows a periodic pattern.
However, as shown on Fig. 3, ambient light can
also contain noise. Even if no motion occurs, the am-
bient light signal is still comprised of a low ampli-
tude high frequency noise. This noise can come from
sources such as fluorescent light, flickering or fast am-
bient variation and should also be removed before sig-
nal processing.
In addition, when wide amplitude motion occurs
(like arm shaking at the end of this dataset), cross-
correlation does not show an agreement as high as
during smaller amplitude motions. In this particular
situation, the amount of ambient light measured onto
the photodiode does not only represent a contact mod-
ification between optical elements and wrist, but is
also representative of real ambient light variations.
PD2 (UPPER)
PD1 (UNDER)
LED1 (UNDER)
Figure 4: Possible concept for handling wide MA.
A possible approach to overcome this issue would
be to use an auxiliary photodiode, mounted on the up-
per side of the device (PD2) as described on Fig. 4.
This would allow to remove the real ambient contri-
bution detected by the first photodiode (PD1). An-
other approach would be to choose dynamically be-
tween ambient or accelerometry signals as a reference
for motion artefact reduction depending on the type of
movements detected using the accelerometer.
3.2 Micro-motions
For specific events such as micro-motions, the ambi-
ent light signal features a clear periodic component,
contrarily to conventionally used accelerometry. As
it can be seen on Fig. 5, small hand motions (fingers
waving in that case) cause significant noise on PPG
signal. Meanwhile, in this configuration, the wrist is
Ambient Light Contribution as a Reference for Motion Artefacts Reduction in Photoplethysmography
25
standing still and an accelerometer is not able to de-
tect this motion onto the measurement site, as the ac-
celeration recorded along all the three axes does not
show any clear periodic component.
32 34 36 38 40 42 44 46 48 50
Time (s)
0.65
0.7
0.75
0.8
0.85
0.9
Amplitude (AU)
RAW PPG
32 34 36 38 40 42 44 46 48 50
Time (s)
-0.6
-0.4
-0.2
0
0.2
Amplitude (AU)
RAW Acceleration
AX
AY
AZ
32 34 36 38 40 42 44 46 48 50
Time (s)
0.4
0.45
0.5
Amplitude (AU)
RAW Ambient light
Figure 5: PPG, accelerometry and ambient light.
On the particular signal window represented on
Fig. 5, the highest cross-correlation coefficient was
obtained between PPG recording and ambient light
(A
L
) with a value of 0.9641, rather than with the accel-
eration magnitude (A
N
) which led to a value of 0.2687
(the highest cross-correlation value was found along
the x-axis : A
X
= 0.1801, A
Y
= -0.2029, A
Z
= -0.0700).
3.3 Analysis
To identify what type of motion is most likely to be
removed by ambient light or by any another refer-
ence signal, we used cross correlation and mutual in-
formation as indicators of similarity (Tautan et al.,
2015). For this purpose, we used MATLAB (The
MathWorks, Massachusetts, US) in addition with a
specific toolbox for mutual information computation
(Brown et al., 2012). Preliminary results for this in-
vivo experiment were obtained from six healthy vol-
untary subjects (2 female, 4 male) whose written con-
sent was obtained. The age of the participants was
36 years old ± 11. Subjects were told to successively
perform each type of motion during 10 s each, sepa-
rated with 10 s of rest. The following situations were
considered :
1. Hand / fist opening and closing
2. Finger tapping on table
3. Moving forearm from elbow up and down
4. Moving forearm from elbow right and left
5. Moving fingers in a waving fashion
6. Motionless, in a resting situation
The cross-correlation coefficient values obtained
between PPG recording and reference signals for each
situation listed are shown on Fig. 6. The results for
mutual information are shown on Fig. 7.
0 1 2 3 4 5 6 7
Motion type
0
0.1
0.2
0.3
0.4
0.5
0.6
0.7
0.8
0.9
Correlation coefficient
Absolute value of cross-correlation
ACCX
ACCY
ACCZ
ACCN
Ambient
Std. Dev.
Figure 6: Cross correlation between PPG and references.
0 1 2 3 4 5 6 7
Motion type
2
2.5
3
3.5
4
4.5
5
5.5
Mutual Info. Value
Mutual Information
ACCX
ACCY
ACCZ
ACCN
Ambient
Std. Dev.
Figure 7: Mutual Information between PPG and references.
In most situations, ambient light (AL) reference
signal features the highest degree of correlation and
mutual information. Moreover, ambient light pro-
vides far better results for MA reduction during sit-
uations where micro-motions occur which can not
be detected using the accelerometer. On the other
BIODEVICES 2020 - 13th International Conference on Biomedical Electronics and Devices
26
hand, when wide amplitude motions occur, the ac-
celerometer signals contain a clear periodic compo-
nent whereas ambient light reference suffers from real
exposure modifications. In this configuration, the am-
bient light reference does not only contain motion-
correlated information but also real ambient light cor-
related information. As a consequence, this situation
could reduce the performances of an adaptive filter
if using ambient light information only. In case of a
combination of micro-motions described previously,
which is a much more realistic situation than station-
ary and periodic motions, ambient light still indicates
a higher degree of correlation and mutual information
than accelerometry. For signal processing in section
4, we will focus on micro-motions that feature a high
degree of correlation and that can’t be addressed us-
ing conventional accelerometry.
Another parameter that influences degree of cor-
relation and mutual information between ambient and
PPG is time delay. As a function of the consid-
ered motion, a time delay exists between the moment
where motion artefact occurs on the reference signal
and the resulting alteration of PPG signals (Gibbs and
Asada, 2005). However for evaluation of correlation
and mutual information, there was no additional time
delay introduced.
4 SIGNAL PROCESSING
4.1 Requirements
In order to extract physiological parameters such as
Heart Rate (HR) or Peripheral Oxygen Saturation
(SPO
2
) from PPG signals whose integrity is compro-
mised by motion artefacts, several signal processing
techniques were proposed in prior art. These tech-
niques can be classified as follows :
• Time domain methods, which use Least Mean
Square (LMS) (Ram et al., 2012) or Recursive
Least Squares (RLS) adaptive filters;
• Frequency domain methods, such as Spectral Sub-
traction (SS) (Islam et al., 2019);
• Hybrid methods that feature a time-frequency
approach such as Ensemble Empirical Mode
Decomposition (EEMD) and adaptive filtering
(Khan et al., 2016).
Contrary to multi-spectral techniques, the pro-
posed reference signal in this work (ambient light)
does not contain any cardiac component. Conse-
quently, it does not require any high computing cost
algorithm such as Continuous Wavelet Transform
(CWT) spectrum subtraction (Zhang et al., 2019). In
this section, we demonstrate the ability of ambient
light to reduce motion artefacts using both frequency
and time domain methods.
4.2 Frequency Domain
In a first approach, the spectral content of both am-
bient light and PPG recording during motion events
are analysed. All signals are band-pass filtered from
0.5 to 10 Hz using a 4
th
order FIR, to remove high
frequency noise present on ambient signal. On the
PPG signal, this removes the DC component and lim-
its contribution of noise outside of cardiac frequency
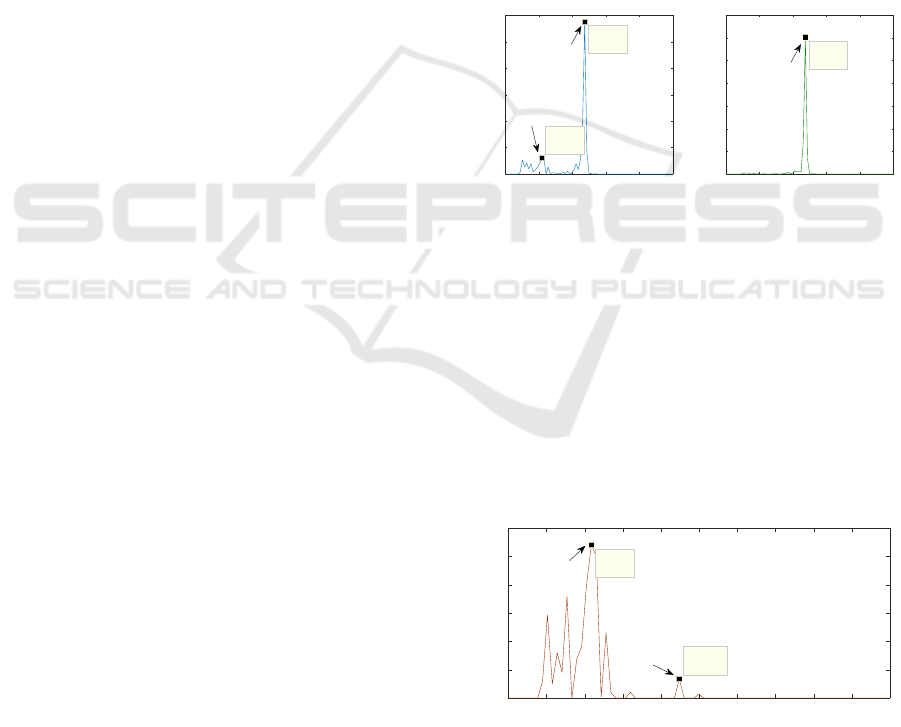
range. Once the signal is filtered, Discrete Fourier
Transform (DFT) is computed to obtain the power
spectrum as shown on Fig. 8.
0 1 2 3 4 5
Frequency (Hz)
0
5
10
15
20
25
30
Power density (dB/Hz)
PPG PSD During motion event
0 1 2 3 4 5
Frequency (Hz)
0
20
40
60
80
100
120
140
Power density (dB/Hz)
Ambient PSD During motion event
X: 2.367
Y: 28.78
X: 2.367
Y: 120.6
X: 1.087
Y: 3.055
Motion peak
Motion peak
HR component
Figure 8: PPG and ambient spectral content during motion.
Although PPG spectrum contains HR related in-
formation with a small peak around 1.087 Hz (65
BPM), most of the power is located on the 2.367
Hz peak, corresponding to the elicited motion arte-
fact (MA). A high power peak at same frequency is
shown on ambient light spectrum. If we consider mo-
tion artefacts superimposed onto PPG spectrum as an
additive noise and a stationary process, we can use
Spectral Subtraction (Vaseghi, 2001). As a proof of
concept, both power spectrum were normalised and
ambient contribution subtracted from PPG.
0 0.5 1 1.5 2 2.5 3 3.5 4 4.5 5
Frequency (Hz)
0
0.5
1
1.5
2
2.5
3
Power density (dB/Hz)
X: 1.087
Y: 2.708
X: 2.239
Y: 0.3397
HR peak
Residual MA
Figure 9: Resulting spectral subtraction.
This approach led to the power spectrum shown
on Fig. 9. The cardiac component peak is now clearly
visible. By applying an Inverse Discrete Fourier
Ambient Light Contribution as a Reference for Motion Artefacts Reduction in Photoplethysmography
27

Transform (IDFT), resulting time domain waveform
can be evaluated, see Fig. 10.
0 5 10 15
Time (s)
-0.015
-0.01
-0.005
0
0.005
0.01
0.015
Amplitude (A.U)
Restored PPG using spectrum substraction
0 5 10 15
Time (s)
-4
-2
0
2
4
Amplitude (A.U)
10
4
Original PPG
Figure 10: Time-domain PPG before and after spectral sub-
traction.
Although this technique has a relative low
computing-cost, it requires a stationary noise over the
considered window. In this particular case, window
was hand-selected, but in practice this might not be
suitable for online noise cancellation.
4.3 Adaptive Filtering
A possible signal processing approach for motion
artefact reduction is the use of adaptive filtering,
whose principle is represented on Fig. 11.
A
LMS update
algorithm
D(n) = S(n) + x’(n)
X(n)
E(n)
Y(n)
PPG
AMBIENT
Filter
output
Variable
filter
+
-
ΔWN
Figure 11: LMS Adaptive filter content.
This type of filter is widely used for noise re-
duction when an additional noise reference correlated
with the original signal that has to be de-noised is
available. It is based on a stochastic gradient descent:
the general idea is to design an ideal filter whose co-
efficients are iteratively computed using an optimisa-
tion algorithm. The Least Mean Squares (LMS) algo-
rithm applied here uses a reference input, X(n), as an
additional information source on noise contained in
D(n). For efficient coefficient optimisation and thus
filtering, signal D(n) has to be correlated with noise
contained in X(n). As discussed in section 3.3, the
ambient light signal features a high degree of corre-
lation with PPG during MA events. Consequently, a
simple and low computing-cost LMS adaptive filter
should be able to produce an error output E(n) with
reduced motion artefacts.
To verify this statement, a signal processing
chain which implements all the required steps has
been developed in MATLAB (The MathWorks, Mas-
sachusetts, US). The architecture is described on Fig.
12.
dataset
ppg + ambient
*.csv
pre-
processing
cwt-based analysis
bandpass filtering
adaptive
filtering
time and frequency
domain filters
post-
processing
Singular Spectrum
Analysis (SSA)
heart rate
estimation
Peak finding
ecg record
*.csv
Figure 12: Signal processing toolchain architecture.
Ambient light and PPG recordings extracted from
the wrist-worn device are directly imported in MAT-
LAB. As a pre-processing step, both PPG and am-
bient are band-pass filtered from 0.5 to 10 Hz using
4
th
order FIR in order to remove noise outside of the
cardiac band, thus ensuring that both reference and
PPG share the same spectral limits. In this same step
and for signal analysis in time-frequency domain, a
continuous wavelet transform (CWT) is used to anal-
yse the spectrogram. This CWT technique features a
higher resolution in both domain in comparison with
Short Time Fourier Transform (STFT). Next, during
the adaptive filtering step, a time-domain LMS fil-
ter is used for motion artefact reduction. Finally, fil-
tered signal is post-processed using Singular Spec-
trum Analysis (SSA) to remove residual discontinu-
ities. The filtered output spectral content is also anal-
ysed using CWT and compared with the previous
spectrogram obtained during pre-processing. Heart
rate estimation is performed in time domain method
by finding peaks on the SSA-denoised PPG signal.
For validation purpose, a simultaneous electrocardio-
gram (ECG) recording is used as the gold standard
method.
4.3.1 Periodic Motion
The first dataset used for evaluating the performance
of the adaptive the LMS filter is a 80 s recording com-
prised of periodic hand motion (opening and closing).
Apart from motion events, the PPG spectrogram on
BIODEVICES 2020 - 13th International Conference on Biomedical Electronics and Devices
28
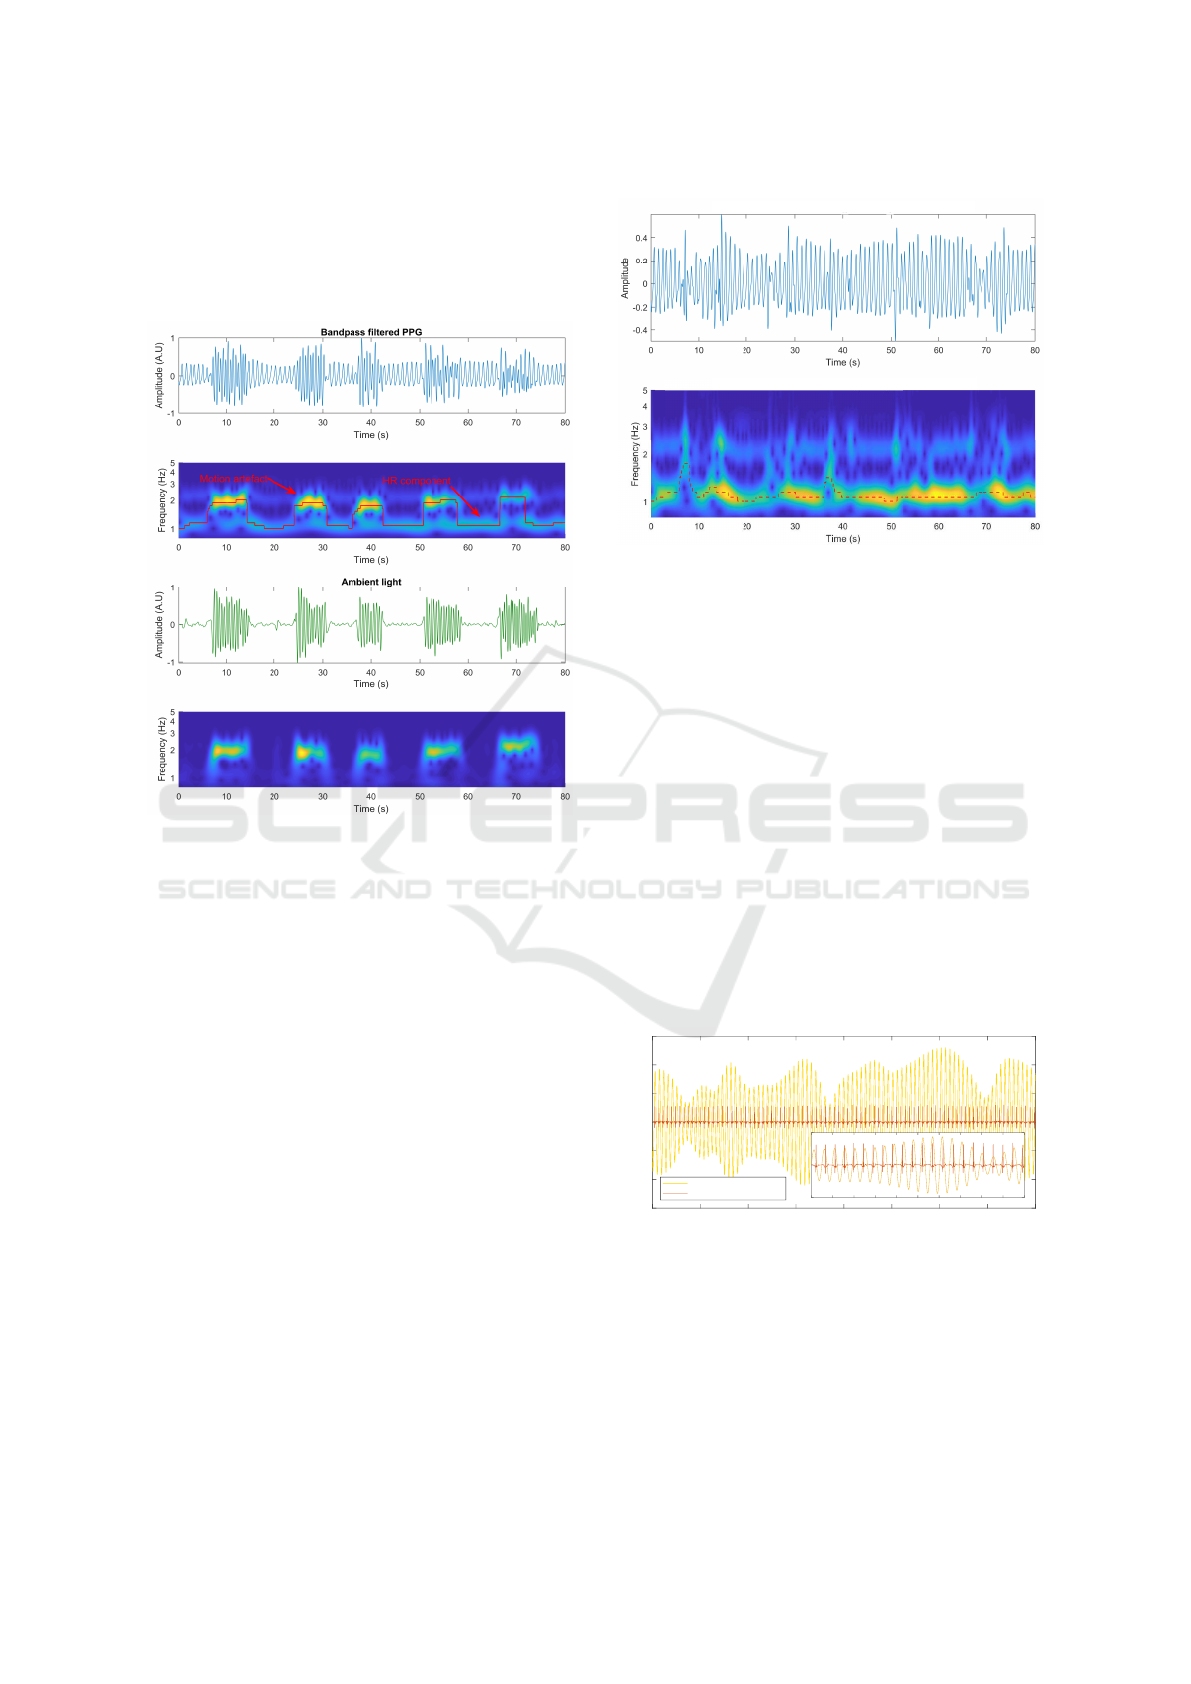
Fig. 13 features a clear cardiac component with a 2
nd
harmonic corresponding to the dicrotic notch. When
no motion is induced, the spectrogram maximum en-
ergy, plotted in red, follows the resting HR of user of
69.36 BPM.
Figure 13: Pre-processed PPG and ambient signals.
During motion artefacts (MA) events, the maxi-
mum spectrogram energy is located at the frequency
of the artefact (1.87 Hz). Although the cardiac com-
ponent is no longer dominant, it can however still be
detectable on the spectrogram. Performing heart rate
evaluation on this simple band-pass filtered PPG sig-
nal would lead to incorrect estimation. The spectro-
gram obtained by CWT confirms that ambient light
features a clear matching with PPG in frequency do-
main during motion artefacts.
The output obtained from the adaptive filter is
shown on Fig. 14. Despite its simplicity (in com-
parison with others structures such as X-LMS, RLS
or variable step-size LMS), this filter is able to reject
motion artefact. On this dataset, a filter comprised
of L = 32 taps is used. Step size parameter µ = 0.006
that controls convergence speed and stability is manu-
ally tuned for best trade-off between convergence and
filter response. Smaller values of µ tend to reduce
convergence speed while larger values lead to impor-
tant misadjustment.
The maximum spectrogram energy, plotted in
dashed lines on Fig. 14 is representative of PPG sig-
nal fundamental frequency. However, using this in-
formation directly for estimating heart rate could lead
Restored PPG using LMS adaptive filter
Restored PPG spectrogram
Figure 14: Restored PPG recording using LMS filter.
to incorrect estimations. In order to reduce discon-
tinuities and high frequency noise locally present on
the filtered PPG waveform, Singular Spectrum Anal-
ysis (SSA) is used. The aim of this method is to de-
compose the signal into principal components, each
of these extracted time series representing a trend of
the original signal : oscillatory mode, noise or peri-
odic pattern (Golyandina et al., 2001). The decom-
position is operated in MATLAB : a covariance ma-
trix is computed using Toeplitz approach, and once
eigenvalues and eigenvectors are extracted from the
covariance matrix, principal components (PC) are ob-
tained by performing matrix product between embed-
ded timeseries (windowed version of PPG signal) and
eigenvectors. The de-noised version of PPG is ob-
tained by re-summing the two first PCs only, and the
result of this operation is shown on Fig. 15 with a
simultaneous ECG recording plotted altogether.
0 10 20 30 40 50 60 70 80
Time (s)
-0.6
-0.4
-0.2
0
0.2
0.4
0.6
Amplitude (A.U)
Denoised PPG (PC1 + PC2)
Simultaneous ECG
20
40
Figure 15: De-noised PPG and simultaneous ECG record.
An instantaneous heart rate detection is performed
on this waveform using a peak-finding method (a
zero-crossing detection method could also be used for
this purpose), and the time difference between suc-
cessive peaks is then calculated. This method is par-
ticularly efficient on denoised PPG signal as its am-
plitude remains relatively constant with time. On the
Ambient Light Contribution as a Reference for Motion Artefacts Reduction in Photoplethysmography
29
contrary, operating this peak detection directly onto
the LMS adaptive filter output could have been more
complex as it should have use a time-varying thresh-
old for maintaining a correct detection.
0 10 20 30 40 50 60 70 80
Time (s)
-10
-5
0
5
10
Amplitude (AU)
PPGs peakfinding
LMS Output Peaks LMS SSA Output Peaks SSA
0 10 20 30 40 50 60 70 80
Time (s)
20
40
60
80
100
120
140
160
Heart Rate (BPM)
Instantaneous HR
LMS SSA BPF PPG
Figure 16: Instantaneous heart rate evaluation.
Instantaneous HR for bandpass filtered PPG, LMS
filter output and SSA denoised PPG are plotted on
Fig. 16. As expected, the denoised PPG shows a
slowly time-varying heart rate devoid of fast tran-
sients which are still present on the adaptive filter out-
put. However, as SSA acts as a smoother in case of
missing pulses on the LMS processed PPG, it could
potentially acts as a low-pass filter and thus compro-
mise the evaluation of instantaneous HR. In this sit-
uation, the calculation of parameters such as Heart
Rate Variability (HRV), which is a relevant indica-
tor for assessing cardiovascular system state, could be
erroneous. In order to evaluate the performances of
the proposed processing toolchain, the instantaneous
heart rate has also been extracted from a simultaneous
ECG (Fig. 17).
0 10 20 30 40 50 60 70 80
Time (s)
60
62
64
66
68
70
72
Heart Rate (BPM)
Reference ECG
Post-processed (SSA) PPG
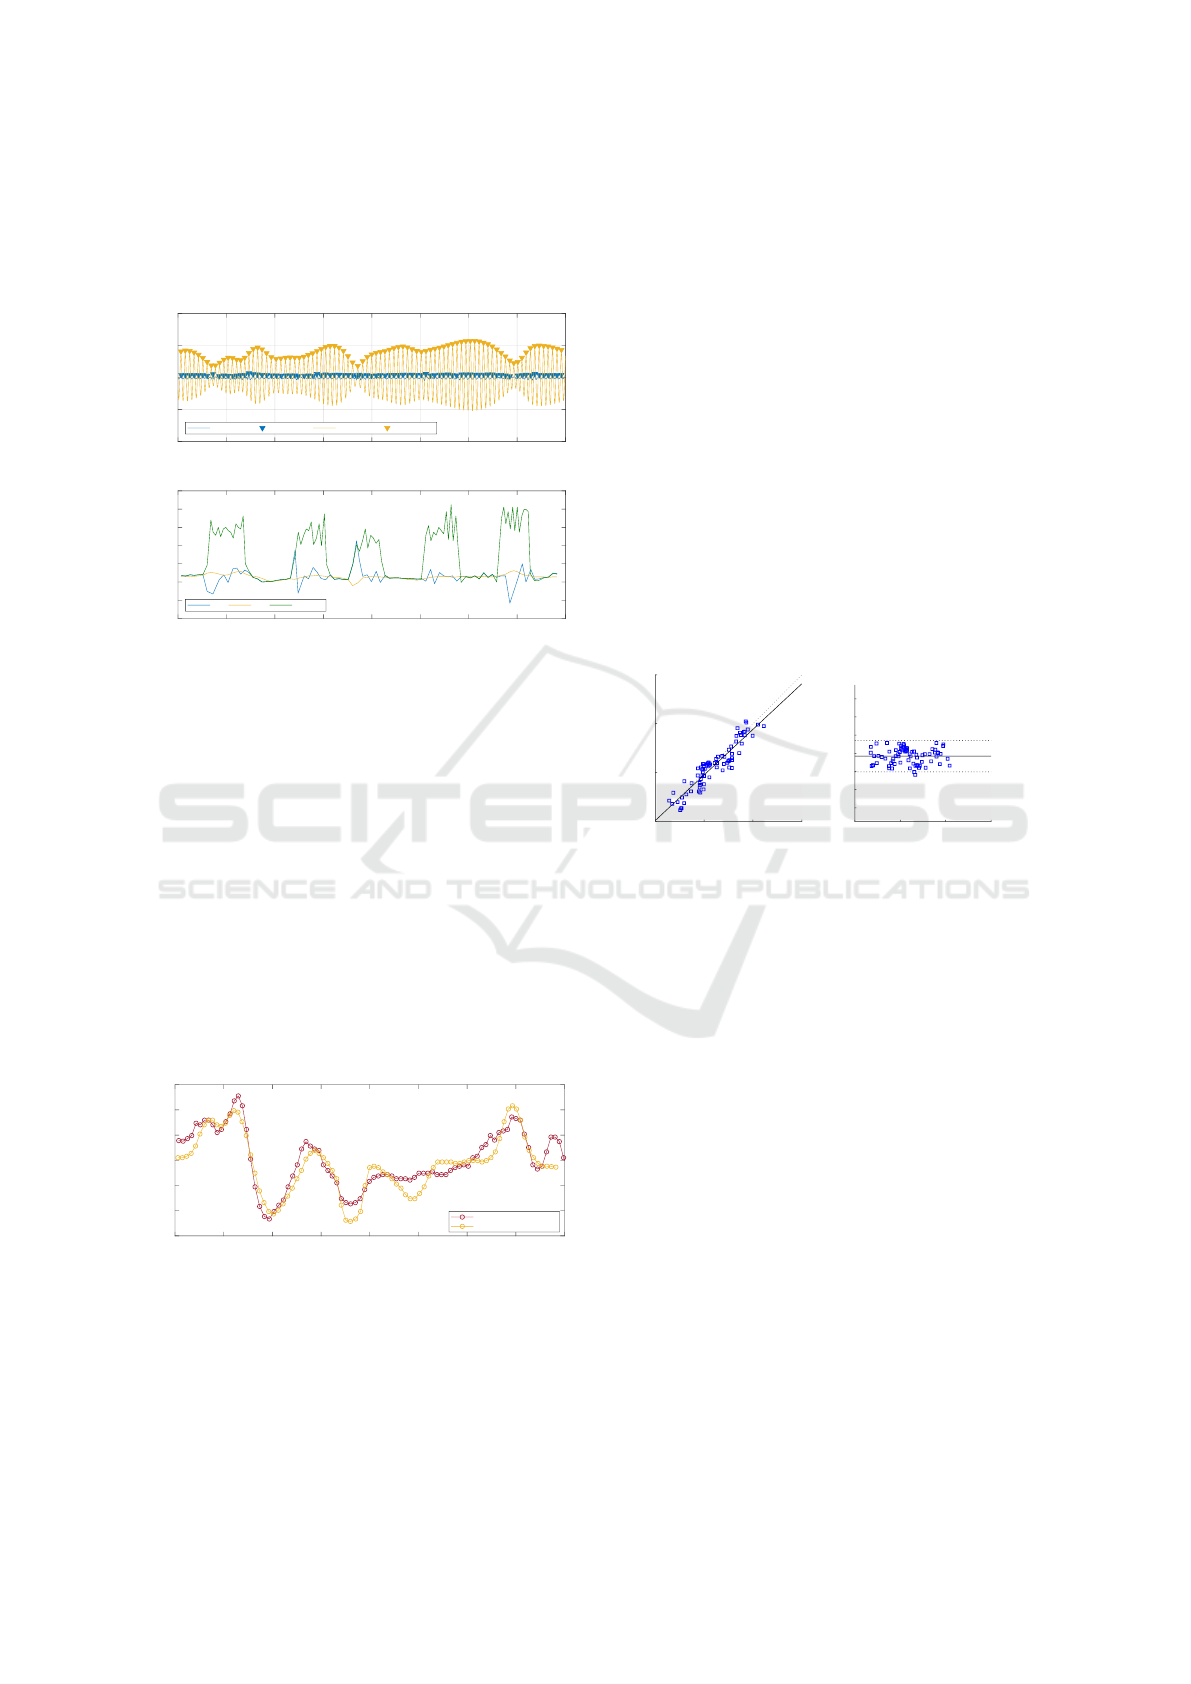
Figure 17: Comparison with simultaneous ECG recording.
Instantaneous ground truth heart rate was ex-
tracted from ECG using a simple peak detection to
detect the R-waves. Over this particular dataset, this
method didn’t shown any significant difference with
Pan and Tompkins detection method. Then, inter-
beats intervals from both processed PPG and ECG
were uniformly re-sampled. As discussed in prior art,
pulse rate variability (PRV) of PPG is representative
of HRV in resting conditions (Gil et al., 2010). How-
ever, in ambulatory conditions where motion occurs,
correlation between PPG PRV and ECG beat-to-beat
intervals is reduced and depends on measurement site
(Maeda et al., 2011). Consequently, ground truth HR
and estimated HR from processed PPG are compared
in an ’average level’, instead of pure beat-to-beat cy-
cle. Both tachograms were smoothed using a mov-
ing average filter over 4 points. Even during motion
events, heart rate follows the trend of ECG reference,
making ambient light and associated processing tech-
nique a suitable candidate for assessing HR and de-
rived indicators in an ambulatory use. The associated
Bland Altman diagram and scatter plot between gold
standard ECG and processed PPG shows good per-
formance and the limits of agreement are +1.4 / -2.0
BPM. On this particular dataset, Pearson’s coefficient
is R = 0.85.
60 65 70 75
ECG (BPM)
60
65
70
75
PPG (BPM)
y=0.93x+4.12
r
2
=0.85
SSE=59 BPM
n=78
60 65 70 75
Mean ECG & PPG (BPM)
-6
-4
-2
0
2
4
6
PPG - ECG (BPM)
1.4 (+1.96SD)
-0.31 [p=0.00]
-2.0 (-1.96SD)
RPC: 1.7 BPM (2.6%)
CV: 1.3%
Figure 18: Bland Altman diagram between ECG and PPG.
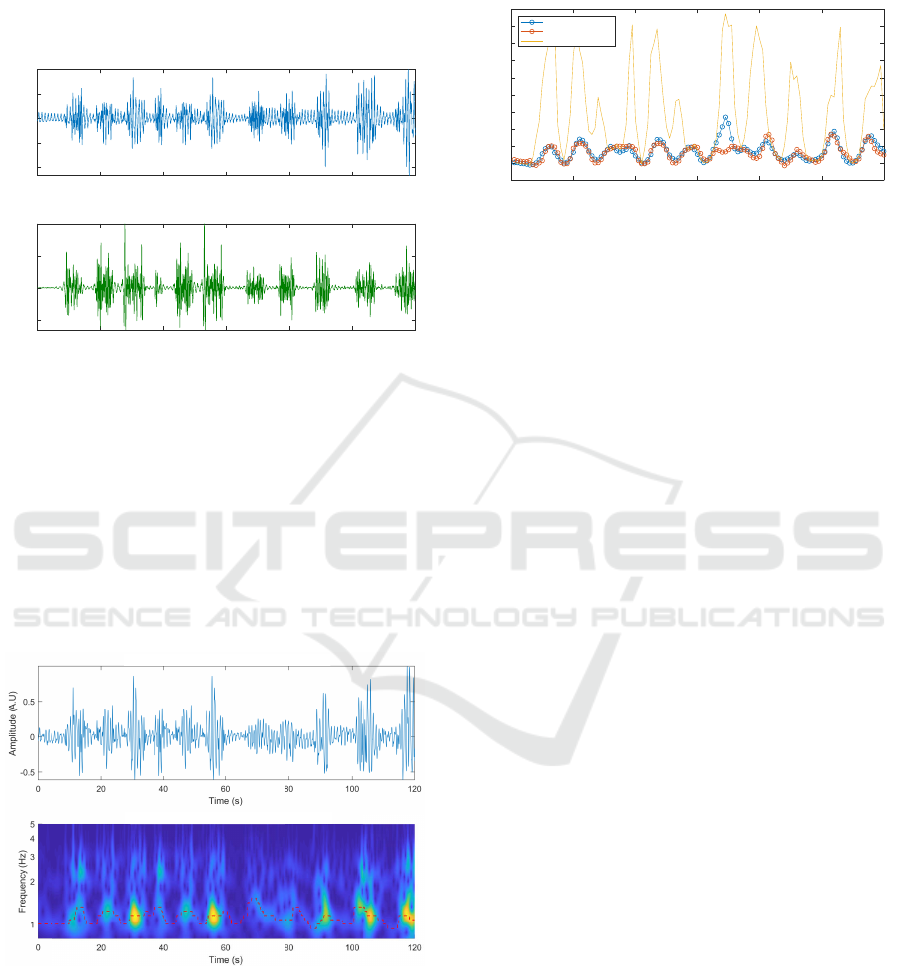
4.3.2 Random Motions
Rather than periodic movements, a more realistic situ-
ation of motion artefacts can be evaluated by inducing
micro-motions occuring in a random fashion during
keyboard typing. In this situation, even if the wrist is
standing quite still, typing will cause fingers tendons
to move, thus resulting in a modification of the optical
contact and superimposition of motion artefacts.
However, in this situation, the considered noise is
no longer a stationary process and cannot be modelled
by a Gaussian distribution law, which is a fundamen-
tal hypothesis for the use of adaptive filters (Belge
and Miller, 2000). To overcome this limitation, a
variant of Recursive Least Squares (RLS) algorithm,
known as generalised sliding windows RLS (Sayed,
2003), was applied. Other methods such as expo-
nentially weighted RLS (W-RLS) are also suitable for
this purpose. The main drawback of RLS adaptive al-
gorithms is their higher computational cost compared
with LMS which can affect autonomy of the system if
used in a wearable device. A sliding window RLS
adaptive filter was thus implemented in MATLAB,
BIODEVICES 2020 - 13th International Conference on Biomedical Electronics and Devices
30
in place of the previously used LMS filter. Except
from that, the signal processing toolchain remains un-
changed. The considered dataset is comprised of PPG
signal together with a simultaneous ECG recording
over 120 s while keyboard typing (see fig. 19).
0 20 40 60 80 100 120
Time (s)
-1
-0.5
0
0.5
1
Amplitude (A.U)
BPF PPG
0 20 40 60 80 100 120
Time (s)
-0.5
0
0.5
1
Amplitude (A.U)
BPF Ambient light
Figure 19: PPG and ambient light while typing.
The RMS adaptive filter used had a length of 4
weights and the sliding window size was 8 s. These
parameters were chosen empirically to obtain the best
possible results in terms of artefacts rejection. The
spectrogram was used for this purpose as a direct vi-
sual indicator. The output of the adaptive filter was
then smoothed using SSA as previously described,
and peak detection was used for evaluating heart rate.
The resulting signal in both time and frequency do-
main is shown on Fig. 20.
Restored PPG using RLS adaptive filter
Restored PPG spectrogram
Figure 20: Sliding window RLS adaptive filter output.
Following the SSA denoising process, the instan-
taneous heart rate is estimated from time domain us-
ing peak finding. As previously described in section
4.3.1, ground truth heart rate (ECG) and PPG are uni-
formly re-sampled. Then, a moving average filter
over 4 points is applied and the obtained HR is com-
pared to the simultaneous ECG (see Fig. 21). Over
this 120 s dataset, a Bland-Altman analysis shows a
limit of agreement of 6.1 / -7.5 BPM with a bias of
-0.7 BPM.
0 20 40 60 80 100 120
Time (s)
50
60
70
80
90
100
110
120
130
140
150
Heart Rate (BPM)
Reference ECG
Processed PPG
Bandpass filtered PPG
Figure 21: Heart rate during keyboard typing.
Time sections where motion artefacts are contam-
inating PPG can be localised using heart rate com-
puted from band-pass filtered PPG. This makes clear
illustration of continuous motion happening while
keyboard typing. Regarding this result, even if the
measured limit of agreement is higher, it must be kept
in mind that the considered motion artefacts are no
longer the consequence of a periodic activity, making
signal processing more complex.
5 CONCLUSIONS
In this paper, we suggested the use of ambient light
as a reference for the reduction of motion artefacts
in PPG signals measured on the wrist. The relevance
of this signal as a reference has been demonstrated
on various motions types. Micro-motions, that could
not be addressed previously using conventional ac-
celerometry, are efficiently reduced using the ambi-
ent light reference. The signal processing toolchain
has shown a promising ability to correct both periodic
and random motions when compared to a simultane-
ous heart rate directly derivated from the ECG. The
proposed method is especially suitable for implemen-
tation in an embedded device as it does not require
any additional hardware. Moreover, the ambient light
reference can be used with low computational cost
adaptive filters such as LMS.
Further investigation should be conducted on the
existing time delay between reference and PPG as it
could influence efficiency of motion artefacts rejec-
tion. Future work will be focused on the implementa-
tion of the proposed method in an autonomous wear-
able device with embedded signal processing capabil-
ity. Although the proposed method is especially effi-
cient for micro-motions, accelerometry remains use-
ful in case of strong physical activity. A decision
strategy for choosing optimal reference between am-
bient light and accelerometry will also be developed.
Ambient Light Contribution as a Reference for Motion Artefacts Reduction in Photoplethysmography
31

REFERENCES
Belge, M. and Miller, E. (2000). A sliding window RLS-
like adaptive algorithm for filtering alpha-stable noise.
IEEE Signal Processing Letters, 7(4):86–89.
Brown, G., Pocock, A., Zhao, M.-J., and Lujan, M. (2012).
Conditional Likelihood Maximisation: A Unifying
Framework for Information Theoretic Feature Selec-
tion. The Journal of Machine Learning Research, Vol-
ume 13, 3/1/2012:Pages 27–66.
Gibbs, P. and Asada, H. (2005). Reducing motion arti-
fact in wearable biosensors using mems accelerom-
eters for active noise cancellation. In Proceedings of
the 2005, American Control Conference, 2005., pages
1581–1586, Portland, OR, USA. IEEE.
Gil, E., Orini, M., Bailn, R., Vergara, J. M., Mainardi,
L., and Laguna, P. (2010). Photoplethysmography
pulse rate variability as a surrogate measurement of
heart rate variability during non-stationary conditions.
Physiological Measurement, 31(9):1271–1290.
Golyandina, N., Nekrutkin, V. V., and Zhigliavski, A. A.
(2001). Analysis of time series structure: SSA and re-
lated techniques. Number 90 in Monographs on statis-
tics and applied probability. Chapman & Hall/CRC,
Boca Raton, Fla.
Hu, S., Azorin-Peris, V., and Zheng, J. (2013). Opto-
Physiological Modeling Applied to Photoplethys-
mographic Cardiovascular Assessment. Journal of
Healthcare Engineering, 4(4):505–528.
Islam, M. T., Ahmed, S. T., Shahnaz, C., and Fattah, S. A.
(2019). SPECMAR: Fast Heart Rate Estimation from
PPG Signal using a Modified Spectral Subtraction
Scheme with Composite Motion Artifacts Reference
Generation. Medical & Biological Engineering &
Computing, 57(3):689–702. arXiv: 1810.06196.
Jan, H.-Y., Chen, M.-F., Fu, T.-C., Lin, W.-C., Tsai, C.-
L., and Lin, K.-P. (2019). Evaluation of Coherence
Between ECG and PPG Derived Parameters on Heart
Rate Variability and Respiration in Healthy Volunteers
With/Without Controlled Breathing. Journal of Medi-
cal and Biological Engineering.
Khan, E., Al Hossain, F., Uddin, S. Z., Alam, S. K., and
Hasan, M. K. (2016). A Robust Heart Rate Moni-
toring Scheme Using Photoplethysmographic Signals
Corrupted by Intense Motion Artifacts. IEEE Trans-
actions on Biomedical Engineering, 63(3):550–562.
Lee, B., Han, J., Baek, H. J., Shin, J. H., Park, K. S., and Yi,
W. J. (2010). Improved elimination of motion artifacts
from a photoplethysmographic signal using a Kalman
smoother with simultaneous accelerometry. Physio-
logical Measurement, 31(12):1585–1603.
Maeda, Y., Sekine, M., and Tamura, T. (2011). Relationship
Between Measurement Site and Motion Artifacts in
Wearable Reflected Photoplethysmography. Journal
of Medical Systems, 35(5):969–976.
Ram, M. R., Madhav, K. V., Krishna, E. H., Komalla, N. R.,
and Reddy, K. A. (2012). A Novel Approach for Mo-
tion Artifact Reduction in PPG Signals Based on AS-
LMS Adaptive Filter. IEEE Transactions on Instru-
mentation and Measurement, 61(5):1445–1457.
Sayed, A. H. (2003). Fundamentals of adaptive filtering.
IEEE Press Wiley-Interscience, New York. OCLC:
ocm52287219.
Tautan, A.-M., Young, A., Wentink, E., and Wieringa, F.
(2015). Characterization and reduction of motion ar-
tifacts in photoplethysmographic signals from a wrist-
worn device. In 2015 37th Annual International Con-
ference of the IEEE Engineering in Medicine and
Biology Society (EMBC), pages 6146–6149, Milan.
IEEE.
Vaseghi, S. V. (2001). Advanced digital signal process-
ing and noise reduction. Wiley, Chichester. OCLC:
937216619.
Zhang, Y., Song, S., Vullings, R., Biswas, D., Simes-
Capela, N., van Helleputte, N., van Hoof, C., and
Groenendaal, W. (2019). Motion Artifact Reduction
for Wrist-Worn Photoplethysmograph Sensors Based
on Different Wavelengths. Sensors, 19(3):673.
BIODEVICES 2020 - 13th International Conference on Biomedical Electronics and Devices
32
