Using Unsupervised Machine Learning for Plasma Etching Endpoint
Detection
Imen Chakroun
1
, Thomas J. Ashby
1
, Sayantan Das
2
, Sandip Halder
2
, Roel Wuyts
1
and Wilfried Verachtert
1
1
Exascience Life Lab, IMEC, Leuven, Belgium
2
Advanced patterning, IMEC, Leuven, Belgium
Keywords:
Plasma Etch, Endpoint Detection, Principal Component Analysis, Clustering Algorithms.
Abstract:
Much has been discussed around the advent of Industry 4.0 tools to improve yield across front-end and back-
end semiconductor manufacturers. One of these tools is the etch endpoint detection (EPD) systems. It is
essential to optimize the etch process by precisely landing on the underlying layers, because over-etching can
cause underlying layer damage. In this work, we explore unsupervised machine learning for automatically
identifying the endpoint during plasma etching of low open-area wafers using optical emission spectroscopy.
1 INTRODUCTION
Traditionally, the main driving force for the semicon-
ductor industry is the continuous shrinking of device
feature sizes, thereby incorporating more devices per
unit area, reducing manufacturing cost and enhanc-
ing performance. However, the shrinking of feature
size leads to a decrease in the process window im-
posing extremely tight requirement not only for the
critical dimension (CD), but also for the edge and
width roughness of spaces and trenches, of contacts
and lines and 0f tip to tip (T2T) values. At sub-10nm
technology nodes these parameters have significant
influence on the overall device performance. It has
been seen that CD and edge and width roughness and
T2T values are highly influenced by the plasma etch-
ing process. After the lithography process, the target
material to etch from the wafer surface reacts selec-
tively with the plasma without affecting the underly-
ing layers. Excess over etching can cause underlying
layer damage, CD variations and influence the rough-
ness if lines/trenches, resulting in yield loss. Thus, it
is essential to optimize the etch process by precisely
landing on the underlying layers. EndPoint Detection
(EPD) is a technique that can help here.
During the plasma etch process specific gases
are pumped into a chamber where they are turned
into plasma by means of microwaves. The resulting
plasma interacts with the exposed surface of the wafer
in a highly controlled fashion. As said, it is critical to
avoid excessive over-etching because it can damage
the underlying layers causing device failures and sub-
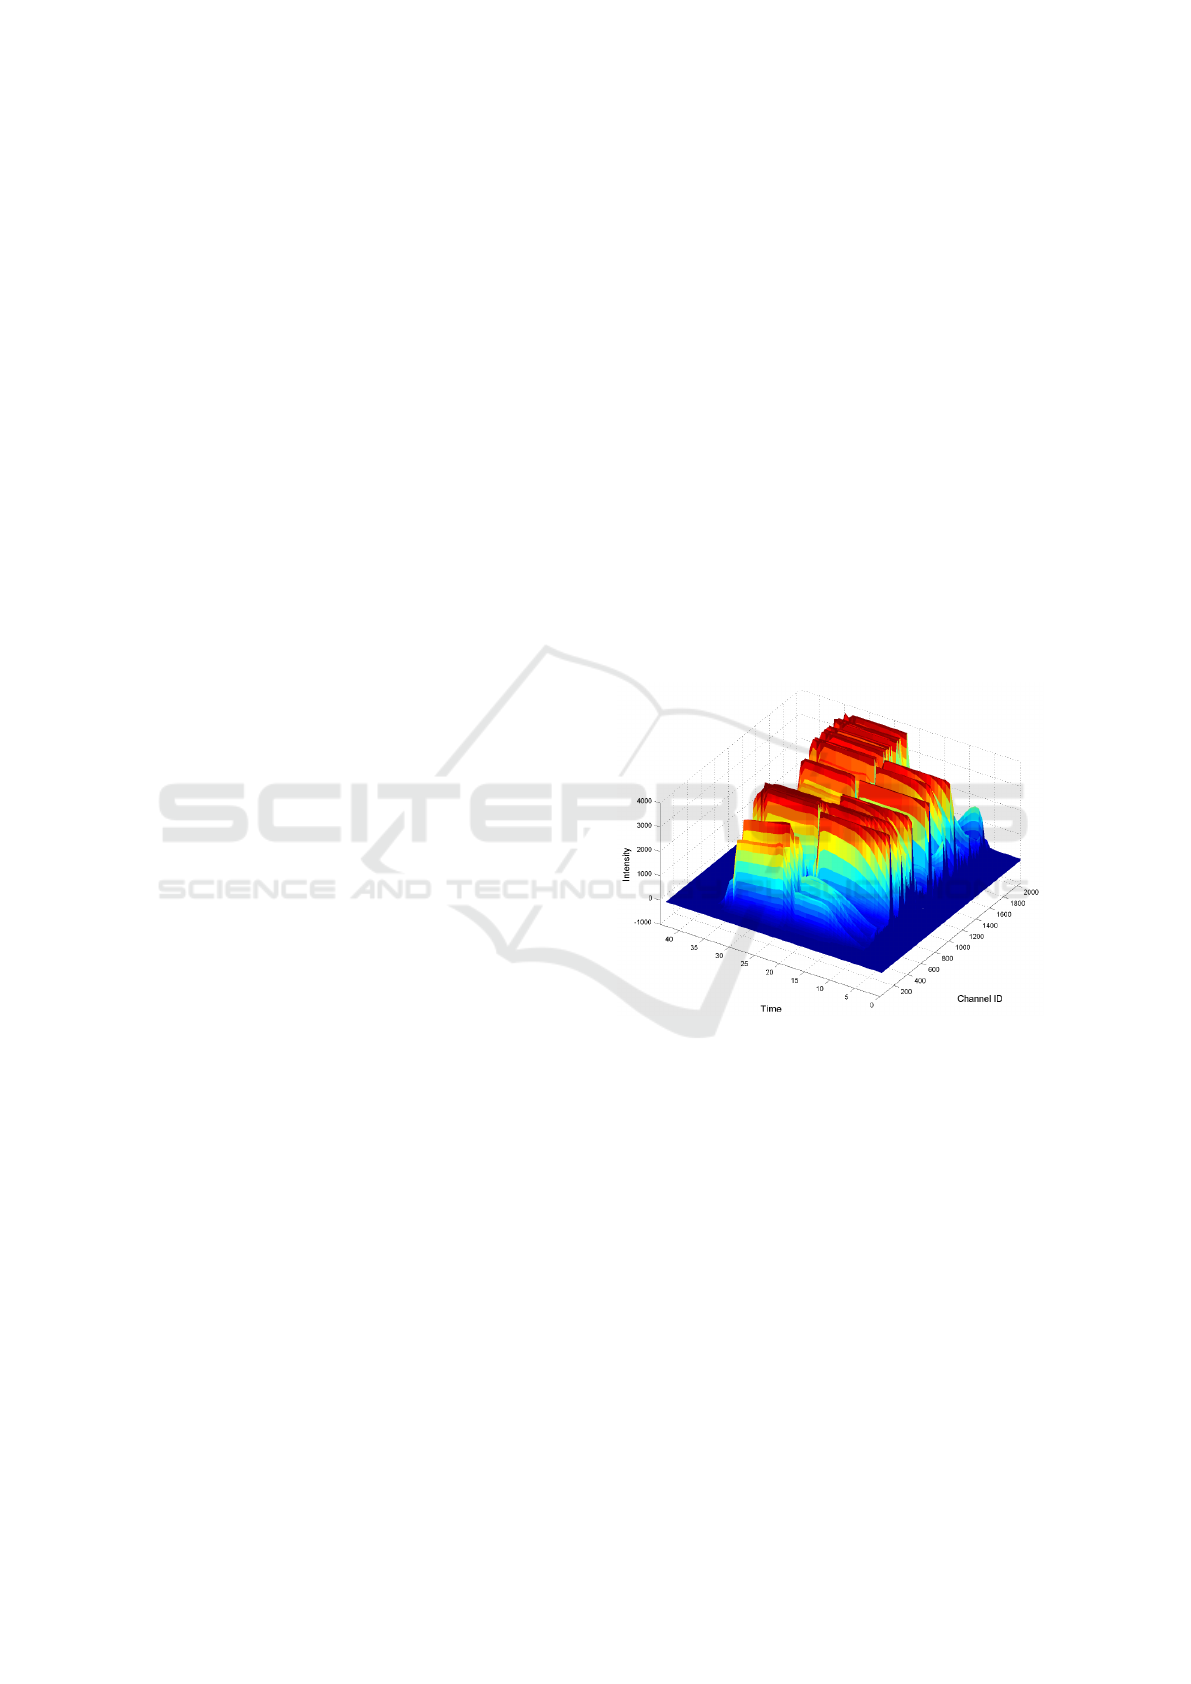
Figure 1: Mutliwavelength Optical Emission Spectra during
main etch of oxide experiments.
sequent yield reduction. As a mean to control the pro-
cess, etch endpoint detection (EPD) has received great
attention (H. Noh and Han., 2015) (H. Henry Yue and
Toprac., ). The most widely used method for endpoint
detection is to monitor the optical emission trace of
reactive gases in the plasma using optical emission
spectroscopy (OES) (Chen, 1996) (Puggini, 2015).
OES is popular because OES measurements can be
collected non-intrusively during wafer processing and
because they provide real-time plasma chemical in-
formation, making them more reliable. The measure-
ments correspond to the variation of the optical emis-
sion intensity of the plasma as a function of the re-
actants and by-products inside the etch chamber. Us-
ing this method, the endpoint is identified by monitor-
ing the intensity of an emission peak corresponding
Chakroun, I., Ashby, T., Das, S., Halder, S., Wuyts, R. and Verachtert, W.
Using Unsupervised Machine Learning for Plasma Etching Endpoint Detection.
DOI: 10.5220/0008877502730279
In Proceedings of the 9th International Conference on Pattern Recognition Applications and Methods (ICPRAM 2020), pages 273-279
ISBN: 978-989-758-397-1; ISSN: 2184-4313
Copyright
c
2022 by SCITEPRESS – Science and Technology Publications, Lda. All rights reserved
273
to a particular reactant or product that show a pro-
nounced variation at a certain time. However, using
few manually selected wavelengths as an endpoint de-
tection technique is only appropriate for high open
areas. For low open area etches, tracking individual
wavelengths often yields to an insufficient signal-to
noise ratio (SNR). In small sample areas, changes in
the optical signal are very small making it difficult to
detect the etching endpoint. Moreover, if the view-
port for optical-emission monitoring becomes blurred
due to prolonged use of the etching system, optical-
emission monitoring becomes impossible and regular
maintenance of these observation windows is required
(H. Jang and Chae., 2017). Other classical methods
simply time the etch. In this case the resulting EPD
is only valid for a very short number of runs before
process drift and noise render the results ineffective.
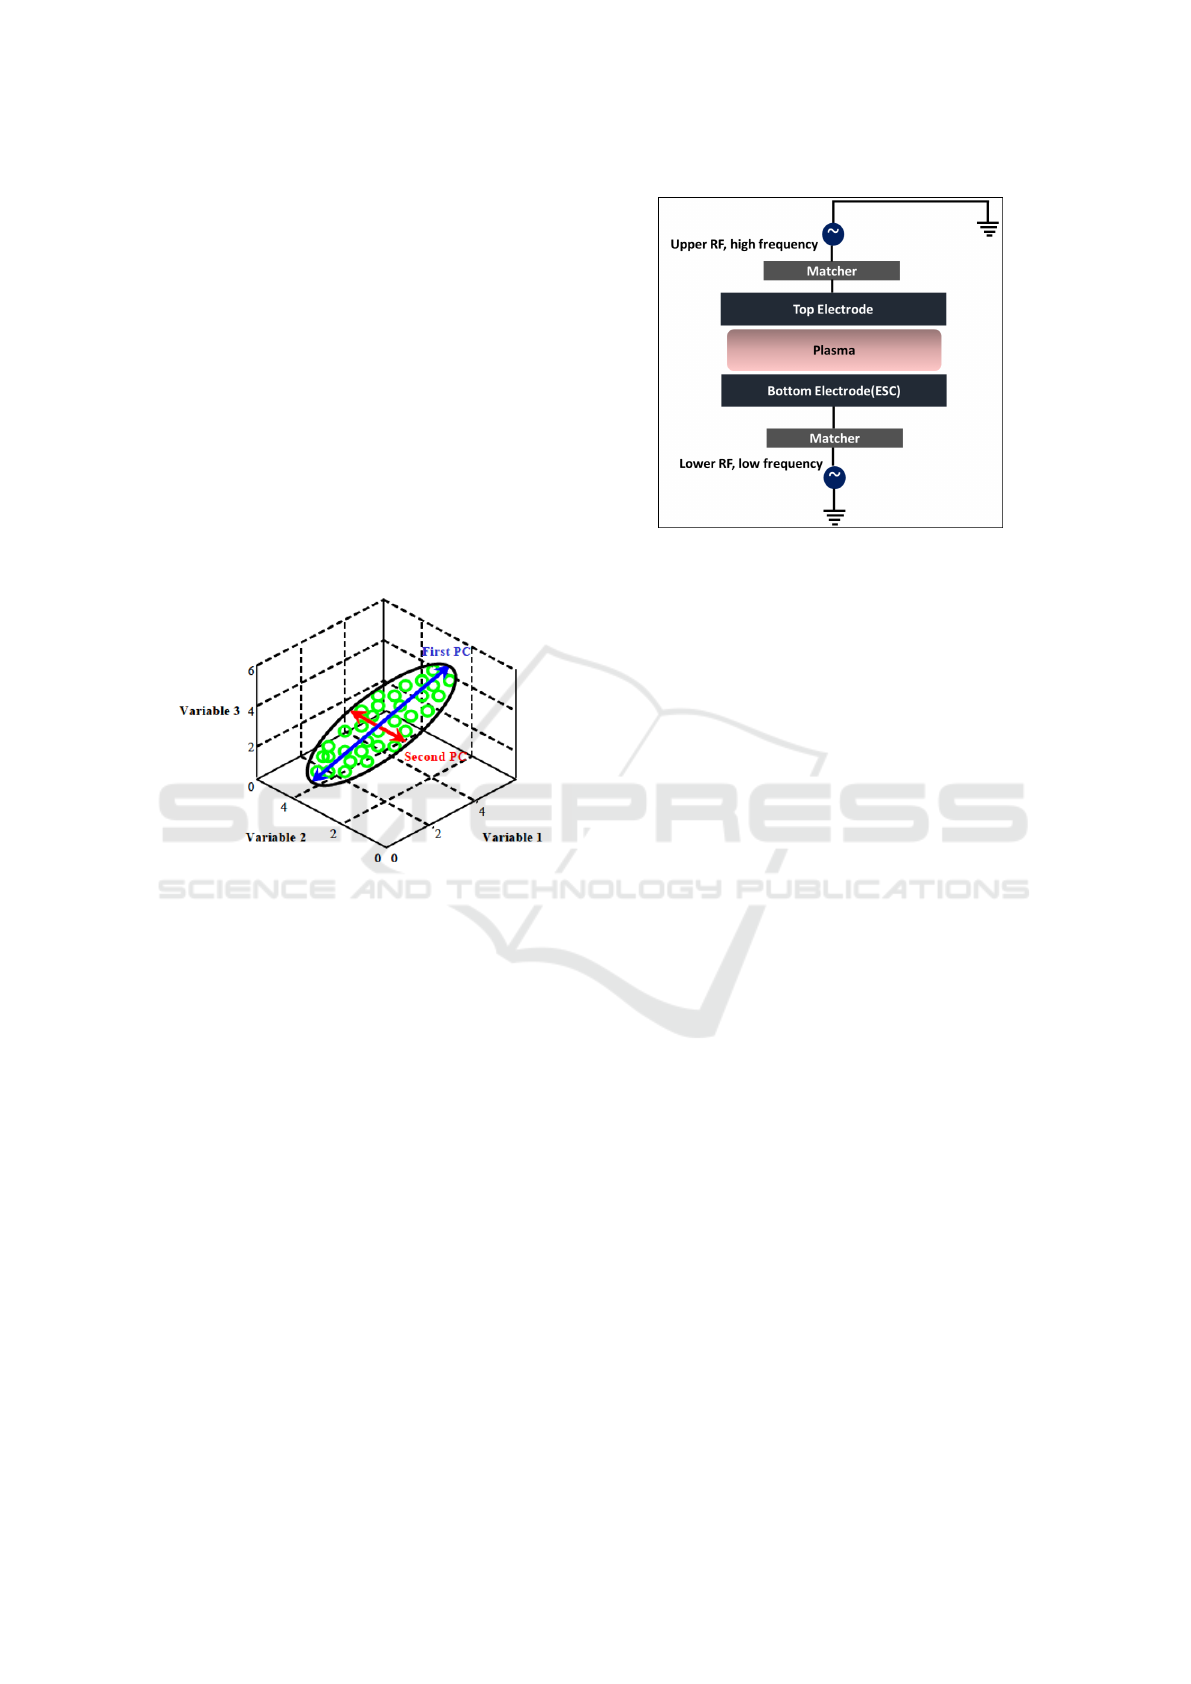
Figure 2: Principal component model of three dimensional
data set lying primarily in a single plane. (Barry M. Wise,
et al., 1996).
In this work, high-resolution multi-wavelength
OES data is used to provide the necessary sensitiv-
ity for detecting subtle endpoint signals. Detecting
etch endpoint from multi-wavelength OES data us-
ing existing simple methods is challenging. This is
because these simple methods usually rely on find-
ing a representative wavelength for each gas and each
material used. Moreover, multi-wavelength OES data
is high-dimensional and large, since it encapsulates
measurements as a function of wavelength, time and
intensity. Figure 1 plots a sample of 1200 spectral
channels from 200 to 2000nm.
To overcome these challenges, data analysis tech-
niques have been applied for etching processes (Pug-
gini, 2015) (Goodlin, 2002). In this work, we com-
bine feature extraction with unsupervised machine
learning to extract key components that capture the
endpoint signal. We first apply Principal Compo-
nent Analysis (PCA) to the raw data. PCA uses an
orthogonal transformation to convert a set of corre-
lated variables into a new set of linearly uncorrelated
variables called principal components. It’s often used
Figure 3: Schematic of a plasma etch chamber.
as a data compression algorithm or feature extraction
technique. Therefore, we believe that PCA is suit-
able for extract small partial signal changes of mul-
tivariate signals as demonstrated in (H. L. Maynard
and Ibbotson, 1996; S. Hong and Park, 2003). After-
wards, unsupervised clustering techniques such as the
balanced iterative reducing and clustering using hier-
archies algorithm (BIRCH) (Tian Zhang and Livny.,
1997) are applied. The remainder of the paper is
organized as follows: in Section 2 an overview of
existing research work using machine learning tech-
niques for EPD is given. In Section 3, our approach
for EPD using unsupervised machine learning tech-
nique is presented. Experimental settings and results
are described in Section 4. In Section 5, we provide a
summary of the work and possible future research.
2 RELATED WORK
PCA has been suggested as a method for analyz-
ing optical emission spectra due to its ability to dra-
matically reduce the dimensionality of large amounts
of OES data. For example, Rangan et al (S. Ran-
gan and Poolla, 1997) used PCA-reduced OES data
to form a linear dynamical model capable of detect-
ing endpoints and transition times in plasma etch.
(A. d’Aspremont and Lanckriet, 2007) used sparse
PCA for selecting key wavelengths from OES data.
In (Goodlin, 2002), the authors reviewed statistical
methods for OES in endpoint detection and suggested
a novel method for weighting OES according to SNR.
In (Han et al., 2008), the PCA algorithm was modified
to determine the loading vector from the model wafer,
and the score vector from the real-time data of the tar-
get wafer to reduce the processing time.
Due to their ability to synthesize nonlinear re-
ICPRAM 2020 - 9th International Conference on Pattern Recognition Applications and Methods
274

lationships from process data, artificial neural net-
works found application in the prediction of etch end-
point detection (H. L. Maynard and Ibbotson, 1996).
(S. Hong and Park, 2003) compared the use of PCA
and ANNs for feature extraction from OES data and
proposed a further ANN model for the reduced data.
Similarly, (Kim and Kim., 2004) compared ANN
and PCA but reported a significant performance im-
provement with partial OES models compared to con-
ventional PCA-reduction. Other supervised machine
learning techniques such as support vector machines
(SVM) have been used in (K. Han and Chae., ) for
endpoint detection based on OES measurement. In
(H. Jang and Chae., 2017), analyzing the optical emis-
sion spectra with a K-means clustering algorithm is
proposed on raw data.
In the next section we will explain how our pro-
posed technique improves on the related work pre-
sented here.
3 ENDPOINT DETECTION
USING PCA AND CLUSTERING
In this section we document the two main steps of our
method, namely i) PCA for dimensionality reduction
and variable selection, and ii) BIRCH clustering.
3.1 Dimensionality Reduction and
Variable Selection
OES data are difficult to deal with since the number
of variables (wavelengths) is usually larger than the
number of measurements. In such cases, each vari-
able can be obtained as a linear combination of the
others making uncovering the true relationship be-
tween the different variables difficult. Principal com-
ponent analysis (PCA) is a good candidate technique
for dealing with such data being an established statis-
tical method for multivariate data compression and in-
formation extraction. Its basic idea is to extract com-
binations of variables or factors (commonly expressed
in percentage of explained variance) capable of recon-
structing the majority of the information of the orig-
inal high dimensional data. The concept of principal
components is shown graphically in Figure 2 showing
a three dimensional data set where the data lie primar-
ily in a plane. The dimension reduction is achieved by
identifying the principal directions, called principal
components, in which the data varies. PCA assumes
that the directions with the largest variances are the
most ”important”. In this example, the first PC aligns
with the greatest variation in the data. The second PC
axis is the second most important direction and it is
orthogonal to the first PC axis.
3.2 Clustering Techniques for Endpoint
Detection
Etch endpoint detection is an unsupervised problem
since no real ground truth can be used to control the
data analysis technique. In production, EPD is based
on best practices and domain expertise. Recall also
that the basic idea of EPD is to find a change point or
variation in the OES spectra that may alert about etch
rate limit. This means we are looking for two disjoint
group of points in the spectral curve that are sepa-
rated by a change in the signal that define the before-
endpoint and after-endpoint status. Hence, the idea
of using unsupervised machine learning algorithms
such as clustering which is the process of gathering
objects in groups called clusters without prior knowl-
edge only based on their similarity between each
other and difference with objects from other groups.
(H. Jang and Chae., 2017) also used clustering tech-
niques for enhancing sensitivity of dielectric plasma
etching EPD. In their case, K-means was applied on
raw normalized data. In this work, hierarchical clus-
tering is used via the balanced iterative reducing and
clustering using hierarchies (BIRCH) algorithm with
PCA as a dimensionality reduction technique. Using
K-means cluster in real-time application is tricky be-
cause the load applied to the processor increases with
continuous data collection and normalization of the
optical signals. Moreover, K-means is very sensitive
to noise and outliers since a small number of such data
can substantially influence the centroids. BIRCH is
an online-learning clustering algorithm, it’s an incre-
mental method that does not require the whole data
set in advance. It is also local where each cluster-
ing decision is made without scanning all data points
and currently existing clusters. It does not inspect all
data points or all currently existing clusters equally
for each ’clustering decision’ and performs heuristic
weighting based on the distance between these data
points (Tian Zhang and Livny., 1997).
As aforementioned, the aim here is to construct
two disjoint group of points representing the before
and after etch endpoint. To construct such clusters,
the OES data is split in batches that are normalized.
PCA is applied and the output is fed to the birch algo-
rithm. The resulting clusters are then evaluated using
the silhouette score. The silhouette score (Rousseeuw,
1987) refers to a method of interpretation and valida-
tion of consistency within clusters of data, it measures
the cohesion of the cluster (how similar an object is to
its own cluster) and the separation compared to other
Using Unsupervised Machine Learning for Plasma Etching Endpoint Detection
275
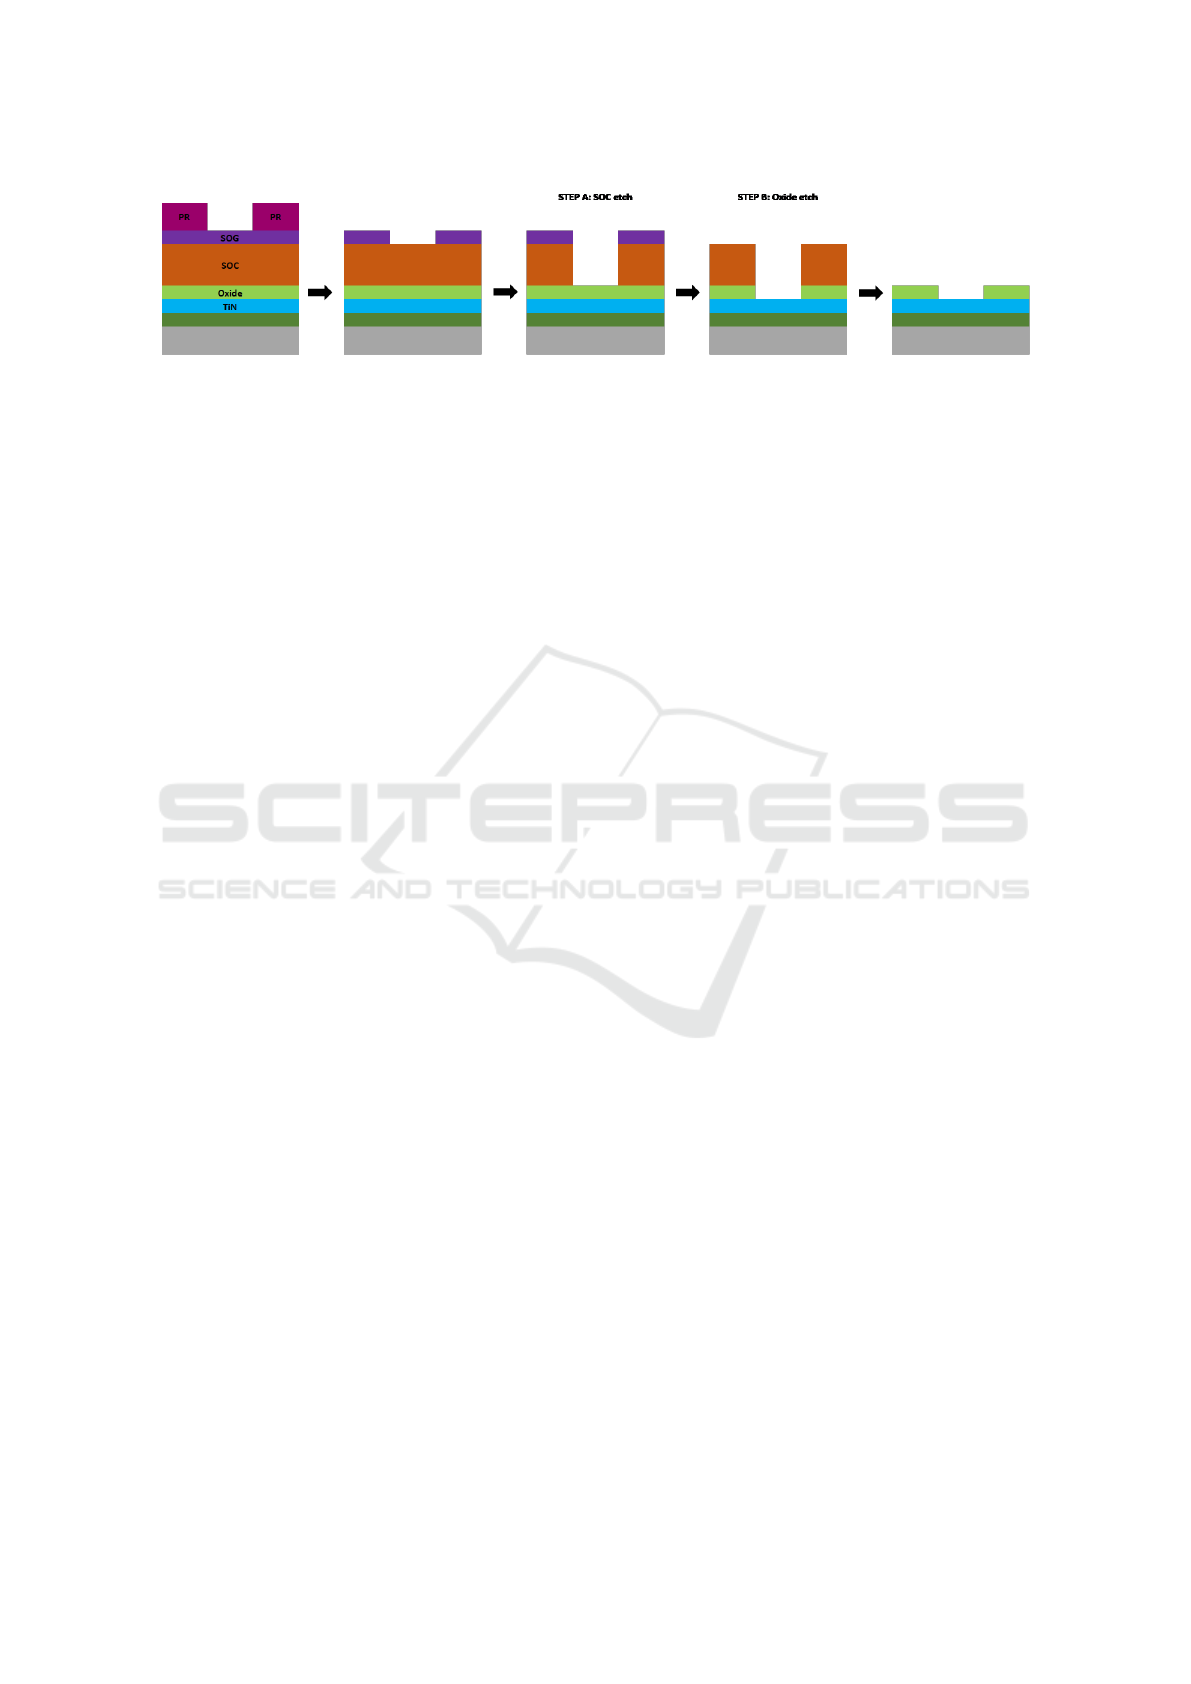
Figure 4: Simplified process flow for the etch process.
clusters. The silhouette ranges from -1 to 1 where co-
efficient values near 1 indicate that the sample is far
away from the neighboring clusters, values of 0 indi-
cate that the sample is on or very close to the decision
boundary between two neighboring clusters and neg-
ative values indicate that those samples might have
been assigned to the wrong cluster.
4 EXPERIMENTS
4.1 Experimental Settings
Etch Process: In Reactive-Ion Etching (REI), a
high frequency electromagnetic field (HF) is applied
to the upper electrode and low frequency field (LF) to
the bottom electrode. The schematic of a plasma etch
chamber is shown in Figure 3. During the plasma etch
process the wafer is positioned on the bottom elec-
trode and is held firmly in place by electrostatic chuck
(ESC). The LF power applied to the bottom electrode
determines the ion energy directing positive ions in
the plasma onto the wafer and is responsible for phys-
ical etching. On the other hand, the HF applied to
the top electrode influences the plasma density and is
responsible for generating radicals for chemical etch-
ing.
In a production process, wafers are grouped in
lots and processed sequentially undergoing several
etching steps. Lots are also processed sequentially
through etch chambers, interspersed with cleaning
and maintenance operations. Cleaning cycles are
typically done between each lot to remove the by-
products of plasma etching that build up on the cham-
ber walls, and are detrimental to etching performance.
Creation and Collection of Data: In major spec-
trometers, several channels are used each one record-
ing a single wavelength. Wavelength intensity mea-
surements are taken without interruption with a fixed
sampling rate during processing of wafers. The re-
sulting dataset is for every etching step a chronologi-
cally ordered values for a set of wafers. In this work,
21 wafers have been used. The wavelength intensities
were measured during 500 to 1100 seconds at a sam-
pling rate of 1 second using 1200 channels. For easy
reading, the presented results are for one wafer.
A simplified process flow for the etch process is
illustrated in Figure 4. In this study our focus will be
on two steps in this process. For the remaining of the
paper, we call Step A for the SOC etch step and Step
B for the Oxide etch step.
4.2 Experimental Results
In Figures 5a and 6a, we plot the time series behav-
ior of a sample OES spectrum for the wafer under in-
vestigation and the two etching steps A and B. It’s
clear from the figure that due to the big range of wave-
lengths, manually checking the variations in the sig-
nals is difficult or impossible. Thinking of selecting
some dominant wavelengths based on domain knowl-
edge is also misleading and incomplete. As an exam-
ple, in Figures 5b and 6b four dominant spectral chan-
nels for the two aforementioned steps are plotted. For
step B, in Figure 6b, the raw signal is almost uniform
for three of the selected wavelengths and smoothly
decreases over time for the 387nm wavelength. No
distinct change point can be detected manually. How-
ever, in Figure 5b, one first big slope can be noticed
around 30 seconds and a second smoother change can
be seen between 70 and 90 seconds.
We applied first PCA to this dataset formatted as
an T × W matrix, where T is the number of exper-
imental runs and W is the number of measurements
collected for each wavelengths. For every etching
step a different matrix is considered. The results ob-
tained by applying PCA to the complete OES spec-
trum presented in Figures 5a and 6a are plotted in
Figures 7a and 7b respectively. In both plotted PCA
first components, we can clearly identify two big vari-
ations in the signal: for Step A, in Figure 7a, in
the interval [20 seconds,40 seconds]. For Step B,
in Figure 7b, a big variations is observed between
50 and 65 seconds and a slighter one in the interval
[25 seconds,35 seconds]. Compared to the original
multi-wavelength signal, the new representation sim-
plifies and condenses the data while keeping the same
amount of information. Indeed, we report in Table
ICPRAM 2020 - 9th International Conference on Pattern Recognition Applications and Methods
276
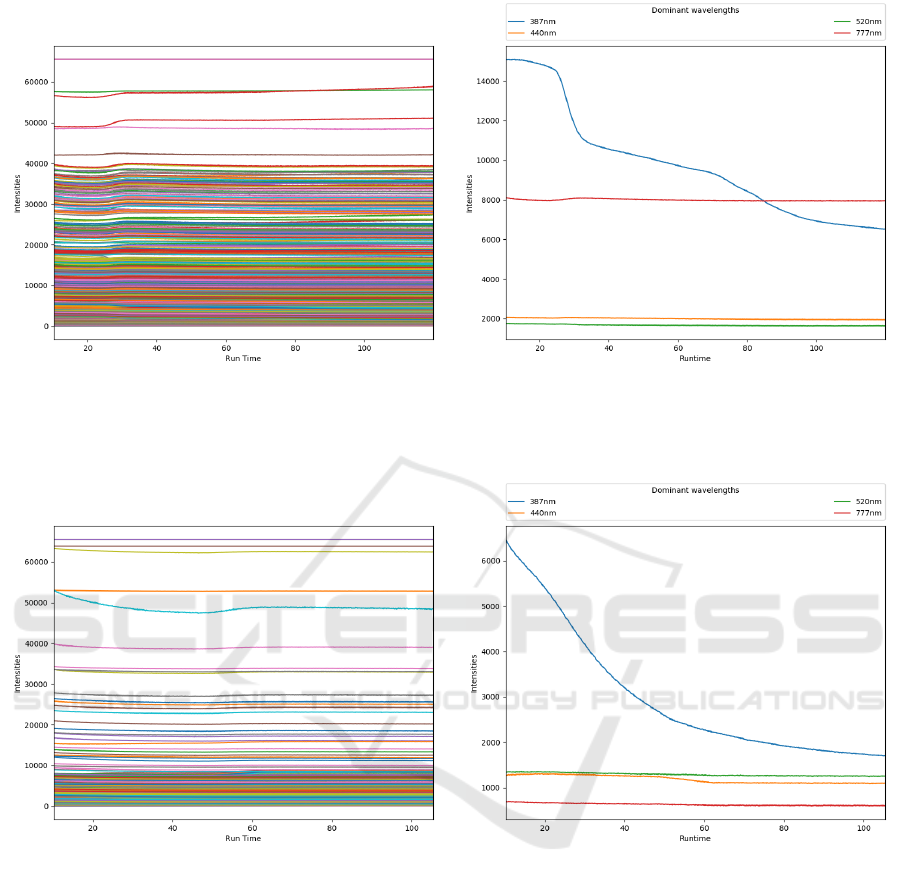
(a) Optical Emission Spectra during oxide etching
experiments.
(b) Time series behavior of the selected dominant spectral
channels.
Figure 5: Step A.
(a) Optical Emission Spectra during oxide etching
experiments.
(b) Time series behavior of the selected dominant spectral
channels.
Figure 6: Step B.
1 some of the explained variance randomly selected
from the experimented wafers. On average, the per-
centage of variance explained by the first component
is 0.913 for step A and 0.936 for step B.
In Figures 8a and 8b, we plot the silhouette score
computed on the output of the clustering algorithm for
step A and B respectively. As already explained, the
silhouette score reflects the cohesion inside the clus-
ter and the separation with other clusters. For Step A,
in Figure 8a, the silhouette reaches a maximum value
of 0.79 around 45 seconds and strongly decreases few
seconds later around 57 seconds. For the rest of the
runtime the values are roughly constant around 0.62.
The peak value of the silhouette score at 45 seconds
indicates that the data can be separated at that time
and this separation can be defined as the etching end-
point. In Figure 8b, the silhouette score is plotted for
step B. A first flat interval is observed around 45 sec-
onds, a maximum value is reached afterwards around
70 seconds. The values are constants around 0.6 for
the rest of the experiment. We suspect the endpoint
here to happen around the 70 seconds which corre-
sponds to the maximum value of the silhouette score.
Using Unsupervised Machine Learning for Plasma Etching Endpoint Detection
277
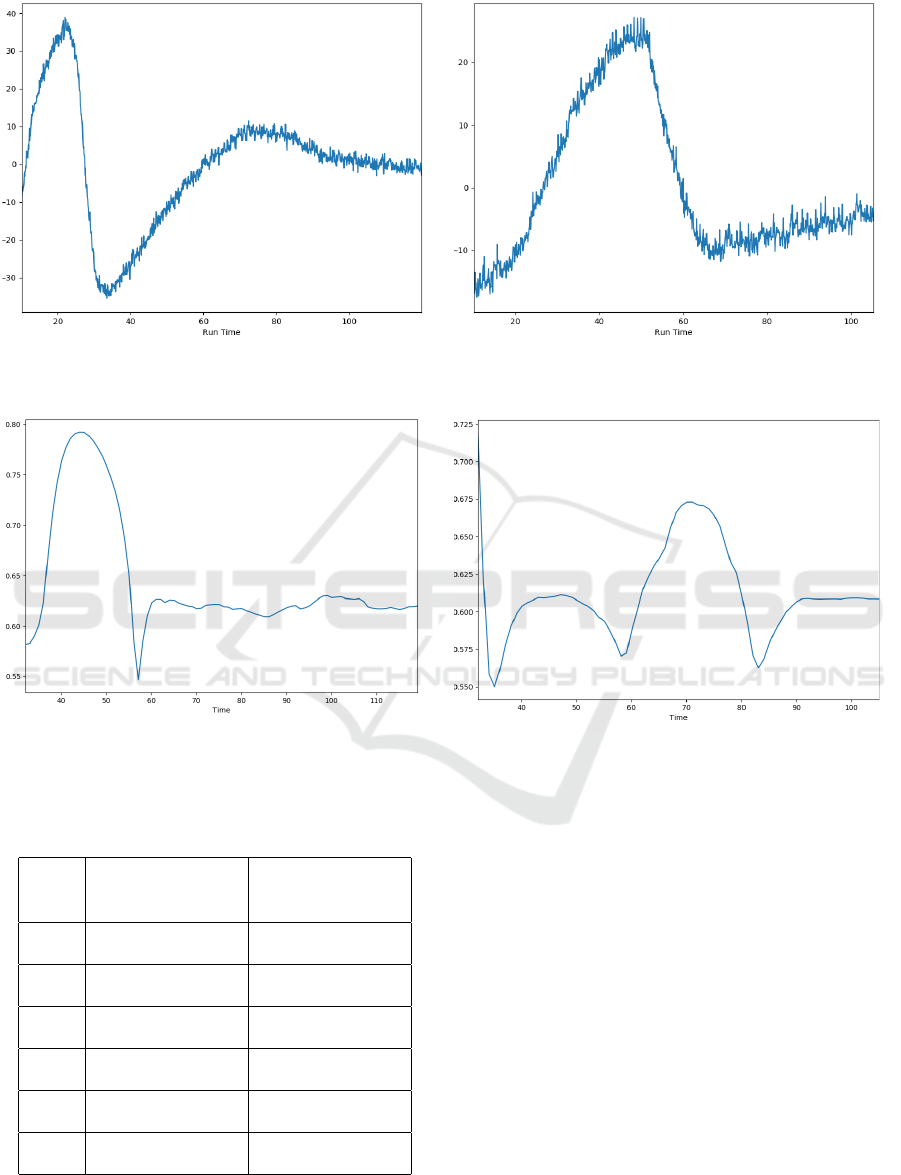
(a) Step A (b) Step B
Figure 7: Plotting PCA first component.
(a) Step A (b) Step B
Figure 8: Silhouette score computed for the birch algorithm.
Table 1: Explained variances after PCA for randomly se-
lected wafers.
Wafer Explained variance
Step A
Explained variance
Step B
1 0.943 0.903
2 0.914 0.927
3 0.905 0.941
4 0.904 0.945
5 0.9027 0.950
6 0.908 0.950
5 CONCLUSION
In this work, we applied unsupervised machine learn-
ing techniques for identifying etch endpoint detection
using high-resolution multi-wavelength OES data.
PCA is first applied on the raw data to extract mean-
ingful variables. Afterwards, the birch clustering is
used to separate the data divided into batches in two
clusters corresponding to the before-EPD and after-
EPD. Satisfactory decision about etch endpoint were
possible based on clearer variations in the silhouette
score which was used as a metric for cluster separa-
tion. As further improvement of this work, we should
be looking into methods that can produce the correct
response even when the input data is corrupted by
noise.
ICPRAM 2020 - 9th International Conference on Pattern Recognition Applications and Methods
278

ACKNOWLEDGEMENT
This project has received funding from the Electronic
Component Systems for European Leadership Joint
Undertaking under grant agreement No 826589. This
Joint Undertaking receives support from the European
Unions Horizon 2020 research and innovation pro-
gram and Netherlands, France, Italy, Belgium, Ger-
many, Austria, Hungary and Israel.
REFERENCES
A. d’Aspremont, L. E. Ghaoui, M. J. and Lanckriet, G.
R. G. (2007). A direct formulation for sparse pca us-
ing semidefinite programming. In SIAM Rev., volume
49 no 3, page 434–448.
Chen, R., H. H. S. C. G. M. (1996). Plasma etch model-
ing using optical emission spectroscopy. Journal of
Vacuum Science & Technology, 14:1901–1906.
Goodlin, B. E. (April 2002). Multivariate endpoint detec-
tion of plasma etching processes. PhD thesis, Univ. of
Texas, Austin.
H. Henry Yue, S. Joe Qin, J. W. and Toprac., A. Plasma
etching endpoint detection using multiple wave-
lengths for small open-area wafers.
H. Jang, H. Lee, H. L. C. K. and Chae., H. (February 2017).
Sensitivity enhancement of dielectric plasma etching
endpoint detection by optical emission spectra with
modified k-means cluster analysis. In IEEE Trans-
actions on Semiconductor Manufacturing, volume 30.
issue 1.
H. L. Maynard, E. A. Rietman, J. T. C. L. and Ibbotson,
D. E. (1996). Plasma etching endpointing by monitor-
ing radio-frequency power In Journal of Electrochem.
Society, volume 143 no 6, pages 2029–2035.
H. Noh, D. K. and Han., S. (2015). Real time endpoint
detection in plasma etching using real-time decision
making algorithm. In China Semiconductor Technol-
ogy International Conference, Shangai., pages 1–3.
Han, K., Yoon, E. S., Lee, J., Chae, H., Han, K. H., and
Park, K. J. (2008). Real-time end-point detection us-
ing modified principal component analysis for small
open area sio2 plasma etching. In Industrial & Engi-
neering Chemistry Research, volume 47, no 11, pages
3907–3911.
K. Han, S. Kim, K. J. P. E. S. Y. and Chae., H. Principal
component analysis based support vector machine for
the endpoint detection of the metal etch process. In
Proc. IFAC World Congr.
Kim, B. and Kim., S. (2004). Partial diagnostic data to
plasma etch modeling using neural network. In Mi-
croelectron. Eng., volume 75 no 4, pages 397–404.
Puggini, L., M. S. (2015). Extreme learning machines for
virtual metrology and etch rate prediction. In 26th
IEEE Irish Signals and Systems Conference (ISSC),
pages 1–6.
Rousseeuw, P. J. (1987). Silhouettes: A graphical aid to
the interpretation and validation of cluster analysis. In
Journal of Computational and Applied Mathematics,
volume 20, pages 53–65.
S. Hong, G. M. and Park, D.-C. (2003). Neural network
modeling of reactive ion etching using optical emis-
sion spectroscopy data. In IEEE Trans. Semicond.
Manuf., volume 16 no 4, pages 598–6081–6.
S. Rangan, C. S. and Poolla, K. (1997). Modeling and filter-
ing of optical emission spectroscopy data for plasma
etching systems. In IEEE International Symposium of
Semiconducter Manufacturing, page B41–B44.
Tian Zhang, R. R. and Livny., M. (January 1997). Birch: A
new data clustering algorithm and its applications. In
Data Min. Knowl. Discov., pages 141–182.
Using Unsupervised Machine Learning for Plasma Etching Endpoint Detection
279
