
SIRA-HIV: A User-friendly System to Evaluate HIV-1 Drug
Resistance from Next-generation Sequencing Data
Letícia Martins Raposo
1,2 a
, Mônica Barcellos Arruda
3b
, Rodrigo de Moraes Brindeiro
3c
and Flavio Fonseca Nobre
1d
1
Programa de Engenharia Biomédica, Universidade Federal do Rio de Janeiro,
Av. Horácio Macedo, 2030, Rio de Janeiro, Brazil
2
Departamento de Métodos Quantitativos, Universidade Federal do Estado do Rio de Janeiro,
Av. Pasteur, 458, Rio de Janeiro, Brazil
3
Departamento de Genética, Universidade Federal do Rio de Janeiro,
Rua Professor Rodolpho Paulo Rocco, Rio de Janeiro, Brazil
Keywords: HIV, Drug Resistance, Deep Sequencing, Sequence Analysis, User-Computer Interface, Software.
Abstract: Evaluating next-generation sequencing (NGS) data requires an extensive knowledge of bioinformatics and
programming commands, which could limit the studies in this area. We propose a user-friendly system to
analyse raw NGS data from HIV-1 patient samples to identify amino acid variants and the virus susceptibility
to antiretrovirals. SIRA-HIV was developed as an R Shiny web application. The software Segminator II was
applied to analyse viral data. Four genotypic interpretation systems were implemented in R language to
classify the HIV susceptibility: the French National Agency for AIDS Research (ANRS), the Stanford HIV
Drug Resistance Database (HIVdb), the Rega Institute (Rega) and the Brazilian Network for HIV-1
Genotyping (Brazilian Algorithm). SIRA-HIV was structured in two analysis components. The Drug
Resistance Positions module shows the resistance positions, their frequencies, and the coverage. In the
Genotypic Resistance Interpretation Algorithms module, the rule-based systems are available to interpret
HIV-1 drug resistance genotyping results. SIRA-HIV exhibited comparable results to Deep Gen HIV,
HyDRA, and PASeq. As advantage, the proposed application shows susceptibility levels from the most widely
used rule-based systems and works locally, allowing analysis not to rely on the internet. SIRA-HIV could be
a promising system to aid in HIV-1 patient data analysis.
1 INTRODUCTION
Human immunodeficiency virus type 1 (HIV-1) is a
viral agent responsible for one of the most impactful
pandemics in the world. Several antiretroviral drugs
are available to attempt to control HIV infection.
Despite the benefits of the therapy, the development
of drug resistance represents a significant obstacle to
the long-term effectiveness of antiretroviral therapy.
Resistance identification is a key issue for the
improved management of HIV-1 patients.
Most genotypic drug resistance testing is
established from expert-based rules using predefined
sets of known mutations. These interpretation
a
https://orcid.org/0000-0003-0613-5582
b
https://orcid.org/0000-0002-5311-5595
c
https://orcid.org/0000-0002-8675-4094
d
https://orcid.org/0000-0003-4261-8258
systems have been developed over the years to detect
resistance to antiretrovirals (ARVs). The most-used
rule-based algorithms are from the French National
Agency for AIDS Research (ANRS) (Meynard et al.,
2002), the Rega Institute (Rega) (Van Laethem et al.,
2002) and the Stanford HIV Reverse Transcriptase
and Protease Sequence Database (HIVdb) (Rhee et
al., 2003). In Brazil, the Brazilian Network for HIV-
1 Genotyping (http://50.116.24.135:8080/HIV/
resistencia.jsp) recommends the Brazilian algorithm
for the interpretation of mutations associated with
resistance to ARVs. These interpretation systems are
built on genotypic results from the Sanger sequencing
method, a traditional genotyping approach used in the
Raposo, L., Arruda, M., Brindeiro, R. and Nobre, F.
SIRA-HIV: A User-friendly System to Evaluate HIV-1 Drug Resistance from Next-generation Sequencing Data.
DOI: 10.5220/0008874700930100
In Proceedings of the 13th International Joint Conference on Biomedical Engineering Systems and Technologies (BIOSTEC 2020) - Volume 3: BIOINFORMATICS, pages 93-100
ISBN: 978-989-758-398-8; ISSN: 2184-4305
Copyright
c
2022 by SCITEPRESS – Science and Technology Publications, Lda. All rights reserved
93

detection of drug-resistance mutations (Gibson,
Schmotzer & Quiñones-Mateu, 2014). This assay
identifies HIV variants present over 15-20% of the
viral population, limiting its sensitivity to detect
minority variants (Erali, Page & Reimer, 2001;
Gibson et al., 2014; Palmer et al., 2005).
New techniques for sequencing DNA, such as
next-generation sequencing (NGS), have already
been explored in genotypic HIV resistance tests. They
produce a massive volume of sequences with a fast
processing time. Genotypic tests based on this
sequencing approach detect minority variants at
frequencies as low as 1% (Gibson et al., 2014; Wang
et al., 2007). These variants offer additional
information that may help to drive changes in ARV
regimens based on predicted future resistance profiles
that will benefit people living with HIV.
The analysis of NGS data to identify these HIV
variants often requires extensive knowledge of
computing and bioinformatics, such as programming
skills and the use of the UNIX-based operating
system. These requirements make the broad use of
NGS data interpretation difficult and restrict the range
of studies in this area. To overcome these limitations,
we present SIRA-HIV, a user-friendly system
developed in R (R Core Team, Vienna, Austria) to
process raw NGS reads generated from HIV-infected
patient samples. This tool provides a list of amino
acid mutations annotated with their frequencies and
the levels of susceptibility for each ARV from
different genotypic interpretation systems.
2 MATERIALS AND METHODS
The system works in three steps: (i) next-generation
sequence analysis, (ii) HIV-1 amino acid variant
identification and (iii) HIV-1 susceptibility
classification.
2.1 Next-generation Sequence Analysis
The raw NGS reads, from outputs in the FASTQ
format, are analysed using Segminator II, software
developed by Archer and colleagues (Archer et al.,
2012). This program is a variant calling algorithm that
analyses viral deep sequencing data from different
platforms, providing a precise mapping and
alignment of the reads against the reference sequence.
Segminator II was implemented in Java and has a
user-friendly interface, simplifying the analysis of
NGS data. Some studies have already employed this
software to analyse viral populations (Aoudjane et al.,
2014; Gibson et al., 2014; Macalalad et al., 2012;
Vrancken et al., 2016). In particular, Gibson et al.,
2014 used Segminator II in their study to assess HIV-
1 susceptibilities to ARVs and to predict HIV-1
coreceptor tropism. More information about variant
calling steps, see Archer et al., 2012.
2.2 HIV-1 Amino Acid Variant
Identification
The output file of Segminator II, called VEME Table,
is used to identify the amino acids present in the
structure of three enzymes: protease (PR), reverse
transcriptase (RT) and integrase (IN). This file has
information about coverage (the number of times a
genome has been sequenced) and the nucleotide
frequencies at each position. From these data, for
each one of the three enzymes, all possible codons are
assembled and translated providing all amino acid
variants and their frequencies for each position. As
minority variants may be present at similar
frequencies as sequencing artefacts, a threshold of 1%
was chosen to select the variants. This value has
already been used in previous studies (Mohamed et
al., 2014; Paredes et al., 2010; Vandenbroucke et al.,
2011).
The analysis to assemble and identify the HIV-1
amino acid variants from the VEME Table results
was developed in R language.
2.3 HIV-1 Susceptibility Classification
The classification rules from the genotypic resistance
interpretation systems including ANRS version 29
(http://www.hivfrenchresistance.org/archives.html),
HIVdb version 8.7 (https://hivdb.stanford.edu/
page/release-notes/#algorithm.updates), Rega
version 10.0.0 (https://rega.kuleuven.be/cev/avd/
software/rega-algorithm), and the Brazilian
Algorithm version 13 (http://50.116.24.135:8080/
HIV/resistencia.jsp) were implemented in the R
language and are used to classify HIV-1 susceptibility
to ARVs.
The interpretation systems that were incorporated
into SIRA-HIV provide predictions for 24 drugs: PIs
(atazanavir/r (ATV/r), darunavir/r (DRV/r),
fosamprenavir/r (FPV/r), indinavir/r (IDV/r),
lopinavir/r (LPV/r), nelfinavir (NFV), saquinavir/r
(SQV/r), and tipranavir/r (TPV/r)); NRTIs (abacavir
(ABC), zidovudine (AZT), stavudine (D4T),
didanosine (DDI), emtricitabine (FTC), lamivudine
(3TC) and tenofovir (TDF)), NNRTIs (doravirine
(DOR), efavirenz (EFV), etravirine (ETR),
nevirapine (NVP), and rilpivirine (RPV)); and INIs
(bictegravir (BIC), dolutegravir (DTG), elvitegravir
BIOINFORMATICS 2020 - 11th International Conference on Bioinformatics Models, Methods and Algorithms
94

(EVG), and raltegravir (RAL)).
2.4 Implementation
The program was implemented using R software
version 3.2.5 (R Development Core Team, 2013).
SIRA-HIV is based on the use of libraries seqinr
(Charif & Lobry, 2007), gtools (Warnes, Bolker &
Lumley, 2015), plotly (Sievert et al., 2017), DT (Xie,
2016), shinyBS (Bailey, 2015), and shiny (Chang et
al., 2017) to create a system requiring no
programming experience from the user. The output of
SIRA-HIV comprises a list of amino acid mutations,
with their respective frequencies for each sample and
the levels of drug resistance predicted by the rule-
based algorithms for each ARV.
2.5 Validation against Software
Pipelines
To confirm the results provided by SIRA-HIV, nine
HIV-1 genotype samples sequenced using the Ion
Torrent® PGM platform at the Molecular Virology
Laboratory of the Health Sciences Centre of the
Federal University of Rio de Janeiro (CCS - UFRJ /
Brazil) were used.
The mutations identified by SIRA-HIV were
compared to those defined by three already existing
software pipelines: DeepGen HIV (Gibson et al.,
2014), HyDRA (https://hydra.canada.ca/), and
PASeq (Noguera-Julian et al., 2017). The software
analysed the same samples, and only the mutations
with a frequency greater than or equal to 1% were
considered in the comparison.
3 RESULTS
This section describes the final graphical interface of
the system and the results of the comparison of SIRA-
HIV to the others software.
SIRA-HIV is structured in two modules that are
dependent on each other. The first one, called Drug
Resistance Positions, manages next-generation
sequence analysis and HIV-1 amino acid variant
identification. The second module, Genotypic
Resistance Interpretation Algorithms, is responsible
for the HIV-1 susceptibility classification from the
four rules-based interpretation systems: ANRS,
HIVdb, Rega and the Brazilian algorithm.
The median runtime required for analysing HIV-
1 sequence since the insertion of FASTA and FASTQ
files until SIRA-HIV shows the results is about 2
minutes.
3.1 Drug Resistance Positions
This module maps the reads generated by the NGS to
the HIV-1 reference genome, analyses the mapping
results, and identifies the amino acids present in the
drug resistance-associated positions.
To start the analysis, the user provides a name to
be assigned to the report files. In step 1, by pressing
the “Run” button, the user tells SIRA-HIV to open the
Segminator II. Before NGS data input, Segminator II
requires a project to be set up, which involves
entering a project name (using the “Add Project”
menu option) and providing a reference template in
FASTA format. To this version of SIRA-HIV, the
HIV-1 B HXB2 reference strain (Accession number:
K03455) is used as a template. After setting up a
project, NGS datasets in the FASTQ format are added
using the “Add Dataset” menu. After the dataset is
added, Segminator II automatically generates an
assembly by first mapping and then pairwise
alignment each read using the default parameters. The
user can also adjust alignment and mapping
parameters before the alignment. The results are
exported using the “Tools > VEME Table” menu. If
the user already has the VEME Table, step 1 of SIRA-
HIV can be skipped.
In step 2, the VEME Table file is loaded, and in
step 3, the region of the HIV-1 pol gene (PR, RT or
IN) is chosen. Each region is evaluated separately,
according to the option selected. SIRA-HIV displays
a main table with the drug resistance-associated
positions, accompanied by the wild-type HIV-1
amino acid (before the position) and the amino acid
identified in the sequences (after the position), the
frequency in percent for each amino acid and the
coverage. A coverage plot displaying the number of
times a genome has been sequenced can be displayed
on the screen using the “Coverage plot” button. Fig 1
shows the Drug Resistance Positions module.
After this first analysis, the user can download a
printable report. The program can export to three
different file formats: CSV (.csv), Excel (.xls), and
PDF (.pdf). The coverage plot can be saved in the
.png format.
The HIV-1 drug resistance-associated positions
displayed in the system are based on those from the
HIVdb list, found at https://hivdb.stanford.edu/
hivdb/by-mutations/, together with other positions
cited in the literature (Kantor et al., 2001; Rhee et al.,
2006).
SIRA-HIV: A User-friendly System to Evaluate HIV-1 Drug Resistance from Next-generation Sequencing Data
95
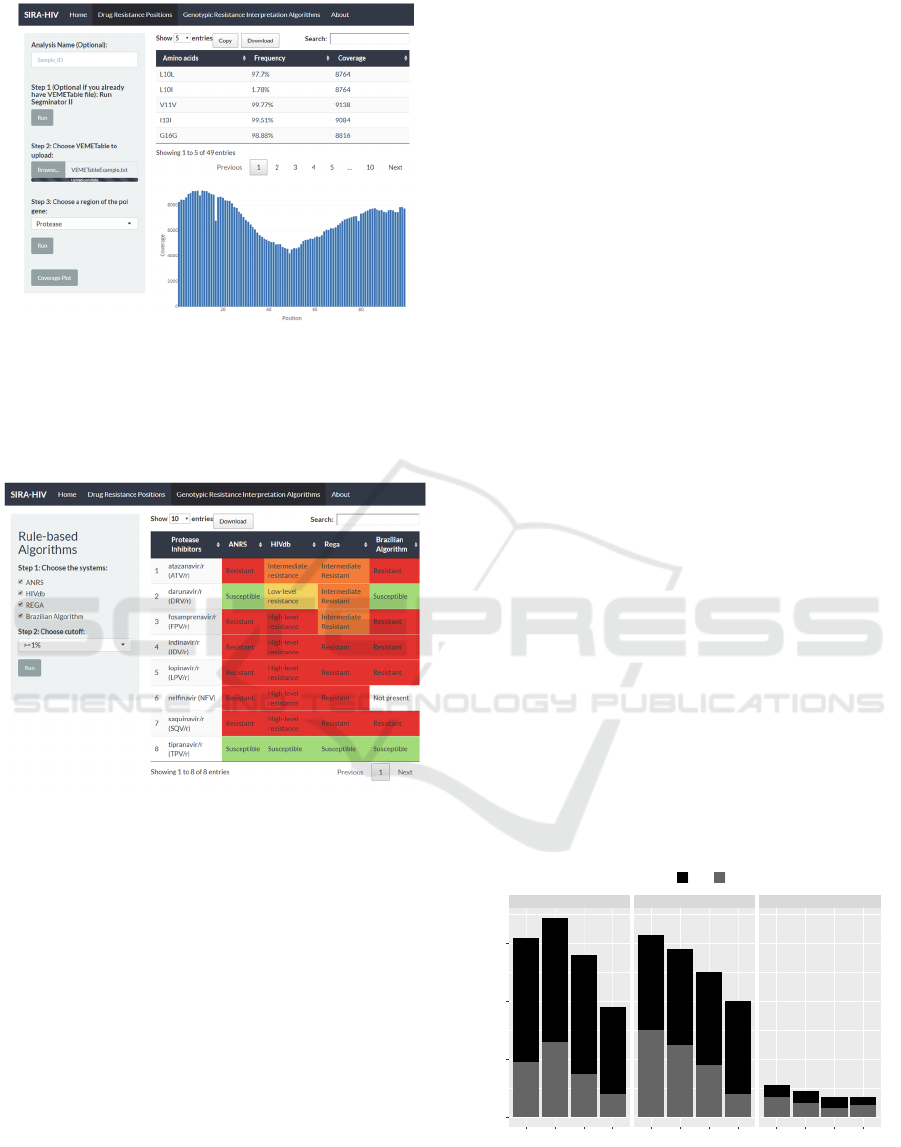
Figure 1: First module of SIRA-HIV. Users provide the
NGS sequences to Segminator II and select the region of
the pol gene to be analysed. The system provides the
information for the amino acids and their frequencies in
each drug resistance position. In this example, the protease
was chosen, and the “Coverage plot” button was selected.
Figure 2: Second module of SIRA-HIV. The genotypic
resistance interpretation algorithms depict the resistance
classifications. The 4 algorithms and the threshold ≥ 1%
were chosen in this example.
3.2 Genotypic Resistance
Interpretation Algorithms
This module classifies the HIV-1 susceptibility level
to ARVs by the rule-based systems ANRS, HIVdb,
Rega and the Brazilian Algorithm.
The user can select one or more systems to
classify the data in step 1 and can select two
thresholds (≥ 1% and ≥ 20%) in step 2. The first one
selects the amino acids from the drug resistance
positions with frequencies greater than or equal to
20%, and the second one chooses the amino acids
with frequencies greater than or equal to 1%. When
the user selects the first option (≥ 20%), minority
variants are not included in the set of mutations
allocated to the rule-based systems. When selecting
the second threshold (≥1%), minority variants
detected by NGS are included in the analysis (Fig 2).
We chose to look at percentage cut-offs 20% and 1%
because the upper end (20%) reflects what can be
detected using Sanger-based platforms, while the
lower end (1%) reflects what is possible using NGS
platforms.
SIRA-HIV shows the classifications of the
selected rule-based systems for the ARVs that act on
the proteins chosen in the module Drug Resistance
Positions. The user can also download a printable
report in this module. The program can export to three
different file formats: CSV (.csv), Excel (.xls), and
PDF (.pdf).
3.3 Validation
In order to evaluate the mutations identified by SIRA-
HIV, three other available software were used:
DeepGen HIV, HyDRA, and PASeq. Since the lists
of mutations that could be identified varied among the
software, only those common to the four pipelines
were used in the comparison.
Fig 3 shows the number of mutations found by
SIRA-HIV and the other three pipelines, according to
the pol gene regions analysed. Mutations with a
frequency between 1% and 20% were classified as
minority, and those with a frequency above 20% were
classified as a majority mutation. Regarding majority
mutations, similar values were observed for all
software, with the exception of PASeq in the PR
region, which presented a smaller number of
mutations. In relation to minority mutations, SIRA-
HIV and DeepGen HIV had a higher number of
observations, with closer results, while HyDRA and
PASeq identified a smaller number.
Figure 3: Number of minority and majority mutations found
in protease (PR), reverse transcriptase (RT) and integrase
(IN). Nine HIV-1 sequences were analysed by SIRA-HIV,
DeepGen HIV, HyDRA and PASeq.
19
43
26
43
15
41
8
30
30
33
25
33
18
32
8
32
7
4
5
4
3
4
4
3
PR RT IN
SIRA-HIVDeepGen HyDRA PASeq SIRA-HIVDeepGen HyDRA PASeq SIRA-HIVDeepGen HyDRA PASeq
0
20
40
60
Software
Number of Mutations
Mutation
Major Minor
BIOINFORMATICS 2020 - 11th International Conference on Bioinformatics Models, Methods and Algorithms
96

When comparing the concordant mutations
between SIRA-HIV and each of the other three
software, it can be observed in Fig 4 that the mutation
frequency measurements determined by SIRA-HIV
showed a high agreement with the frequency reported
by the other pipelines.
Additionally, the quality of agreement was
evaluated according to the minority or majority
mutation classification. Fig 4 shows that SIRA-HIV
disagreed with the other three software in five points.
They represent only two mutations found in the RT
region. While SIRA-HIV reported a frequency below
20% for the Y181C mutation, the other three software
found values above 20%. For the G190A mutation,
SIRA-HIV, as well as DeepGen HIV, had a frequency
above 20%, while HyDRA and PASeq presented
frequencies below 20%.
Figure 4: Agreement between SIRA-HIV and the three
others software in the analysis of nine HIV-1 patient
samples. The linearity in mutation frequency measurements
shows a great concordance between the evaluated software
and the others systems. SIRA-HIV disagreed with only for
two mutations, Y181C and G190A, found in reverse
transcriptase sequence. These frequency discrepancies are
marked in grey on the graph.
4 DISCUSSION
This work developed a user-friendly system called
SIRA-HIV, implemented in R language, in which
users unfamiliar with command lines and other
programming skills can analyse NGS data. The
system identifies mutations present in the HIV-1
genome and categorizes the virus susceptibility level
to each ARV by using two thresholds (≥ 1% and ≥
20%). The first range includes the minor and major
population of resistance mutations, whereas the
second range comprises only the major resistance
mutation population.
To validate SIRA-HIV, three others next-
generation sequencing analysis pipelines were
selected: DeepGen HIV, HyDRA, and PASeq.
Although DeepGen HIV is not publicly available, it
was used in the validation step since it also uses
Segminator II as a mapping algorithm. Segminator II
was chosen to perform sequence mapping and
alignment due to its wide usage in other HIV studies
(Aoudjane et al., 2014; Gibson, Meyer, et al., 2014;
Vrancken et al., 2016), its specificity in
characterizing viral data and its easy-to-use graphical
interface.
In general, it was observed that SIRA-HIV and
DeepGen HIV showed the highest agreement in the
identification of mutations in the nine HIV + patients
samples. This can be explained due to the use of
Segminator II as the sequence mapping software and
the use of a reference sequence with the same length
(position 1807 to 5096 relative to HXB2 isolate
genome). One of the possible explanations for the
differences found between these systems may be
related to the mapping parameters of the Segminator
II. In the present study, the default values of the
program were used, except for the “Replace Template
with the Con option”. DeepGen HIV also uses this
option; however, we were unable to obtain
information about the other parameters used by this
pipeline. Variations in the values can cause changes
in the mapping and, consequently, can generate
different results between analyses.
Another possible source of mismatch among
identified mutations may be related to the reference
sequence used in the mapping. In DeepGen HIV, the
reference sequence is chosen from the Los Alamos
HIV Sequence Database. The most similar sequence
to 100 readings randomly selected from the NGS
dataset is used as a reference. In this study, the HXB2
reference sequence, corresponding to the wild-type
genome of the HIV-1 subtype B virus, was used.
In relation to HyDRA and PASeq, both software
identified a smaller number of mutations, mainly the
minority variants in the PR and RT region. These
regions have a greater number of positions, which
may explain this increase of disagreement in the
number of mutations identified. In addition, some
analysed sequences presented lower coverage for the
RT and IN region, which may have influenced the
identification of minority mutations by these two
software. PASeq also identified a smaller number of
majority mutations for the PR region.
In relation to the graphical interface, SIRA-HIV
was structured in two main analysis components. In
the Drug Resistance Positions module, the results are
shown in table form, containing the resistance
SIRA-HIV: A User-friendly System to Evaluate HIV-1 Drug Resistance from Next-generation Sequencing Data
97

positions, their original and sampled amino acids,
their frequencies, and the coverage. A coverage graph
per position was also included to ease the
visualization of the values.
It is important to know this variable since a
minimum coverage of approximately 450 nucleotides
in nonhomopolymeric regions (without nucleotide
repeats) is suggested to ensure the detection of
minority variants present in over 1% of the population
(Wang et al., 2007). In the Genotypic Resistance
Interpretation Algorithms module, the international
algorithms ANRS, HIVdb, and Rega and the national
Brazilian algorithm were included in the SIRA-HIV
to provide different classification options to users.
Most pipelines, even being user-friendly, do not show
the level of HIV-1 drug resistance or only show the
predictions according to HIVdb, as it can be observed
in DeepGen HIV and PASeq. SIRA-HIV is more
complete in this respect. Accessing the most widely
used rule-based systems (ANRS, HIVdb, and Rega),
the user can check if the systems are discordant in
their classifications or if there is a consensus between
them.
As well as Hydra and PASeq, SIRA-HIV has the
advantage of not requiring computer-programming
skills, which are often necessary for bioinformatics.
Users only need the NGS sequences and the reference
template to start the analyses. Several health analytics
tools have been developed as user-friendly systems to
facilitate data analysis that often requires
programming skills, including the shiny R package
(Moraga, 2017; Tarvainen et al., 2014).
Another positive aspect is the capability of the
system to consider two threshold variant levels. When
all mutations greater than or equal to 1% are
considered, the user can infer the possible impact of
drug-resistant minority variants over future ARV
regimen success. Nevertheless, there is still much
debate about their clinical relevance. Drug-resistant
minority variants are not yet fully considered in
decision making on the best therapeutic regimen (Li
& Kuritzkes, 2013). However, it is expected that
some of these minority mutations may be selected,
increasing their frequencies in the population and
leading to future therapeutic failure. Therefore, this
information can assist the physician in the decision-
making about the best treatment regimen to be
adopted for each HIV-1 patient.
In future versions, we intend to add classifiers
designed to predict HIV-1 coreceptor tropism as well
as to add ensemble models based on genotypic
interpretation systems to provide a single HIV-1
resistance profile, since these algorithms use different
rules to predict drug susceptibility, resulting in
possible differences between these methods (Eberle
& Gürtler, 2012; Kijak et al., 2003; Snoeck et al.,
2006; Vergne et al., 2006).
In conclusion, the user-friendly interface
presented in this work could be a promising system to
aid in the data analysis of HIV+ patient data.
Physicians and laboratories can access HIV genome
information that can help better understand the drug
resistance problem and can provide the appropriate
and personalized treatment for each patient. In
addition, working with NGS data, SIRA-HIV
includes additional information not found in Sanger
sequencing, promoting the detection of minority
populations of resistant viruses and improving drug
resistance interpretations. SIRA-HIV is available on
https://github.com/leticiaraposo/sira-hiv and works
locally allowing analysis not to rely on the internet,
another advantage compared to the systems
mentioned here.
REFERENCES
Aoudjane, S., Chaponda, M., González Del Castillo, A. A.,
O’Connor, J., Noguera, M., Beloukas, A., … Geretti, A.
M. (2014). Hepatitis B Virus Sub-genotype A1
Infection Is Characterized by High Replication Levels
and Rapid Emergence of Drug Resistance in HIV-
Positive Adults Receiving First-line Antiretroviral
Therapy in Malawi. HIV/AIDS, 59(11), 1618–1626.
https://doi.org/10.1093/cid/ciu630
Archer, J., Baillie, G., Watson, S. J., Kellam, P., Rambaut,
A., & Robertson, D. L. (2012). Analysis of high-depth
sequence data for studying viral diversity: a comparison
of next generation sequencing platforms using
Segminator II. BMC Bioinformatics, 13(1), 47.
https://doi.org/10.1186/1471-2105-13-47
Bailey, E. (2015). shinyBS: Twitter Bootstrap Components
for Shiny. Retrieved from https://cran.r-
project.org/package=shinyBS
Chang, W., Cheng, J., Allaire, J. J., Xie, Y., & McPherson,
J. (2017). shiny: Web Application Framework for R.
Retrieved from https://cran.r-project.org/package
=shiny
Charif, D., & Lobry, J. R. (2007). Seqin{R} 1.0-2: a
contributed package to the {R} project for statistical
computing devoted to biological sequences retrieval
and analysis. In U. Bastolla, M. Porto, H. E. Roman, &
M. Vendruscolo (Eds.), Structural approaches to
sequence evolution: Molecules, networks, populations
(pp. 207–232). New York: Springer Verlag.
Eberle, J., & Gürtler, L. (2012). The evolution of drug
resistance interpretation algorithms: ANRS, REGA and
extension of resistance analysis to HIV-1 group O and
HIV-2. Intervirology, 55(2), 128–133.
https://doi.org/10.1159/000332009
BIOINFORMATICS 2020 - 11th International Conference on Bioinformatics Models, Methods and Algorithms
98

Erali, M., Page, S. A. M., & Reimer, L. G. (2001). Human
Immunodeficiency Virus Type 1 Drug Resistance
Testing : a Comparison of Three Sequence-Based
Methods. Society, 39(6), 2157–2165.
https://doi.org/10.1128/JCM.39.6.2157
Gibson, R. M., Meyer, A. M., Winner, D., Archer, J.,
Feyertag, F., Ruiz-Mateos, E., … Quiñones-Mateu, M.
E. (2014). Sensitive deep-sequencing-based HIV-1
genotyping assay to simultaneously determine
susceptibility to protease, reverse transcriptase,
integrase, and maturation inhibitors, as well as HIV-1
coreceptor tropism. Antimicrobial Agents and
Chemotherapy, 58(4), 2167–2185. https://doi.org/
10.1128/AAC.02710-13
Gibson, R. M., Schmotzer, C. L., & Quiñones-Mateu, M. E.
(2014). Next-generation sequencing to help monitor
patients infected with HIV: Ready for clinical use?
Current Infectious Disease Reports, 16(4).
https://doi.org/10.1007/s11908-014-0401-5
Kantor, R., Machekano, R., Gonzales, M. J., Dupnik, K.,
Schapiro, J. M., & Shafer, R. W. (2001). Human
Immunodeficiency Virus Reverse Transcriptase and
Protease Sequence Database: an expanded data model
integrating natural language text and sequence analysis
programs. Nucleic Acids Res, 29(1), 296–299.
Retrieved from http://www.ncbi.nlm.nih.gov/
entrez/query.fcgi?cmd=Retrieve&db=PubMed&dopt=
Citation&list_uids=11125118
Kijak, G. H., Rubio, A. E., Pampuro, S. E., Zala, C., Cahn,
P., Galli, R., … Salomón, H. (2003). Discrepant results
in the interpretation of HIV-1 drug-resistance genotypic
data among widely used algorithms. HIV Medicine,
4(1), 72–78. https://doi.org/10.1046/j.1468-
1293.2003.00131.x
Li, J. Z., & Kuritzkes, D. R. (2013). Clinical Implications
of HIV-1 Minority Variants. Clin Infect Dis., 56(11),
1667–1674. https://doi.org/10.1093/cid/cit125
Macalalad, A. R., Zody, M. C., Charlebois, P., Lennon, N.
J. N., Newman, R. M., Malboeuf, C. M., … Baldwin, J.
(2012). Highly sensitive and specific detection of rare
variants in mixed viral populations from massively
parallel sequence data. PLoS Computational Biology,
8(3), e1002417. https://doi.org/10.1371/journal.
pcbi.1002417
Meynard, J.-L., Vray, M., Morand-Joubert, L., Race, E.,
Descamps, D., Peytavin, G., … Girard, P.-M. (2002).
Phenotypic or genotypic resistance testing for choosing
antiretroviral therapy after treatment failure: a
randomized trial. AIDS (London, England), 16(5), 727–
736. Retrieved from http://www.ncbi.nlm.nih.gov/
pubmed/11964529
Mohamed, S., Penaranda, G., Gonzalez, D., Camus, C.,
Khiri, H., Boulmé, R., … Halfon, P. (2014). Clinical
impact of ultra deep versus Sanger sequencing
detection of minority mutations on HIV-1 drug
resistance genotype interpretation after virological
failure. BMC Infectious Diseases, 14(Suppl 2), O1.
https://doi.org/10.1186/1471-2334-14-S2-O1
Moraga, P. (2017). SpatialEpiApp : A Shiny web
application for the analysis of spatial and spatio-
temporal disease data. Spatial and Spatio-Temporal
Epidemiology, 23, 47–57. https://doi.org/10.1016/
j.sste.2017.08.001
Noguera-Julian, M., Edgil, D., Harrigan, P. R., Sandstrom,
P., Godfrey, C., & Paredes, R. (2017). Next-Generation
Human Immunodeficiency Virus Sequencing for
Patient Management and Drug Resistance Surveillance.
The Journal of Infectious Diseases, 216(suppl_9),
S829–S833. https://doi.org/10.1093/infdis/jix397
Palmer, S., Kearney, M., Maldarelli, F., Elias, K., Bixby, C.
J., Bazmi, H., … Metcalf, J. a. (2005). Multiple , Linked
Human Immunodeficiency Virus Type 1 Drug
Resistance Mutations in Treatment-Experienced
Patients Are Missed by Standard Genotype Analysis
Multiple , Linked Human Immunodeficiency Virus
Type 1 Drug Resistance Mutations in Treatment-
Experie. JOurnal of Clinical Microbiology, 43(1), 403.
https://doi.org/10.1128/JCM.43.1.406
Paredes, R., Lalama, C. M., Ribaudo, H. J., Schackman, B.
R., Shikuma, C., Giguel, F., … AIDS Clinical Trials
Group (ACTG) A5095 Study Team, D. R. (2010). Pre-
existing minority drug-resistant HIV-1 variants,
adherence, and risk of antiretroviral treatment failure.
The Journal of Infectious Diseases, 201(5), 662–671.
https://doi.org/10.1086/650543
R Development Core Team. (2013). R Software. R: A
Language and Environment for Statistical Computing.
Rhee, S.-Y., Gonzales, M. J., Kantor, R., Betts, B. J.,
Ravela, J., & Shafer, R. W. (2003). Human
immunodeficiency virus reverse transcriptase and
protease sequence database. Nucleic Acids Research,
31(1), 298–303. https://doi.org/10.1093/nar/gkg100
Rhee, Soo-Yon, Kantor, R., Katzenstein, D. A., Camacho,
R., Morris, L., Sirivichayakul, S., … International Non
Subtype B HIV-1 Working Group. (2006). HIV-1 pol
mutation frequency by subtype and treatment
experience: extension of the HIVseq program to seven
non-B subtypes. AIDS, 20(5), 643–651.
https://doi.org/10.1097/01.aids.0000216363.36786.2b
Sievert, C., Parmer, C., Hocking, T., Chamberlain, S., Ram,
K., Corvellec, M., & Despouy, P. (2017). plotly: Create
Interactive Web Graphics via “plotly.js.” Retrieved
from https://cran.r-project.org/package=plotly
Snoeck, J., Kantor, R., Shafer, R. W., Van Laethem, K.,
Deforche, K., Carvalho, A. P., … Vandamme, A. M.
(2006). Discordances between interpretation algorithms
for genotypic resistance to protease and reverse
transcriptase inhibitors of human immunodeficiency
virus are subtype dependent. Antimicrobial Agents and
Chemotherapy, 50(2), 694–701. https://doi.org/
10.1128/AAC.50.2.694-701.2006
Tarvainen, M. P., Niskanen, J.-P., Lipponen, J. A., Ranta-
Aho, P. O., & Karjalainen, P. A. (2014). Kubios HRV
– Heart rate variability analysis software. Computer
Methods and Programs in Biomedicine, 113(2), 210–
220. https://doi.org/10.1016/j.cmpb.2013.07.024
Van Laethem, K., De Luca, A., Antinori, A., Cingolani, A.,
Perno, C. F., & Vandamme, A. M. (2002). A genotypic
drug resistance interpretation algorithm that
SIRA-HIV: A User-friendly System to Evaluate HIV-1 Drug Resistance from Next-generation Sequencing Data
99

significantly predicts therapy response in HIV-1-
infected patients. Antiviral Therapy, 7(2), 123–129.
Vandenbroucke, I., Van Marck, H., Verhasselt, P., Thys,
K., Mostmans, W., Dumont, S., … Aerssens, J. (2011).
Minor variant detection in amplicons using 454 massive
parallel pyrosequencing: experiences and
considerations for successful applications.
BioTechniques, 51(3), 167–177. https://doi.org/
10.2144/000113733
Vergne, L., Snoeck, J., Aghokeng, A., Maes, B., Valea, D.,
Delaporte, E., … Laethem, K. Van. (2006). Genotypic
drug resistance interpretation algorithms display high
levels of discordance when applied to non-B strains
from HIV-1 naive and treated patients. FEMS
Immunology and Medical Microbiology, 46(1), 53–62.
https://doi.org/10.1111/j.1574-695X.2005.00011.x
Vrancken, B., Trovão, N., Baele, G., van Wijngaerden, E.,
Vandamme, A.-M., van Laethem, K., & Lemey, P.
(2016). Quantifying Next Generation Sequencing
Sample Pre-Processing Bias in HIV-1 Complete
Genome Sequencing. Viruses, 8(1), 12.
https://doi.org/10.3390/v8010012
Wang, C., Mitsuya, Y., Gharizadeh, B., Ronaghi, M., &
Shafer, R. W. (2007). Characterization of mutation
spectra with ultra-deep pyrosequencing: Application to
HIV-1 drug resistance. Genome Research, 17(8), 1195–
1201. https://doi.org/10.1101/gr.6468307
Warnes, G. R., Bolker, B., & Lumley, T. (2015). gtools:
Various R Programming Tools. Retrieved from
https://cran.r-project.org/package=gtools
Xie, Y. (2016). DT: A Wrapper of the JavaScript Library
“DataTables.” Retrieved from https://cran.r-
project.org/package=DT
BIOINFORMATICS 2020 - 11th International Conference on Bioinformatics Models, Methods and Algorithms
100
