
Validation of Evacuation Decision Model:
An Attempt to Reproduce Human Evacuation Behaviors
during the Great East Japan Earthquake
Akira Tsurushima
SECOM CO., LTD., Intelligent Systems Laboratory, Tokyo, Japan
Keywords:
Evacuation Behavior, Herd Behavior, Decision Making, Video Analysis, Response Threshold Model.
Abstract:
The evacuation decision model was developed to represent human herd behavior during disaster evacuations
and employed to analyze symmetry breaking phenomena in evacuation exit choices. However, it has yet to be
tested on actual human evacuation data. By examining video footage recorded during the Great East Japan
Earthquake, we discovered unusual evacuation behaviors previously unreported in the literature. Those being
the choice between fleeing and the drop-cover-hold on action. These behaviors formed a unique spatial pattern
when observed in a room. In this study, we attempt to reproduce this unique human evacuation behavior via
multiagent simulations using the evacuation decision model and demonstrate that simple herd behavior is
sufficient to reproduce the spatial pattern of the evacuation decisions.
1 INTRODUCTION
In constructive approaches, model validation is cru-
cial but in this case difficult, due to the limited amount
of available objective data since our model domain is
human behavior during disasters. The evacuation de-
cision model (Tsurushima, 2019a) was developed to
represent human herd behavior during disaster evac-
uations. It is employed to analyze symmetry break-
ing phenomena in evacuation exit choices which are
typical in disaster evacuation situations (Tsurushima,
2019b; Tsurushima, 2019c). Herd behavior refers
to the mentality of individuals that make decisions
based on other people’s choices or behaviors instead
of their own intentions or analysis. Herd behavior
is a cognitive bias, a mental tendency yielding erro-
neous behaviors or irrational decisions resulting in
unfavorable outcomes, which can often be observed
in disaster evacuations (Cutter and Barnes, 1982; El-
liott and Smith, 1993). Symmetry breaking in exit
choice is a phenomenon observed when people evac-
uate from a room with two identical exits, in which
the exits are often unequally used and evacuees gather
at one of them. These behaviors result in the ineffi-
cient use of exits, increasing the total evacuation time.
The evacuation decision model has successfully re-
produced symmetry breaking phenomena in evacua-
tion exit choices; however, it is yet to be tested using
real human evacuation data owing to the difficulty of
obtaining those data.
Research on human behaviors during disaster
evacuation has primarily been conducted through in-
terviews (Mas et al., 2012; Drury et al., 2015), labora-
tory experiments using humans (Schmidt and Galea,
2013; Garcimart
´
ın et al., 2014), or laboratory experi-
ments using non human animals (Saloma et al., 2003;
Altshuler et al., 2005; Ji et al., 2017). However these
techniques are limited because of the following:
1. interviews can only be conducted with survivors,
2. it is difficult to reproduce the mental pressure of
real evacuations in laboratory experiments, and
3. animal behaviors are not necessarily identical to
human behaviors.
None of the above assures that data obtained by those
methods refer to real human behaviors in disaster sit-
uations.
With the increase in surveillance cameras and
smartphones, video images of human behavior during
disasters have been recorded; recently, those videos
have been analyzed and human evacuation behav-
iors investigated (Yang et al., 2011; D’Orazio et al.,
2014b; Gu et al., 2016; Hori, 2018). Problems such
as accessibility and poor video quality have limited
the success of these approaches (Shiwakoti and Sarvi,
2013).
Tsurushima, A.
Validation of Evacuation Decision Model: An Attempt to Reproduce Human Evacuation Behaviors during the Great East Japan Earthquake.
DOI: 10.5220/0008874300170027
In Proceedings of the 12th International Conference on Agents and Artificial Intelligence (ICAART 2020) - Volume 1, pages 17-27
ISBN: 978-989-758-395-7; ISSN: 2184-433X
Copyright
c
2022 by SCITEPRESS – Science and Technology Publications, Lda. All rights reserved
17

A video clip captured in a meeting room in Sendai
during the Great East Japan Earthquake of March 11,
2011 (Fig. 1) is exceptionally valuable for the follow-
ing reasons:
• the earthquake was captured in one continuous
scene from the beginning to the end,
• the initial position of the people in the room when
the shaking began was clearly recorded, and
• the professionalism of the camera crew rendered
it relatively easy to examine the behavior of each
individual during the earthquake.
By studying this video, real human behaviors during
an earthquake can be analyzed. In this study, by re-
producing human evacuation behaviors observed in
the video, we attempt to confirm the validity of the
evacuation decision model.
The aim of this paper is twofold. First, by an-
alyzing the behavior of the individuals in the video,
unusual human behaviors that are yet to be reported
in the literature are introduced and examined. Sec-
ond, for validation, unusual human behaviors are re-
produced by multiagent simulations using the evacu-
ation decision model.
2 RELATED WORK
Because real-life experiments of earthquake evacua-
tions are difficult to perform owing to the complex-
ities of such environments, studies on human evac-
uation behaviors during earthquakes have been con-
ducted through surveys and interviews.
Kimura et al. conducted a study to understand
the behavioral and psychological reconstruction pro-
cesses of victims in the 2004 Mid-Niigata prefec-
ture earthquake through a survey of sample size 543
(Kimura et al., 2006). Mas et al. estimated dis-
tributions of departure times of tsunami evacuations
through revealed preference and stated preference
surveys (Mas et al., 2012). Drury et al. studied the
solidarity behaviors of evacuees of the 2010 Chile
earthquake by interviewing 1240 people (Drury et al.,
2015). Morita et al. interviewed people in Yamada-
machi and Ishinomaki-shi to investigate the pre-/post-
earthquake evacuation behaviors of the Great East
Japan Earthquake (Morita et al., 2015).
Recently, novel approaches using video to analyze
human behaviors during earthquake evacuations have
emerged.
Yang et al. analyzed the 2008 Wenchuan earth-
quake videos and discovered that the relationship be-
tween arrival time and order of evacuee arrival is lin-
ear in evacuation drills but nonlinear in real evacua-
tions (Yang et al., 2011).
D’Orazio et al. discovered several unique evac-
uation behaviors in earthquakes through video anal-
ysis, e.g., people preferred to search for safe posi-
tions instead of exits when the shaking was strong;
Haiti evacuees attempted to reach for exits but the
Japanese adopted drop-cover-hold on procedures and
preferred group evacuations; people attempted to
maintain social attachments during evacuations; peo-
ple tended to follow the common behavior; and peo-
ple stayed at safe and familiar places after the earth-
quakes (D’Orazio et al., 2014b).
Gu et al. examined school students’ evacuation
behaviors in videos and stated that the response time
was linear in normal conditions but nonlinear in real
evacuations, and the cumulative number of evacuees
was linear in exercises but nonlinear in real situations
(Gu et al., 2016).
Hori analyzed videotapes and estimated the walk-
ing speed of individuals during earthquake evacua-
tions (Hori, 2018).
Bernardini et al. studied whether evacuees fol-
lowed the recommended evacuation actions during
and after earthquakes using a video database. They
compared the response of people in New Zealand,
Italy, and Japan (Bernardini et al., 2019).
Several attempts have been made to build earth-
quake evacuation simulations and subsequently pro-
pose human behavior models for evacuations. Li et
al. developed a method for predicting the number of
casualties in earthquake evacuations using a cellular-
automaton-based evacuation behavioral model in con-
junction with a finite-element-based environment
model. The evacuation behavioral model was verified
by a real-life video recording of classroom evacuation
of Mingshan high school (Li et al., 2018).
Many researchers have adopted agent-based mod-
els to represent human evacuation behaviors. Del-
cea et al. developed an agent-based model for class-
room evacuation behaviors using NetLogo (Wilen-
sky, 1999) to analyze the differences in evacuation
processes between collaborative classrooms and tra-
ditional classrooms. The model was verified against
data acquired from evacuation experiments with 18
participants (Delcea et al., 2020).
Osaragi et al. constructed an agent model incorpo-
rating a procedure concerning typical evacuation be-
haviors such as initial reactions, searching for routes,
methods of evacuation, walking in a crowd, and activ-
ities while waiting. The model was employed to de-
velop efficient disaster prevention planning (Osaragi
et al., 2012).
Mas et al. developed a tsunami evacuation simula-
ICAART 2020 - 12th International Conference on Agents and Artificial Intelligence
18

tion model based on the Great East Japan Earthquake
to evaluate evacuation feasibility and shelter demand
analysis. The agent model consists of four layers:
evacuation decisions, shelter selections, route find-
ings, and speed adjustments (Mas et al., 2012).(Mas
et al., 2012).
D’Orazio et al. identified numerous unique evac-
uation behaviors (rules) through video analysis. They
then combined these rules into behavioral flowcharts
which were incorporated into the conduct of the
agents in their simulation models. Agent behaviors
were based on the intentional model, which represents
interactions among agents and between an agent and
the environment, and the social force model, which
represents the internal factors motivating the agents
(D’Orazio et al., 2014a; D’Orazio et al., 2014b;
Bernardini et al., 2014).
Most studies focused on fleeing behaviors during
evacuations, and a few studies mentioned the drop-
cover-hold on action (D’Orazio et al., 2014b; Bernar-
dini et al., 2019). In this study, by analyzing videos
captured during the Great East Japan Earthquake,
we investigated evacuees’ choice of decision between
performing the drop-cover-hold on action or fleeing
from a room.
3 VIDEO ANALYSIS
The video frame as shown in Fig. 1 was captured
in a hotel meeting room in Miyagino-ku, Sendai-shi,
Miyagi Prefecture, Japan, at 14:46 JST on Friday,
March 11, 2011
1
. The behavior of 48 people in the
room was recorded during the Great East Japan Earth-
quake, an earthquake off the coast of Japan with a
magnitude of 9.0. We carefully traced and summa-
rized the behavior of each person shown in Fig. 1b-d.
Fig. 2 depicts the initial positions of all 48 peo-
ple when the earthquake started. The room is square
with only one exit in the lower right corner. Initially,
all 48 people were sitting at tables in a square, with
everyone facing inwards. After the shaking from the
earthquake started, the following three behaviors were
observed in the video:
1. Stand and remain at their current position (Stand)
2. Exit and flee from the room (Flee)
3. Hide under the table, also known as “drop, cover,
and hold on” (Drop)
Fig. 1d depicts the temporal behavioral changes for
each of the 48 people for 99 s after the shaking started.
Although the entire video lasted 139 s, the final 40 s of
1
https://www.youtube.com/watch?v=tejlDDKeg8s
the video was dark owing to a power outage; hence,
analysis was difficult. In the chart, the gray, white,
and black circles indicate stand, flee, and drop behav-
iors, respectively, while × indicates behavior uniden-
tifiable from the video. Fig. 1c depicts the number of
times that people changed their behaviors. For exam-
ple, a person changing his/her behavior from sitting
to fleeing is indicated by a white circle at the time the
behavior changed. Fig. 1b shows a cumulative curve
of the number of behavioral changes in Fig. 1c. The
dotted, dashed, and solid lines indicate drop, flee, and
the sum of both behaviors, respectively. Figure 1a de-
picts the acceleration generated by the earthquake in
the North-South, East-West, and up-down directions
2
.
Two vertical dashed lines at 28 and 68 s indicate the
two peaks of shaking intensity.
Fig. 1d indicates the time when each person
changed their behavior. At 4 s, person 46 was the first
to take action (flee). Person 29 remained in his/her
chair for 75 s, and then changed his/her behavior to
stand. As shown in Fig. 1b, the cumulative num-
ber of people who displayed evacuation behaviors in
real disasters follows a convex curve, as compared
with the linear trend exhibited in evacuation drills (Gu
et al., 2016).
The final behavior of all 48 people at 99 s is shown
in Fig. 3. A white circle with a black number de-
notes an evacuee who selected the flee behavior, and
a black circle with a white number denotes an evacuee
who selected the drop behavior. A gray number is an
evacuee whose behavior is unknown. In summary, 26
evacuees selected flee and 12 evacuees selected drop.
Fig. 3 illustrates that most people close to the exit
selected flee, while those farther from the exit se-
lected drop, which is an intriguing behavior never re-
ported previously. The boundary between flee and
drop crosses the room diagonally, as if people within
a certain distance from the exit selected flee and the
others selected drop, thus leading to the following hy-
pothesis.
Hypothesis 1. The evacuation decision between flee
or drop is based on the distance from the exit.
However, a different hypothesis for the phenomenon
can be constructed. That is, although people make ar-
bitrary decisions between flee and drop, herd behavior
is the basic mechanism forming this diagonal spatial
pattern, as it is often observed in collective evacua-
tions.
Hypothesis 2. The herd behavior among people
causes the diagonal spatial pattern, even if each in-
dividual randomly chooses to flee or drop.
2
https://www.data.jma.go.jp/svd/eqev/data/kyoshin/
jishin/110311 tohokuchiho-taiheiyouoki/index.html
(Observation Point: Sendai-shi, Miyagino-ku, Gorin).
Validation of Evacuation Decision Model: An Attempt to Reproduce Human Evacuation Behaviors during the Great East Japan Earthquake
19
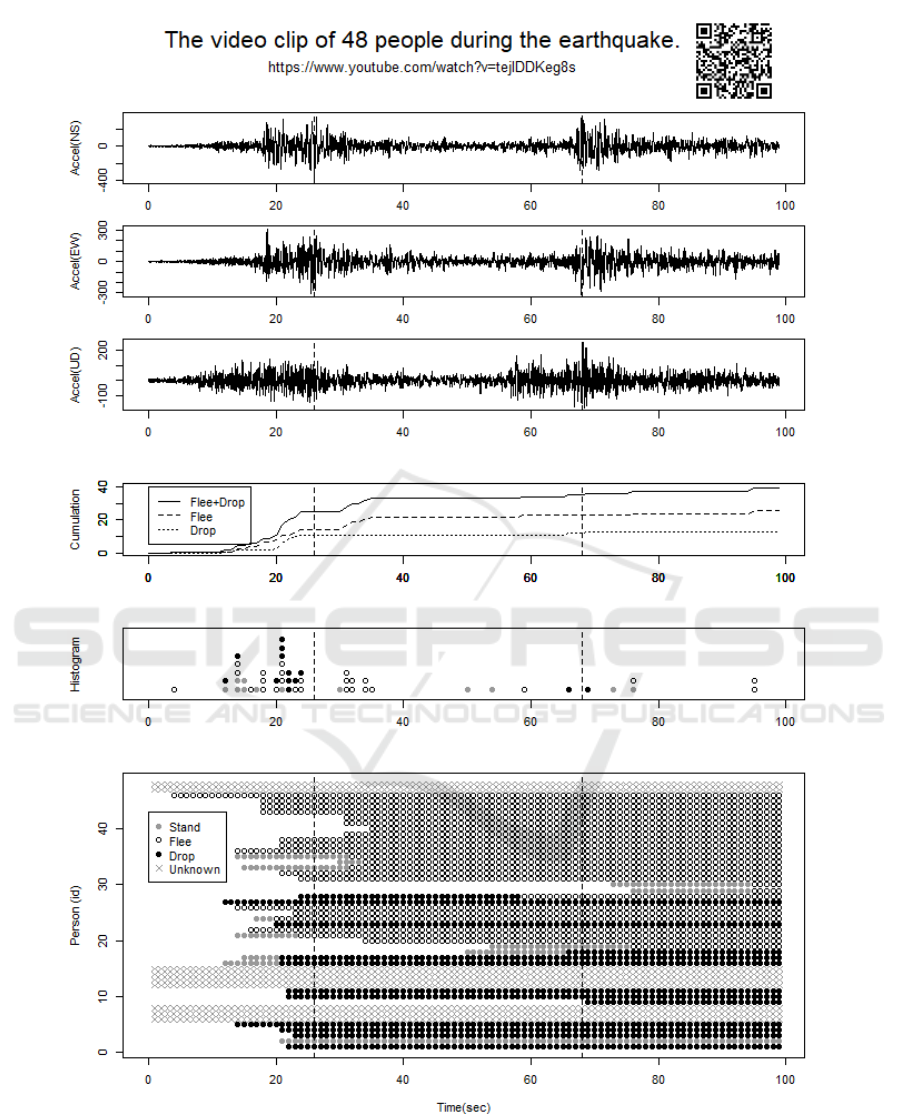
(a) Earthquake accelerations.
(b) Cumulative person behavioral changes.
(c) Behavorial change histogram.
(d) Per person behavioral history.
Figure 1: Temporal behavioral changes in 99 s, of 48 people in the video.
It is obvious that Hypothesis 1 can generate the diago-
nal spatial pattern. However, this hypothesis requires
higher level cognitive processes such as rules, scenar-
ios, or procedures to estimate the distance to the exit
and to judge whether this distance is above a certain
threshold. By contrast, Hypothesis 2 requires only
ICAART 2020 - 12th International Conference on Agents and Artificial Intelligence
20
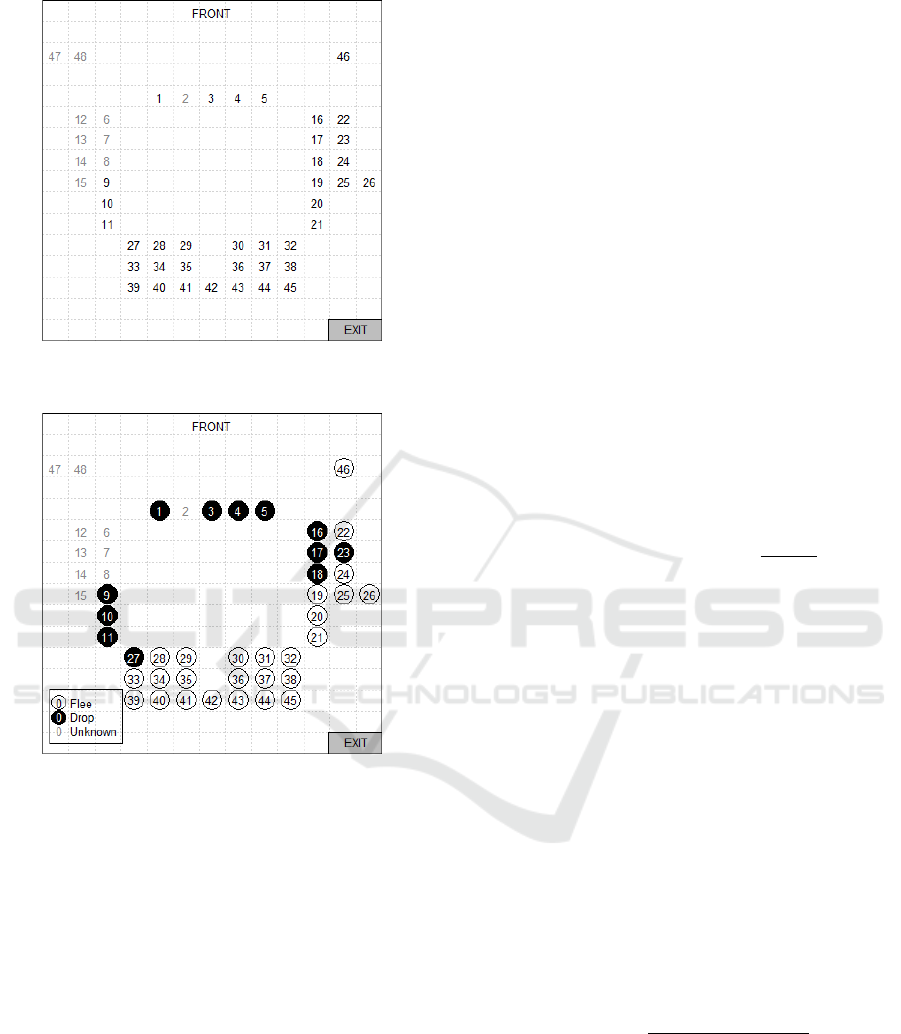
Figure 2: Initial location of the people in the video.
Figure 3: Selection of drop and flee at the end of the video.
lower-level cognitive processes, i.e., the herd behav-
ior, which is typical in many organisms.
In this study, we show that the evacuation deci-
sion model can represent human evacuations in a real
disaster situation by demonstrating that Hypothesis 2
holds using multiagent simulations, i.e., the simple
herd behavior is sufficient to produce the diagonal
spatial pattern generated by the flee and drop deci-
sions.
4 EVACUATION DECISION
MODEL
In this study, we adopted the evacuation decision
model (Tsurushima, 2019a; Tsurushima, 2019b) to
represent the herd behavior among evacuees during an
earthquake. The evacuation decision model is based
on the response threshold model in biology, which
represents the division of labor in eusocial organisms
(Bonabeau et al., 1996; Bonabeau et al., 1998). The
evacuation decision model has been used to reproduce
cognitive aggregation (Tsurushima, 2019a) and sym-
metry breaking in exit selection (Tsurushima, 2019b;
Tsurushima, 2019c) during evacuations.
In the evacuation decision model, the environment
has an objective risk value r, which refers to the sever-
ity of disaster threats. An agent i in the environment
acts as either a leader or a follower, depending on
his/her internal mental state X. The agent will act as a
leader if X = 1, allowing him/her to select his/her be-
havior, while a follower’s (X = 0) behavior is selected
by the behaviors of others. The value of X changes
with some probability during evacuations. Thus, an
agent sometimes acts as a leader and at other times a
follower.
The agent has a parameter θ
i
, called the response
threshold, which determines the degree to which the
agent participates in the evacuation. The values of θ
vary by agent. The probability P that an agent be-
comes a leader per unit time is
P
i
(X = 0 → X = 1) =
s
2
i
s
2
i
+ θ
2
i
, (1)
where s
i
is the local estimation in the stimulus of the
environment associated with agent i.
The probability that an agent becomes a follower
per unit time is
P
i
(X = 1 → X = 0) = ε, (2)
where ε is a constant probability that agents become
followers, given as a simulation parameter. The esti-
mation of the stimulus of agent i per unit time is given
by the following difference equation
s
i
(t + 1) = max{s
i
(t) +
ˆ
δ − α(1 − R)F, 0 }, (3)
where
ˆ
δ is an increase of the stimulus per unit time
ˆ
δ =
δ if r > 0
0 otherwise,
(4)
and α is a scale factor of the stimulus. R is the risk
perception function which is a function of the objec-
tive risk r:
R(r) =
1
1 + exp(−g(r − µ
i
))
, (5)
where g is the activation gain which determines the
shape of the sigmoid function. µ
i
is the risk perception
of agent i, which represents an individual’s sensitivity
to risk. The evacuation progress function i.e., the lo-
cal estimation of the evacuation progress of agent i
is
F(n) =
1 − n/N
max
n < N
max
0 otherwise,
(6)
Validation of Evacuation Decision Model: An Attempt to Reproduce Human Evacuation Behaviors during the Great East Japan Earthquake
21

where n is the number of agents in the vicinity, and
N
max
is the maximum possible number of agents in
the vicinity.
5 EARTHQUAKE EVACUATION
SIMULATION
This section presents the earthquake evacuation sim-
ulation in detail. The simulation configuration is sim-
ilar but not identical to the video depicted in Figure 1.
The aims of this simulation are to reproduce the con-
vex curve of cumulative evacuees from Fig. 1b and
the diagonal spatial pattern of Fig. 3. To represent
herd behavior, the evacuation decision model is incor-
porated into the agents; however, the agents have no
higher-level cognitive processes to determine whether
the distance to the exit exceeds a threshold. The sim-
ulation model was implemented using NetLogo 6.0.2
(Wilensky, 1999).
5.1 Configuration
In this study, 500 agents, A = {a
1
,a
2
,... ,a
500
}, were
randomly distributed in a square room (40×40 units),
with the lower left corner as the origin and the
exit at the lower right corner. Assuming simula-
tion time t = 1,. .., T , an agent a
i
∈ A has coordi-
nates x
i
(t),y
i
(t) ∈ R, a local estimation of the stim-
ulus s
i
(t) ∈ R, a mental state X
i
(t) ∈ {1, 0}, and an
action π
i
(t) ∈ {undecided, flee, drop}, where unde-
cided indicates that the agent has not determined an
action yet, flee implies that the agent has selected
Flee, and drop means that the agent has selected drop.
Furthermore, an agent has two parameters; the re-
sponse threshold θ
i
and the risk sensitivity µ
i
. Let
x
i
(1),y
i
(1) ∼ U (3,38), s
i
(1) = 0,X
i
(1) = 0,π
i
(1) =
undecided,θ
i
∼ U(0,100), and µ
i
∼ U(0,100) be the
initial values of the simulation, with the simulation
terminated at T = 270.
The vicinity of a
i
is defined as V
i
= {a
j
∈
A | ν(a
j
,a
i
)}, where ν : A
2
→ {true, false}, and ν
refers to the range of five units and 120
◦
towards the
direction of motion of a
i
.
It is noteworthy that n in Equation 6 will be n =
|{a
j
∈ V
i
| π
j
(t) = undecided}|, because both flee and
drop are considered as evacuation behaviors in our
simulation.
At each time step, an agent with π
i
(t) = flee moves
toward the exit (G
x
, G
y
) by ∆x, ∆y, as determined by
solving Problem 1.
Algorithm 1: Leader.
if π
i
(t) = undecided then
τ ∼ U(0,1)
if τ ≤ 0.5 then
π
i
(t) ⇐ drop
else
π
i
(t) ⇐ flee
end if
end if
if π
i
(t) = flee then
Solve Problem 1 and determine ∆x, ∆y
x
i
(t) ⇐ x
i
(t) + ∆x; y
i
(t) ⇐ y
i
(t) + ∆y
end if
Algorithm 2: Follower.
n
d
⇐ |{a
j
∈ V
i
| π
j
(t) = drop}|
n
e
⇐ |{a
j
∈ V
i
| π
j
(t) = flee}|
n
u
⇐ |{a
j
∈ V
i
| π
j
(t) = undecided}|
if n
d
> n
e
and n
d
> n
u
then
π
i
(t) ⇐ drop
else if n
e
> n
d
and n
e
> n
u
then
π
i
(t) ⇐ flee
end if
if π
i
(t) = flee then
Solve Problem 1 and determine ∆x, ∆y
x
i
(t) ⇐ x
i
(t) + ∆x; y
i
(t) ⇐ y
i
(t) + ∆y
end if
Problem 1.
min (x
i
(t) + ∆x − G
x
)
2
+ (y
i
(t) + ∆y − G
y
)
2
(7)
s.t. ∆x
2
+ ∆y
2
= 1 (8)
An agent with π
i
(t) 6= flee remains in the same posi-
tion, i.e., ∆x = 0 and ∆y = 0.
When X = 1, a
i
acts as a leader by executing Al-
gorithm 1 and executes Algorithm 2 as a follower if
X = 0. The followers only mimic the most popular
behavior in their vicinity. Only the leaders intention-
ally determine their behaviors, albeit a random choice
between flee and drop.
The room has an objective risk that starts at r(1) =
0 and increments by one for each time step up to the
maximum value of r(t) = 100. The local estimation of
the stimulus of a
i
starts at s
i
(1) = 0 and increments by
δ at each time step as F ≈ 0 in the initial stages of the
simulation. Thus, P
i
(X = 0 → X = 1) increases grad-
ually depending on θ
i
, thus resulting in the emergence
of leader agents. Subsequently, followers appear and
herding spreads among the agents.
Finally, the overall simulation procedure is shown
in Algorithm 3. The following parameters were used:
α = 1.2, δ = 0.5, ε = 0.2, g = 1.0, and N
max
= 10.
ICAART 2020 - 12th International Conference on Agents and Artificial Intelligence
22

Algorithm 3: Simulation.
Initialization
for t = 1 to T do
r ⇐ min{r + 1, 100}
for all a
i
∈ A do
Calculate R {Equation 5}
Calculate F {Equation 6}
Calculate s
i
{Equation 3}
τ ∼ U(0, 1)
if τ < P(X = 1 → X = 0) then
X
i
⇐ 0
else
τ ∼ U(0,1)
if τ < P(X = 0 → X = 1) then
X
i
⇐ 1
end if
end if
if X
i
= 0 then
Execute Algorithm 2 {Follower}
else if X
i
= 1 then
Execute Algorithm 1 {Leader}
end if
if (x
i
(t) − G
x
)
2
+ (y
i
(t) − G
y
)
2
< 1 then
A ⇐ A \ a
i
end if
end for
end for
5.2 Result 1
In this section, results of the simulation described in
Section 5.1 are presented.
Fig. 4 depicts the cumulative curves of evac-
uees who performed evacuation actions per simula-
tion time. The solid line in the chart is obtained by
the function ϕ(t):
ϕ(t) = ϕ(t − 1) +
∑
a
i
∈A
γ
i
(t), (9)
where
γ
i
(t) =
1 t = min{z | π
i
(z) 6= undecided}
0 otherwise,
(10)
and ϕ(0) = 0.
The function ϕ(t) illustrates the temporal change
in the cumulative number of evacuees who performed
either the flee or drop action. Similar to Fig. 1b, the
cumulative curves in Fig. 4 are convex, which is typi-
cal for actual disaster evacuations (Gu et al., 2016).
Fig. 5 illustrates the location of the remaining
agents in the room at t = T . A total of 211 agents
remained in the room, and all of them were with
π
i
(T ) = drop. Interestingly, all of the remaining
agents were located in the far side of the room from
the exit, in a triangular shape with a diagonal bound-
ary across the room. As the side close to the exit was
empty, it could be inferred that the agents farther from
the exit performed the drop action and those closer
performed the flee action. This result is consistent
with the observation of Fig. 3.
If we divide the room into two spaces with a di-
agonal line y = x, and let the number of agents in the
upper left space be N
u
= |{a
i
| y
i
(T ) ≥ x
i
(T )}| and
the lower right space be N
l
= |{a
i
| y
i
(T ) < x
i
(T )}|,
we have N
u
= 183 and N
l
= 28, and the difference
N
d
= N
u
− N
l
= 155.
Here, we adopted entropy to evaluate the simu-
lation results quantitatively (Crociani et al., 2016).
Fig. 6 depicts each agent’s action at the end of the
simulation at their initial location t = 1. The black and
white circles represent π
i
(T ) = drop and π
i
(T ) = flee,
respectively. As shown in Fig. 6, with a few excep-
tions, most agents initially located in the upper left
space selected drop and those in the lower right space
selected flee. To evaluate whether the decision be-
tween flee and drop is divided by the diagonal line
y = x, entropy H is introduced.
H = −r
g
log
2
(r
g
) − r
b
log
2
(r
b
), (11)
where
r
g
= L
g
/(L
g
+ L
b
) (12)
r
b
= L
b
/(L
g
+ L
b
), (13)
and
L
g
=
∑
{a
i
|y
i
(1)≥x
i
(1)∧π
i
(T )=drop}
l
i
+ (14)
∑
{a
j
|y
j
(1)<x
j
(1)∧π
j
(T )=flee}
l
j
(15)
L
b
=
∑
{a
i
|y
i
(1)≤x
i
(1)∧π
i
(T )=drop}
l
i
+ (16)
∑
{a
j
|y
j
(1)>x
j
(1)∧π
j
(T )=flee}
l
j
, (17)
where
l
i
=
s
2
x
i
(1) − y
i
(1)
2
2
(18)
and l
j
is the minimum distance between the initial
position of a
i
and the diagonal y = x. L
g
is the
sum l
i
of the shortest distances to the diagonal from
the initial position of a
i
in the upper left space with
π
i
(T ) = drop and an agent in the lower right space
with π
i
(T ) = flee. Conversely, L
b
is the sum of l
i
Validation of Evacuation Decision Model: An Attempt to Reproduce Human Evacuation Behaviors during the Great East Japan Earthquake
23
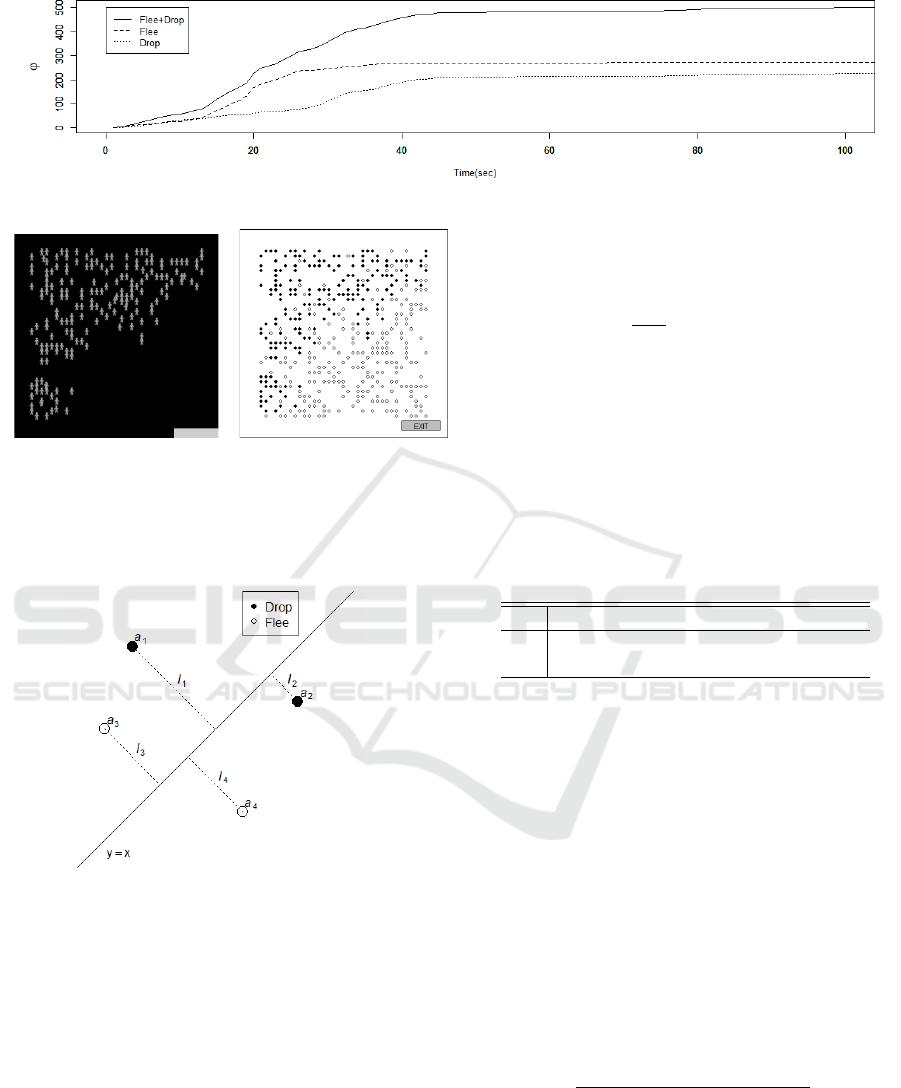
Figure 4: Cumulative number of evacuees over the simulation time.
Figure 5: Distribution of re-
maining agents in the room
at the end of the simulation.
Figure 6: Initial locations
and the decisions between
flee and drop. Black cir-
cles refers to π
i
(T ) = drop,
and white circles refers to
π
i
(T ) = f lee.
Figure 7: Calculations of L
g
and L
b
. In this case, L
g
=
l
1
+ l
4
and L
b
= l
2
+ l
3
.
of the shortest distance to the diagonal from the ini-
tial position of agent a
i
in the upper left space with
π
i
(T ) = flee and an agent in the lower right space
with π
i
(T ) = drop. For example, in the case of Fig. 7,
L
g
= l
1
+ l
4
and L
b
= l
2
+ l
3
.
With a smaller H, flee and drop behavior are de-
lineated by the y = x diagonal, whereas the behavior
becomes intermingled if H is close to 1.0. The en-
tropy in Fig. 6 is H = 0.48.
5.3 Result 2
A total of 150 simulations were conducted and the
results are presented in this section. Fig. 8 shows the
mean value, Φ(t) = ϕ(t), of the cumulative number of
evacuees over 150 simulations. The curves in Fig. 8
are convex and smoother than those in Fig. 4.
The histograms of N
d
and H are shown in Fig. 9
and Fig. 10, respectively. N
d
is the difference in the
number of agents in the spaces, separated by the di-
agonal y = x and H is the entropy of the evacuation
decisions. The mean, standard deviation (σ), and min-
imum and maximum values of N
d
and H are summa-
rized in Table 1.
Table 1: Statistics of N
d
and H over 150 simulations.
min mean σ max
N
d
-89.0 95.2 48.8 177
H 0.35 0.63 0.13 1.00
The kernel density distribution given by coordi-
nates x
i
(T ), y
i
(T ) of the agents remaining in the room
at t = T over 150 simulations is shown in Fig. 11. Lo-
cations farther from the exit exhibit a higher kernel
density, yielding a correlation between the distance
from the exit and the number of the remaining agents.
6 ANALYSIS
In this section, we analyze the relationship between
the final agent decisions and the agent parameters us-
ing logistic regression analysis. The objective vari-
able is the final decision π
i
(T ) by assuming drop = 1
and flee = 0, and the explanatory variables are the dis-
tance between the initial agent location and the exit
L
i
=
q
(x
i
(1) − G
x
)
2
+ (y
i
(1) − G
y
)
2
, (19)
response threshold θ
i
, and risk sensitivity µ
i
.
A total of 200 and 500 training and test samples,
respectively, were randomly selected from 75,000
samples (500 agents × 150 simulations). Large
amounts of training data reduce both the p-value and
ICAART 2020 - 12th International Conference on Agents and Artificial Intelligence
24
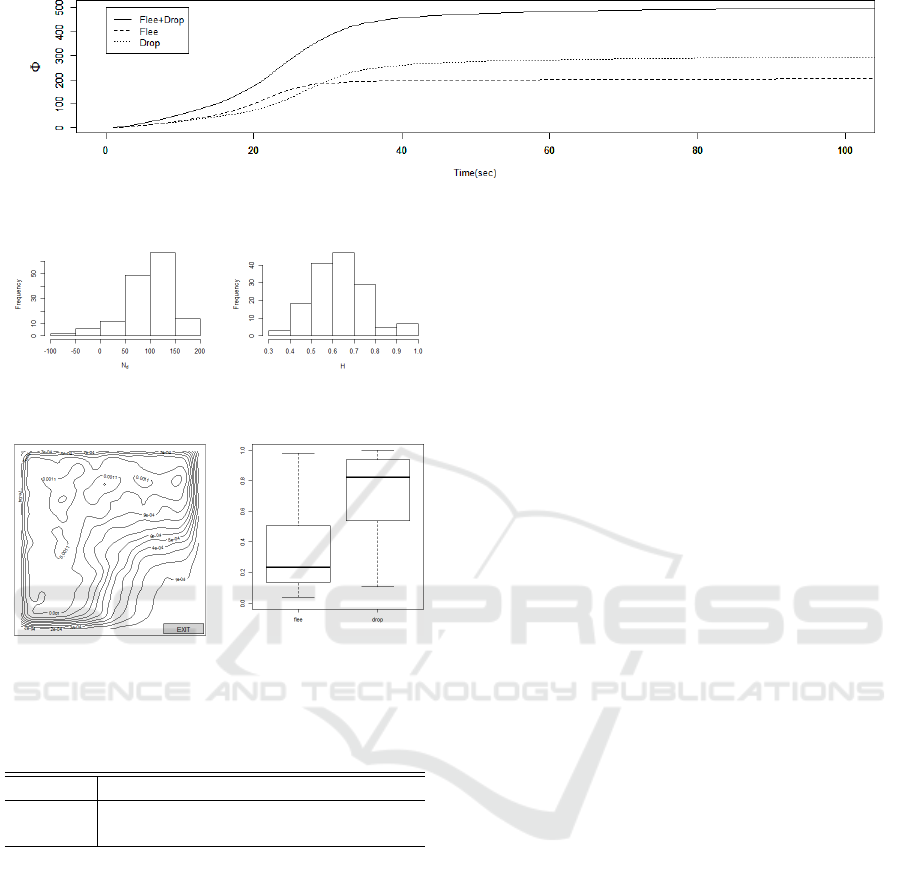
Figure 8: Mean values of ϕ(t), Φ(t), over 150 simulations.
Figure 9: Histogram of
N
d
.
Figure 10: Histogram of
H.
Figure 11: Kernel density
of x
i
(T ) and y
i
(T ) over the
room.
Figure 12: Logit model
discriminating between
drop and flee.
Table 2: Results of the logistic analysis. Coefficients and
P-values.
Intercept L
i
θ
i
µ
i
coeff -3.4486 0.0033 0.0115 0.0055
P-values 0.0 0.0 0.0796 0.3532
the reliability of the analysis; therefore, we set the
amount of training data to 200 samples. The results
of the logistic regression analysis in terms of the co-
efficients and p-values are shown in Table 2.
From Table 2, the primary factor in the drop/flee
decision is the distance to the exit (p < 0.01). This
implies that the response threshold θ
i
may have some
effect (p < 0.1), while the risk sensitivity µ
i
may not
have an effect on the decision (p > 1).
The box plot in Fig. 12 shows the discrimination
results of 500 test data samples by the logit model
from Table 2 developed from the logistic regression
analysis. It indicates that the logit model can discrim-
inate between drop and flee decisions for unknown
data.
7 DISCUSSION AND
CONCLUSION
By analyzing a video captured during the Great East
Japan Earthquake, we discovered that the decision be-
tween drop and flee was influenced by the distance to
the exit, a finding that was not reported previously.
Subsequently, we constructed two hypotheses for the
origin of this behavior and demonstrated that the spa-
tial pattern of the decisions could be reproduced. Fur-
thermore, Hypothesis 2 holds based on simulations
using the evacuation decision model, which repre-
sents human herd behavior during evacuations.
Our simulation results in Figs. 5 and 6 show that
the decision between drop and flee is determined by
the distance from the exit. However, Figs. 9 and 10
indicate that the results from the simulation vary, i.e.,
the results described in Section 5.2 are not always ob-
tained. Contrary to our expectations, some simula-
tions had N
d
= −89, signifying that more agents re-
mained in the area closer to the exit, and some simu-
lations resulted in H ≈ 1.00, which implies a combi-
nation of drop and flee behaviors.
Although we concede that exceptional cases like
these occur, it is clear that the evacuation decision
model is sufficient to produce results that are similar
to our findings from the video analysis of the Great
East Japan Earthquake, albeit at a slightly lower fre-
quency. The kernel density of the results in Fig. 11
agrees well with the statement above. Furthermore,
the results of the logistic regression analysis revealed
that the primary factor of deciding between drop and
flee for individual agents was the distance between
their initial location and the exit. Nonetheless, Hy-
pothesis 2 suggests that each individual does not have
to consider this distance to determine his/her behav-
ior; a simple herd behavior is sufficient to produce the
diagonal spatial pattern.
The most remarkable aspect of this analysis was
that the results were produced by agents who have no
higher-level cognitive processes. The agents in our
model performed only either imitations or random se-
lections, both of which are unintelligent behaviors.
Validation of Evacuation Decision Model: An Attempt to Reproduce Human Evacuation Behaviors during the Great East Japan Earthquake
25

Neither distance estimation nor thresholds are neces-
sary to reproduce the behaviors in the video. From
the discussion thus far, we conclude that Hypothesis 2
holds.
The fact that Figs. 4 and 8 are consistent with
Fig. 1b and that the cumulative curve of evacuees is
convex in real evacuation situations (Gu et al., 2016)
provides additional support that our simulations us-
ing the evacuation decision model can yield realistic
results.
We do not deny Hypothesis 1; rather, we consider
it natural for people close to the exit to select the flee
action intentionally. In reality, we believe that both
Hypothesis 1 and Hypothesis 2 hold simultaneously.
A real evacuation process will be the complex com-
bination of higher-level cognitive processes such as
decision making and lower-level cognitive processes
such as herd behavior. Some researchers have also
pointed out the importance of individuals’ emotional
responses in crowd evacuation processes (Kefalas and
Sakellariou, 2017).
This study demonstrated that the evacuation de-
cision model could reproduce real human evacuation
behaviors that were recorded in the video of the Great
East Japan Earthquake and could be used to ana-
lyze human herd behaviors during earthquakes. Tsu-
rushima (Tsurushima, 2019b; Tsurushima, 2019c)
demonstrated that a simple herd behavior could re-
produce symmetry breaking in exit selection using the
evacuation decision model. Furthermore, the analysis
presented herein revealed the significance of herd be-
havior in collective evacuations. Hence, the evacua-
tion decision model is advantageous for the quantita-
tive analysis of herd behavior effects in human evac-
uations.
Finally, some potential methodological weak-
nesses should be considered. First, the video clip an-
alyzed in this study is the only instance where we can
find the specific evacuation behavior discussed in this
paper. We do not know the universality of this behav-
ior in other evacuation scenarios. There is also some
possibility of errors occurring in the video analysis
phase as it was controlled manually. Second, most of
the parameters adopted in the simulation model were
either experimentally or arbitrarily selected. Sensitiv-
ity analysis of these parameters is desirable to ensure
more accurate future results. Third, the simulation
was not configured identically with the actual events
captured in the video. It would be interesting to ex-
periment with a more realistic design. However, such
considerations are reserved for future work.
ACKNOWLEDGEMENTS
We gratefully acknowledge the help and construc-
tive comments provided by Yoshikazu Shinoda and
Kei Marukawa. We would like to thank Editage
(www.editage.com) for English language editing.
REFERENCES
Altshuler, E., Ramos, O., Nu
˜
nez, Y., Ferna
´
ndez, J., Batista-
Leyva, A. J., and Noda, C. (2005). Symmetry
breaking in escaping ants. The American Naturalist,
166(6):643–649.
Bernardini, G., D’Orazio, M., Quagliarini, E., and Spalazzi,
L. (2014). An agent-based model for earthquake
pedestrians’ evacuation simulation in urban scenarios.
Transportation Research Procedia, 2:255 – 263. The
Conference on Pedestrian and Evacuation Dynamics
2014 (PED 2014), 22-24 October 2014, Delft, The
Netherlands.
Bernardini, G., Lovreglio, R., and Quagliarini, E. (2019).
Proposing behavior-oriented strategies for earthquake
emergency evacuation: A behavioral data analysis
from new zealand, italy and japan. Safety Science,
116:295 – 309.
Bonabeau, E., Theraulaz, G., and Deneubourg, J.-L. (1996).
Quantitative study of the fixed threshold model for
the regulation of division of labour in insect societies.
Proceedings of The Royal Society B, 263(1376):1565–
1569.
Bonabeau, E., Theraulaz, G., and Deneubourg, J.-L. (1998).
Fixed response thresholds and the regulation of divi-
sion of labor in insect societies. Bulletin of Mathemat-
ical Biology, 60:753–807.
Crociani, L., Vizzari, G., Yanagisawa, D., Nishinari, K., and
Bandini, S. (2016). Route choice in pedestrian simu-
lation: Design and evaluation of a model based on em-
pirical observations. Intelligenza Artificiale, 10:163–
182.
Cutter, S. and Barnes, K. (1982). Evacuation behavior and
Three Mile island. Disasters, 6(2):116–124.
Delcea, C., Cotfas, L.-A., Craciun, L., and Molanescu,
A. G. (2020). An agent-based modeling approach to
collaborative classrooms evacuation process. Safety
Science, 121:414 – 429.
D’Orazio, M., Quagliarini, E., Bernardini, G., and Spalazzi,
L. (2014a). EPES - earthquake pedestrians’ evac-
uation simulator: A tool for predicting earthquake
pedestrians’ evacuation in urban outdoor scenarios.
International Journal of Disaster Risk Reduction,
10:153 – 177.
D’Orazio, M., Spalazzi, L., Quagliarini, E., and Bernar-
dini, G. (2014b). Agent-based model for earthquake
pedestrians’ evacuation in urban outdoor scenarios:
Behavioural patterns definition and evacuation paths
choice. Safety Science, 62:450 – 465.
Drury, J., Brown, R., Gonz
´
alez, R., and Miranda, D. (2015).
Emergent social identity and observing social support
ICAART 2020 - 12th International Conference on Agents and Artificial Intelligence
26

predict social support provided by survivors in a disas-
ter: Solidarity in the 2010 chile earthquake. European
Journal of Social Psychology, 46(2):209–223.
Elliott, D. and Smith, D. (1993). Football stadia disasters in
the United Kingdom: learning from tragedy? Indus-
trial and Environmental Crisis Quarterly, 7(3):205–
229.
Garcimart
´
ın, A., Zuriguel, I., Pastor, J., Mart
´
ın-G
´
omez,
C., and Parisi, D. (2014). Experimental evidence of
the “faster is slower” effect. Transportation Research
Procedia, 2:760 – 767. The Conference on Pedestrian
and Evacuation Dynamics 2014 (PED 2014), 22-24
October 2014, Delft, The Netherlands.
Gu, Z., Liu, Z., Shiwakoti, N., and Yang, M. (2016). Video-
based analysis of school students’ emergency evacua-
tion behavior in earthquakes. International Journal of
Disaster Risk Reduction, 18:1 – 11.
Hori, M. (2018). Introduction to Computational Earth-
quake Engineering. WORLD SCIENTIFIC (EU-
ROPE), 3rd edition.
Ji, Q., Xin, C., Tang, S., and Huang, J. (2017). Symmetry
associated with symmetry break: revisiting ants and
humans escaping from multiple-exit rooms. Physica
A.
Kefalas, P. and Sakellariou, I. (2017). The invalidity of val-
idating emotional multi-agent systems simulations. In
Proceedings of the 8th Balkan Conference in Infor-
matics, BCI ’17, pages 8:1–8:8, New York, NY, USA.
ACM.
Kimura, R., Hayashi, H., Tatsuki, S., and Tamura, K.
(2006). Behavioural and psychological reconstruction
process of victims in the 2004 mid-niigata prefecture
earthquake. In Proceedings of the 8th US National
Conference on Earthquake Engineering, pages 1–9.
Li, S., Yu, X., Zhang, Y., and Zhai, C. (2018). A numer-
ical simulation strategy on occupant evacuation be-
haviors and casualty prediction in a building during
earthquakes. Physica A: Statistical Mechanics and its
Applications, 490:1238 – 1250.
Mas, E., Suppasri, A., Imamura, F., and Koshimura, S.
(2012). Agent-based simulation of the 2011 great east
japan earthquake/tsunami evacuation: An integrated
model of tsunami inundation and evacuation. Journal
of Natural Disaster Science, 34(1):41–57.
Morita, T., Tsukada, S., and Yuzawa, A. (2015). Analysis
of evacuation behaviors in different areas before and
after the great east japan earthquake. In Fifth Inter-
national Conference on Geotechnique, Construction
Materials and Environment.
Osaragi, T., Morisawa, T., and Oki, T. (2012). Simula-
tion model of evacuation behavior following a large-
scale earthquake that takes into account various at-
tributes of residents and transient occupants. In Wei-
dmann, U., Kirsch, U., and Schreckenberg, M., ed-
itors, Pedestrian and Evacuation Dynamics, pages
469–484. Springer.
Saloma, C., Perez, G. J., Tapang, G., Lim, M., and
Palmes-Saloma, C. (2003). Self-organized queuing
and scale-free behavior in real escape panic. PNAS,
100(21):11947–11952.
Schmidt, S. and Galea, E., editors (2013). Behaviour - Se-
curity - Cluture (BeSeCu): Human behaviour in emer-
gencies and disasters: A cross-cultural investigation.
Pabst Science Publishers.
Shiwakoti, N. and Sarvi, M. (2013). Understanding pedes-
trian crowd panic: a review on model organisms ap-
proach. Journal of Transport Geography, 26:12 – 17.
Tsurushima, A. (2019a). Modeling herd behavior caused
by evacuation decision making using response thresh-
old. In Davidsson, P. and Verhagen, H., editors,
Multi-Agent-Based Simulation XIX. MABS2018. Lec-
ture Notes in Computer Science, vol 11463, pages
138–152. Springer.
Tsurushima, A. (2019b). Reproducing symmetry breaking
in exit choice under emergency evacuation situation
using response threshold model. In Proceedings of
the 11th International Conference on Agents and Arti-
ficial Intelligence - Volume 1: ICAART,, pages 31–41.
INSTICC, SciTePress.
Tsurushima, A. (2019c). Symmetry breaking in evacua-
tion exit choice: Impacts of cognitive bias and phys-
ical factor on evacuation decision. In van den Herik,
J., Rocha, A. P., and Steels, L., editors, Agents and
Artificial intelligence 11th International Conference.
ICAART2019. LNAI 11978, pages 293–316. Springer.
Wilensky, U. (1999). NetLogo. Center for Connected
Learning and Computer-Based Modeling, Northwest-
ern University, Evanston, IL.
Yang, X., Wu, Z., and Li, Y. (2011). Difference be-
tween real-life escape panic and mimic exercises in
simulated situation with implications to the statistical
physics models of emergency evacuation: The 2008
wenchuan earthquake. Physica A: Statistical Mechan-
ics and its Applications, 390(12):2375 – 2380.
Validation of Evacuation Decision Model: An Attempt to Reproduce Human Evacuation Behaviors during the Great East Japan Earthquake
27
