
LilyPads: Exploring the Spatiotemporal Dissemination
of Historical Newspaper Articles
Max Franke
1
, Markus John
1
, Moritz Knabben
1
, Jana Keck
2
, Tanja Blascheck
1
and Steffen Koch
1
1
Institute for Visualization and Interactive Systems, University of Stuttgart, Germany
2
Institute of Literary Studies, University of Stuttgart, Germany
Keywords:
Digital Humanities Visualization, Spatiotemporal Data, Historical Newspapers.
Abstract:
Today, libraries provide digitized collections of historical newspapers, which researchers in the humanities
seek to analyze. An important objective of this work is to enable researchers to overview and analyze the
textual, temporal and geographical dissemination of an event expressed in document corpora of interest. For
this, we propose LilyPads, which permits researchers to analyze such corpora using a novel, map-inset-based
approach. In contrast to previous work, LilyPads is centered around one main view, which integrates key
aspects of the visualized data, thereby facilitating an explorative approach to finding relationships in data.
From LilyPads’ overview, researchers can select subsets of data as well as individual documents interactively,
which supports detailed analysis of the corpus, combining close and distant reading methods. We show the
applicability of LilyPads by demonstrating its use in a real-world analysis scenario.
1 INTRODUCTION
The availability of digitized collections of historical
documents has encouraged socio-historical research
on both national and international levels, for which
computational methods offer new analysis possibili-
ties. This equips researchers in the humanities (RH)
with tools and methods to address research questions
in a new way to re-evaluate, develop, and test hy-
potheses. Interactive visualization facilitates such a
methodology by supporting exploration; drill-down
tasks; and the exchange of ideas, hypotheses, and re-
sults with colleagues and other researchers.
Our project partners from the Oceanic Exchan-
ges (OcEx, 2017) project are interested in gaining
new insights into information dissemination from
large sets of digitized historical newspaper articles
published during major migration waves 1840–1914.
They seek to identify how specific topics shift over
time, where shifts on a global level are often lost dur-
ing a close analysis of specific regions. Following the
innovation of the transatlantic telegraph cable in the
late 1850s, the speed of news circulation increased.
Researchers are especially interested in the geograph-
ical and temporal dissemination of news in this pe-
riod, as well as many other, related, aspects.
The compilation and curation of case studies is
a prerequisite to work on specific research questions
in this context. A case study is a curated collec-
tion of historical newspaper articles targeted at one
specific historical event or topic, which had a high
amount of news coverage and international dissemi-
nation. Such case studies typically contain hundreds
to the lower thousands of newspaper articles. Inter-
active exploration methods and drill-down options to
trace back patterns to the digitized articles and the
online archives, combining close and distant read-
ing approaches (J
¨
anicke et al., 2015; Moretti, 2005),
are essential for the exploration of such article sets.
Close reading describes working with source texts di-
rectly, while distant reading approaches represent one
or more texts in an abstract, aggregated fashion.
The RH have compiled multiple historical case
studies; for instance, one case study covers news re-
ports on a propaganda tour by Hungarian revolution-
ary Lajos Kossuth in 1851–1852. Other case studies
focus on the eruption of the Krakatoa volcano in 1883,
the sinking of the USS Maine during the Spanish-
American War in 1898, or the murder of Finnish gen-
eral governor Bobrikoff in 1904.
We present LilyPads as an approach supporting
researchers in analyzing such case studies. LilyPads
is an interactive visual approach that places the data—
the summarized articles themselves—in the view’s
center, linking it closely to spatial and temporal as-
pects. When talking about a closely-integrated visu-
Franke, M., John, M., Knabben, M., Keck, J., Blascheck, T. and Koch, S.
LilyPads: Exploring the Spatiotemporal Dissemination of Historical Newspaper Articles.
DOI: 10.5220/0008871400170028
In Proceedings of the 15th International Joint Conference on Computer Vision, Imaging and Computer Graphics Theory and Applications (VISIGRAPP 2020) - Volume 3: IVAPP, pages 17-28
ISBN: 978-989-758-402-2; ISSN: 2184-4321
Copyright
c
2022 by SCITEPRESS – Science and Technology Publications, Lda. All rights reserved
17

alization, we refer to the specific components, which
visualize different aspects of the data and are seam-
lessly interconnected to identify the relations between
those components. This setup enables researchers to
quickly gain a first impression of the data; as well as
to explore, highlight, and understand the data with re-
gard to space, time, and content. To demonstrate RH
can use our approach, we apply it to two historical
case studies our project partners provided.
The contributions of this work are the follow-
ing: (1) We present a novel, integrated interactive
visualization approach for exploring historical news
datasets from a semantically relevant geographical
perspective; with reference to spatial, temporal, and
content characteristics; and with possibilities to drill
down into subsets by constraining these characteris-
tics. (2) We derive requirements from a set of do-
main-specific tasks and describe their effect on our
design decisions and the technical implementation.
(3) We demonstrate the applicability of LilyPads by
describing an exploratory analysis on a dataset of his-
torical news articles, which raises and, subsequently,
answers questions relevant to our domain experts.
2 RELATED WORK
Our work is related to visualization approaches that
analyze spatiotemporal dissemination of text collec-
tions with an emphasis on both content and meta-
data. By extending visualizations with suitable inter-
action techniques, our objective is to ensure a seam-
less switching between close and distant reading tech-
niques. We focus on visualization and interaction
techniques that suggest similar directions. We fur-
ther discuss works that deal with spatiotemporal doc-
ument analysis. Finally, we point out visualization
approaches that support RH in solving subtasks simi-
lar to LilyPads, or apply comparable visual methods.
2.1 Visualization Techniques
With LilyPads, we mainly focus on an integrated vi-
sualization, combining several approaches that have
already been proposed. We present these approaches
and explain how our work distinguishes itself by em-
phasizing our improvements to existing techniques.
We center the visualization approach proposed in
LilyPads around the contents of documents by show-
ing a word cloud, in which the most frequent words
from all documents are shown. Word or tag clouds
are an established technique, which is described in
detail by Vuillemot et al. (2009) or by Heimerl et al.
(2014). While we use an integrated visualization to
display additional information next to our word cloud,
others have extended the concept of word clouds ac-
cordingly; for instance, while Lee et al. (2010) depict
temporal development of term use in SparkClouds,
Nguyen and Schumann (2010); Nguyen et al. (2011)
show additional spatiotemporal data, and Collins et al.
(2009) and John et al. (2018) visualize multiple texts
at once. The effectiveness of word clouds has been
analyzed in depth, for example, by Rivadeneira et al.
(2007), Hearst and Rosner (2008), and Alexander
et al. (2018). While these researchers argue against
a general suitability of word clouds, they agree that
word clouds are useful for visualizing trends and
forming gists of one or multiple texts.
LilyPads uses radial histograms for showing tem-
poral distribution of data points around a map in-
set. Approaches like Time-ray Maps (Sheidin et al.,
2017), Ring Maps (Huang et al., 2008), or the work
by Zhou et al. (2018) use similar techniques. To si-
multaneously encode a direction and a count into one
element, we also use a radial bar chart around the
word cloud. To encode direction, Andrienko et al.
(2017) propose histogram-like glyphs, but do not vi-
sualize additional information within those glyphs.
Similarly, Drocourt et al. (2011) use angle to rep-
resent points along the coast of Greenland. Whis-
per (Cao et al., 2012) uses a radial layout, encoding
the latitude of data points into the angle. This ap-
proach solves a similar problem of visualizing and ex-
ploring the spatiotemporal dissemination of informa-
tion, namely Twitter messages. In contrast to Whis-
per, LilyPads enables researchers to customize the
point of view, and visualizes spatial distances.
We display clusters of publication locations within
map insets, which are similar to the map insets used
by Brodkorb et al. (2016). We place those insets to-
wards the direction of the locations using an origin
point, comparable to the work of Ghani et al. (2011).
While their approaches place the insets at the map
border, we additionally encode the distance to the lo-
cations in the inset position. More recently, Lekschas
et al. (2020) have approached the problem of data
with heterogeneous density by using insets. In con-
trast to LilyPads, which uses the space between insets
to visualize additional data, their approach shows an
overview of the data space between the insets.
VAiRoma (Cho et al., 2016) offers multiple co-
ordinated views (MCVs), which facilitate exploring
extracted places and topics from Wikipedia articles
with historical content. Their topic view is based
on a sunburst visualization (Stasko and Zhang, 2000)
and represents the hierarchical distribution of topics.
Our approach differs insofar as we offer an integrated
approach—as opposed to MCVs—which works di-
IVAPP 2020 - 11th International Conference on Information Visualization Theory and Applications
18

rectly with digitized historical documents, the pri-
mary archival material, instead of secondary material.
VisGets (D
¨
ork et al., 2008) visualizes spatiotem-
poral data as well as tags in coordinated views.
Fuchs and Schumann (2004), Thakur and Hanson
(2010), and Tominski et al. (2005) introduce fur-
ther approaches for depicting spatiotemporal data.
Their approaches are centered around a map and
are most efficient for spatially dense datasets. Lily-
Pads, on the contrary, is designed for sparse datasets.
While these approaches visualize quantitative, time-
dependent data, our objective is to visualize the sum-
marized content of text documents alongside the spa-
tiotemporal metadata. The discussed approaches can
be divided into coordinated and integrated view tech-
niques. While VAiRoma (Cho et al., 2016) and Vis-
Gets (D
¨
ork et al., 2008) use MCVs, most of the ap-
proaches are centered around an integrated view, list-
ing this feature as a contribution (Sheidin et al., 2017;
Cao et al., 2012; Drocourt et al., 2011; Ghani et al.,
2011; Brodkorb et al., 2016).
Whereas some techniques (Sheidin et al., 2017;
Drocourt et al., 2011; Nguyen and Schumann, 2010;
Nguyen et al., 2011) show geographic and textual in-
formation statically, interactive techniques offer more
potential for the exploration of datasets. Therefore,
LilyPads uses interaction techniques such as brushing
and linking, and filtering and drill-down. Examples
for interactive approaches of such techniques are VAi-
Roma (Cho et al., 2016), VisGets (D
¨
ork et al., 2008)
and Trading Consequences (Hinrichs et al., 2015).
For an additional overview of the dataset and the
temporal distribution, we integrate a document mini-
map, closely resembling the pixel-based approach de-
scribed by Oelke et al. (2011). We employ opacity
boosting for brushing and linking, which can be con-
sidered a special case of color boosting.
2.2 Spatiotemporal Text Analysis
The visual analysis of spatiotemporal text data has
been researched in different domains, such as patent
analysis (Koch et al., 2011), Digital Humanities (Hin-
richs et al., 2015), micro-blogging (Cao et al., 2012),
or crisis management (Tomaszewski et al., 2007).
This has led to an increase of visual approaches that
focus on spatiotemporal and textual analysis.
Analyzing social media data poses challenges
similar to those encountered in historical datasets in
terms of the visual representation of spatial and tem-
poral aspects as well as the dissemination of infor-
mation. MacEachren et al. (2011) propose Sense-
Place2, which harnesses social media posts for cri-
sis management. Similarly, Bosch et al. (2013) in-
troduce ScatterBlogs2, which enables real-time mon-
itoring and filtering of the spatiotemporal and textual
content of micro-blog posts. Chen et al. (2017) build
a virtual, semantic map from patterns in collections of
social media messages. More approaches visualizing
social media data are Whisper (Cao et al., 2012) and
the work by Chen et al. (2016). The latter introduces
an interactive visual analytics approach that uses so-
cial media tweets with geographical tags to identify
and extract movement patterns.
Other approaches have been proposed for histori-
cal data containing spatial, temporal and textual refer-
ences. Such data raise unique difficulties, such as, for
example, heterogeneity and diversity, as described by
Tomaszewski and MacEachren (2010). The HESTIA
project (Barker et al., 2010) works on the visual anal-
ysis of the text corpus of Herodotus’ “The Histories,”
dealing with challenges such as duplicate data or in-
correct entries. It uses a spatiotemporal visualiza-
tion to represent the extracted locations from the text
and provides flexible filtering options. Weaver et al.
(2007), who visually analyze patterns in hotel visita-
tion, mention inconsistencies as a challenge in histor-
ical data. We face similar challenges with digitized
newspaper articles, for instance, with data migration
errors caused by optical character recognition (OCR).
Moretti (2005) introduces the concept of distant
reading. J
¨
anicke et al. (2015) provide a survey of ap-
proaches combining distant with close reading. We
propose an integrated overview-first approach with
high aggregation of a document collection while pro-
viding access to the individual documents.
J
¨
anicke et al. (2012) propose a web-based ap-
proach that supports comparing and exploring differ-
ent topics in a spatiotemporal context. It uses spatial
zoom-dependent aggregations to avoid overlaps in the
geographical representation and enables interactively
starting and refining queries. We approach the over-
lapping of the map insets differently, using clustering,
but employ similar interactive filtering.
Trading Consequences (Hinrichs et al., 2015)
works on a dataset of texts from the 19
th
century
and pursues a research task—similar to that of the
OcEx project—of identifying patterns in flow and dis-
persion, focusing on patterns of commodity trade.
Torget et al. (2011) also work with similar newspa-
per repositories, with their publication dates ranging
from the early 19
th
century to the early 21
st
century.
They emphasize difficulties regarding errors in digiti-
zation of newspaper articles, similar to Weaver et al.
(2007). While they use a much larger, monolingual
dataset, LilyPads’ objective is to integrate multilin-
gual datasets, which are smaller, previously curated,
and focus on specific historical case studies.
LilyPads: Exploring the Spatiotemporal Dissemination of Historical Newspaper Articles
19

3 TASKS AND REQUIREMENTS
Before and during the implementation of LilyPads,
we discussed the approach with scholars from differ-
ent disciplines within the humanities such as cultural
history, comparative literature, or historical linguis-
tics, in regular meetings. The researchers provided us
with a detailed description of the problems they are
trying to approach and the research questions they aim
to address. They are interested in how news spreads,
which kinds of news spread, and how the dissemina-
tion of knowledge, as well as concepts, were affected
by geopolitical realities. The paths of dispersion of
news at that time are not fully recorded, and are espe-
cially not contained in the data. These research ques-
tions can, thus, not be answered directly. Instead, re-
searchers analyze both regional and global nuances
in content and phrasing between articles over time to
infer patterns of dissemination. By proposing visual
requirements to the researchers, we combined the ex-
perience of the RH regarding their domain and work-
flow with our expertise in information visualization.
We further supplemented these requirements with
lessons learned during a field study with six re-
searchers from the OcEx project, who used the pro-
totype for a week. Using their feedback, we could
amend the requirements and improve the visual inter-
face. The RH—who are actively using the prototype
in their research—have since then given us informal,
positive feedback regarding the changes. By evaluat-
ing the challenges and questions, we refine a list of
tasks which LilyPads seeks to address:
T1: Exploratory generation and verification of know-
ledge on the spatiotemporal distribution of news
and nuances of information perception and dis-
semination based on (A) publication location,
(B) date of publication, and (C) contained terms.
T2: Exploration of arbitrary subsets of the data based
on a set of filter criteria, such as date ranges, lan-
guage, contained terms, or geographical region.
T3: Close reading of digitized texts as well as the
metadata and the original scans, to gain know-
ledge about nuances in the case study, or, for ex-
ample, to identify and correct OCR errors.
A set of requirements follows directly from these
tasks. We derived further requirements from discus-
sions with the RH. In the following, we motivate the
requirements and relate them to the tasks.
Discussions with the project members revealed
that the approach should not require too much addi-
tional cognitive load, as to not interfere with their re-
search work. R1 requires the visual interface and the
utilized visualizations to be straightforward, using es-
tablished visualization and interaction techniques.
To enable unhindered exploratory use of the ap-
proach, we further require by R2 an interface with
instant feedback. Based on the findings of Card et al.
(1991), we require lightweight interactions—such as
brushing and linking—to give visual feedback in un-
der 0.1 s. Filtering, which would change the visual-
ized data, should update the visualization in under 1s.
Due to the international nature of the project, any
bias regarding researchers’ mother tongues or inter-
nalized world views must be avoided. Coupled with
multilingual data, an unbiased visualization that does
not presume any lingual or spatial preferences is re-
quired by R3.
T1 implies a need for a visualization in which the
reciprocal effects of different aspects of the data can
be freely explored. We argue that this can be realized
better with an highly integrated approach than with
MCVs. Based on the guidelines set by Wang Baldon-
ado et al. (2000), we aim to minimize the amount of
coordinated views in the visualization, thereby reduc-
ing context switching overhead for users. R4 requires
a single, integrated view for the main content.
T1 also implies that the visualization should pro-
vide an overview of the spatial and temporal distribu-
tion of the documents. R5 requires an overview-first
approach, which allows for reduced precision.
At the same time, the visualization should facili-
tate lightweight interaction, such as hovering, provid-
ing additional detail for the respective part of the vi-
sualization without changing the visualized data. This
interaction should be possible with all components of
the visualization to explore different aspects of the
data (T1.A to T1.C). R6 requires exact details on de-
mand without changing the visualized subset of data.
To explore arbitrary subsets of data (T2), the ap-
proach should support drill-down and filtering oper-
ations. Researchers need to perform multiple drill–
down operations in sequence, while being able to see
and navigate the history of actions. We require con-
catenable and reversible drill-down operations by R7.
As the research emphasis is on content, the vi-
sualization should show an approximate overview of
important terms in the texts. This facilitates an ex-
ploration of nuances based on the textual contents
(T1.C). R8 requires a visualization centered around
an approximate representation of the textual contents.
To switch from distant to close reading (T3), re-
searchers should be able to reach each individual arti-
cle from the visualization. Researchers should be able
to access multiple documents simultaneously to en-
able cross-referencing and comparisons, without hav-
ing to interrupt their current exploration process. R9
requires non-disruptive access to source documents.
IVAPP 2020 - 11th International Conference on Information Visualization Theory and Applications
20

4 HISTORICAL CASE STUDIES
Our project collaborators curate historical case stud-
ies from different international newspaper archives
consisting of newspaper articles in over 20 languages,
as well as metadata such as date and place of publi-
cation. The digitized texts contain OCR errors stem-
ming from damaged pages, narrow typesetting, and
archaic word use. We calculate term and document
frequency for n-grams from the tokenized texts. By
using partly hand-crafted white- and blacklist dictio-
naries, we then filter out OCR errors from the term
counts while preserving outdated spellings and user-
provided whitelist terms, such as important names.
For the figures and descriptions in Sections 5
and 6, we have used the Kossuth case study. It covers
668 newspaper articles published 1851–1852 about
the arrival of Hungarian revolutionary Lajos Kossuth
in New York at the outset of a publicity campaign
to secure American support for Hungarian indepen-
dence. The articles were published in the United
States and Western Europe. As a series of events, the
case study invites exploration of the spatial and tex-
tual dissemination over time (T1.B). It covers a time
period prior to the innovation of the transatlantic ca-
ble. The objective is to analyze how the international
newspaper network by the mid-nineteenth century
was increasingly functioning as a system connected
by domestic telegraph wires, railways, steamships,
exchange networks, and extensive reprinting prac-
tices. Another objective is to explore if the distri-
bution and suppression of certain contents in distinct
geopolitical realities differ (T1.A).
5 VISUAL APPROACH
We implemented LilyPads using JavaScript and
D3.js. As the RH are interested in spatial and tempo-
ral distribution both on a global and a local level (T1
and R5), we decided not to follow a conventional ap-
proach of using MCVs, but instead opted for an inte-
grated view (R4). We settled on this decision because
we visualize the temporal distributions for single lo-
cation clusters and see no viable option of doing so in
an intuitive manner (R1) with an MCV approach.
5.1 Visualization Settings
The approach is agnostic to the world view and per-
ception of the analysts. Consequently, the analysts
require (R3) a means to configure the visualization
to match their preferences. They can select an ori-
gin, from which all location projections are calcu-
lated, from a map (see Figure 1k). They can further
select length units, and the projection method for dis-
tance and direction calculation, from a settings dialog.
The color of most components represents the aver-
age publication date of the documents they represent
to emphasize the temporal aspect of components and
provide an overview of the data (R5). This color scale
is based on the total time range of the currently visu-
alized data. The figures in this paper use a consistent
color scale from cyan to dark blue. We provide a de-
fault for the color scale, but leave it to the analysts to
select their own color scale to account for color blind-
ness and personal preference.
5.2 Total Date Histogram
We show a histogram of the total temporal distribu-
tion of the visualized data in the lower left of the vi-
sual interface (see Figure 1a). This acts both as an
overview (R5), and as a means to get the exact tem-
poral distribution for any part of the overview by in-
teraction (R6). Our approach aggregates dates appro-
priately for the current time range, so that a sensible
number of bars is shown at a time (R1). A small arrow
to the left of the histogram shows the reading direc-
tion, giving analysts an additional frame of reference.
Non-empty bars have a minimum height, which sac-
rifices precision negligibly for improved readability.
5.3 Word Cloud
As required by R8, we center the visualization around
the texts instead of the geographical aspect of the data.
At the same time, we want to show both the spatial
and temporal distribution of the data. Considering R4
and R8, we decide to build the integrated visualiza-
tion around a word cloud (see Figure 2), which we
place in the center of the screen (see Figure 1b). The
word cloud consists of a subset of the terms we ex-
tracted in the preprocessing (see Section 4). The ex-
traction works on the original texts to truthfully rep-
resent the original languages (R3). The prominent
terms appear in the word cloud, offering a condensed
overview of the texts’ contents (R5 and R8).
Font size of the terms encodes document fre-
quency. Interaction with the terms reveals more in-
formation (R6), and a tooltip (see Figure 4c) provides
the term frequency as well. Earlier versions of the ap-
proach, as well as discussions with our project part-
ners, revealed that more involved methods of scoring
terms, such as tf-idf (Dunning, 1993) or G
2
(Chuang
et al., 2012), do not handle large amounts of OCR er-
rors, or multilingual corpora, well. We, therefore, use
document frequency.
LilyPads: Exploring the Spatiotemporal Dissemination of Historical Newspaper Articles
21
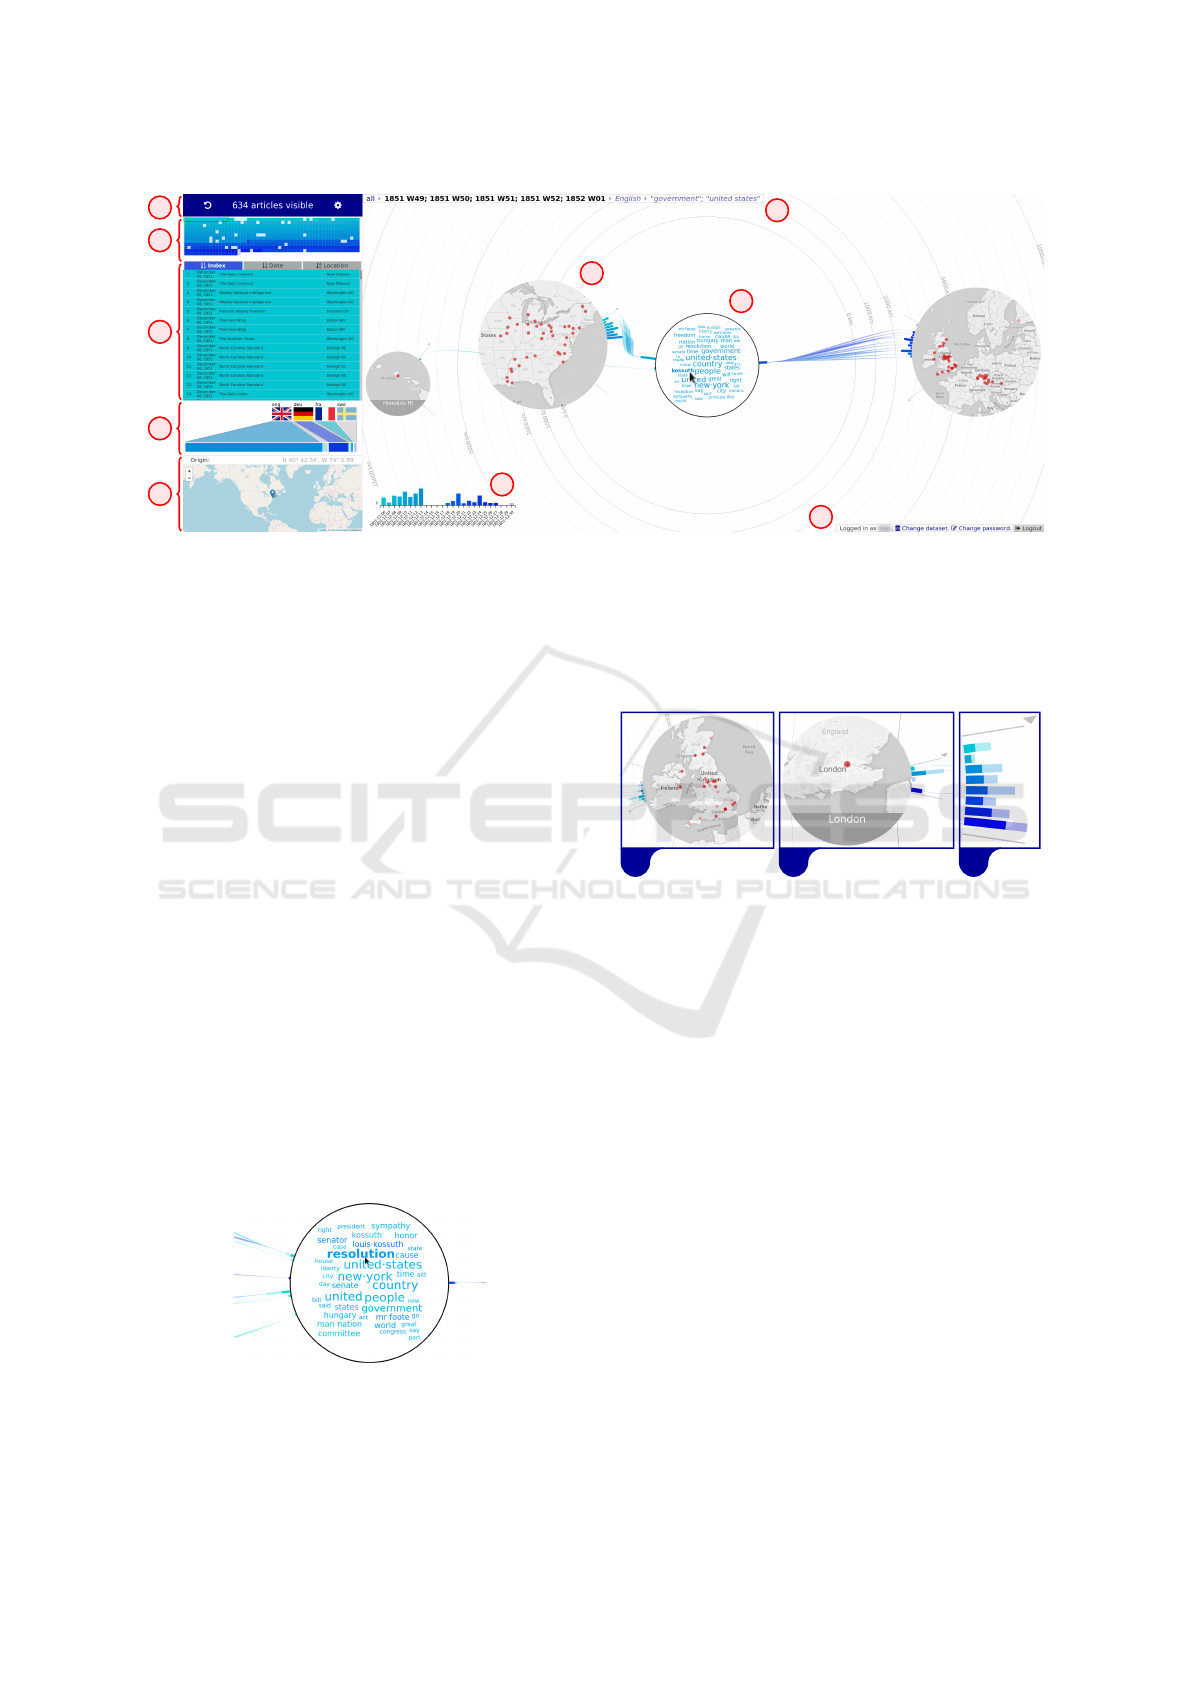
f
g
h
i
k
a
b
c
d
e
Figure 1: The interface of LilyPads. The main view shows the (a) total temporal distribution and a (b) word cloud of frequent
words from the visualized documents, alongside the spatial distribution of the documents. The approach breaks up the world
map into (c) map insets containing areas of interest, which can be shown with a higher level of detail. This leaves the space
between insets to visualize additional information, such as the distribution of the cluster’s publications over the visualized
time period. Clickable (d) breadcrumbs show the current drill-down filters. Several (e, f) controls and settings control the
visualization. On the left side, a (g) document minimap, (h) document list, and (i) distribution of the documents’ languages
are shown. Analysts can also configure the (k) geographical point of view from which to explore the case study data.
5.4 Map Insets
We aim to set focus on the content overview (R8),
while still visualizing the spatial and temporal as-
pects of the data. We show the spatial distribution
of publication locations not as a contiguous map,
but as map insets (see Figures 1c and 3). We built
an integrated visualization (R4) with an interactive
overview, which shows additional details, such as lo-
cal temporal distribution, for the geographical loca-
tions (R5 and R6). Because we further require an in-
terface that is easy to understand and unintrusive in an
already-established workflow (R1), and do not want
to presume anything about the analysts’ mental world
views (R3), a single, integrated view with a perspec-
tive depending on the analysts’ preferences seems to
be the most promising solution. By not showing a
contiguous map, we are also able to show the tem-
poral distribution of the data, as well as the links be-
tween the components, against a blank background,
which improves readability.
Figure 2: The central word cloud. The color of linked terms
encodes the mean publication date of all brushed documents
containing the term. Around the word cloud, histogram bars
show the distribution of the documents on the insets.
a
b
c
Figure 3: Two map insets show a (a) cluster of publication
locations, and a (b) single location. LilyPads draws places
of publication as red circles. The publication dates of the
represented documents are shown as a (c) radial histogram.
R4 and R5 require the approach to reveal the tem-
poral distribution of documents for local regions. We,
therefore, show a histogram for the dates of the publi-
cations contained in the inset, which we aggregate to
the same scale as the total date histogram (see Fig-
ure 3c). This histogram is radial, faces the word
cloud, and is read clockwise, which is indicated by
a gray arrow. Paths connect the histogram bars to
the bar around the word cloud representing that inset.
When brushing anywhere in the visualization, these
paths encode publication date and number of linked
documents by color and thickness of the line. While
other approaches (Boyandin et al., 2011; Yang et al.,
2017) encode additional data in the links by breaking
them up, we are content with encoding date and num-
ber of documents. We, thus, uphold continuity and
improve readability of the links.
As the histogram’s purpose is to give an approxi-
mate overview (R5), the reduced readability of radial
histograms is tolerable. Analysts can get the exact
IVAPP 2020 - 11th International Conference on Information Visualization Theory and Applications
22

temporal distribution on demand from the linked por-
tion of the total date histogram’s linking, by brushing
the inset (R6). To improve readability of the radial
histogram, our approach indicates the start angle, end
angle, and reading direction (see Figure 3).
To create localized groups while reducing over-
lap between the map insets, our approach first hierar-
chically clusters the locations. The approach subse-
quently maps the clusters to insets. We use hierarchi-
cal agglomerative clustering with single linkage cri-
terion, and calculate the distance matrix using the se-
lected projection method on the locations. This works
well for our case study data because its places of pub-
lication are distributed heterogeneously.
The initial feedback from the RH emphasized that
the clustering approach could hide local nuances in
temporal and textual distribution. We, therefore, in-
troduced a clustering threshold dependent on the to-
tal spatial extent of the visualized locations. This
threshold is
1
/6
th
of the maximum distance between
any two locations in the currently visualized data. We
found this value through incremental experimentation
as yielding the most satisfying results: splitting up
clusters on drill-down, while grouping locations into
meaningful clusters on the overview level. The ana-
lysts can then explore these local nuances.
LilyPads places the insets using the selected pro-
jection method, which considers the direction and
distance from the selected origin (see Section 5.1
and Figure 1k). This way, analysts can select the per-
spective from which they want to explore the data;
for example, they can select the analysts’ own loca-
tion, or whatever location seems to be adequate for a
respective case study (R3).
To eliminate overlaps between the map insets, we
perform a velocity Verlet force-simulation. We extend
the basic functionality provided by D3.js by adding
code that ensures that insets stay on their respective
isoline when moving. Our approach then places the
map insets accordingly, with their date histograms
pointing towards the word cloud (see Figure 1c). The
insets are sized depending on the number of displayed
locations and the number of clusters, to maximize
readability while reducing strain on the overlap reduc-
tion. Each inset shows a map, on which the cluster’s
locations are marked, clamped to a zoom level range
to allow for recognizable cartographic features. For
map insets showing only one location, this location’s
name is also shown in the inset (see Figure 3b). Be-
low the map insets, labeled isolines show the distance
of the cluster from the origin. Choosing a circular
shape for map insets lets viewers estimate inset posi-
tions more easily and avoids overlap with a good ratio
between visible clipping area and size.
a
b
c
Figure 4: A tooltip briefly describes the represented data for
each component in the visualization.
5.5 Document Minimap and Documents
A document minimap in the top left corner (see Fig-
ure 1g) provides an additional overview of the cur-
rent data. It visualizes each document as a square col-
ored by the publication date. Such a visualization is
also commonly referred to as “pixel-based visualiza-
tion” (Oelke et al., 2011; Keim, 2000) or as “waffle
chart” (Ziemkiewicz and Kosara, 2010). The squares
can be sorted by their documents’ index in the dataset,
publication date, or alphabetical location. The mini-
map provides RH with an additional reference on the
temporal distribution within a component on interac-
tion (R6), as well as on the amount of brushed data.
Below the document minimap, a scrollable docu-
ment list shows the articles as well (see Figure 1h).
The document minimap, which uses the same order
as the document list, shows a red frame indicating the
current viewport on the list (see Figure 1g). Click-
ing a document in the list shows the full text and its
metadata in a new tab (R9). This feature enables an-
alysts to trace back the original source, to access one
or many articles’ origins at the same time without dis-
rupting the exploration process, and to build bridges
between research and archival institutions.
5.6 Interaction
LilyPads implements brushing and linking for all
components. This enables retrieval of details and
precise values from the overview during exploration,
without changing the visualized data (R5 and R6); for
example, analysts can instantly retrieve the total tem-
poral distribution for a word in the word cloud or a
map inset by brushing that word or inset and look-
ing at the total date histogram in the lower left (see
Figure 1a). In addition, hovering over any compo-
nent of the visualization shows a tooltip describing
the data that component represents. Figure 4 shows
some tooltips; for instance, the time period is shown
for a date histogram bar (4a), the locations are listed
for a map inset (4b), and the document and term fre-
quencies are shown for a word in the word cloud (4c).
In addition to light interactions, which do not alter
LilyPads: Exploring the Spatiotemporal Dissemination of Historical Newspaper Articles
23

a
b
c
Figure 5: Analysts can select multiple components by right-
click, to group them for interaction. Selection is indicated
by red markings around the component. Different types of
components can be selected simultaneously.
the visualized subset of data, our prototype also sup-
ports drill-down operations (R7). Analogous to how
brushing any component links the data represented by
it throughout the visualization, clicking on the com-
ponent restarts the visualization with only the repre-
sented data. Analysts can, thus, preview the result of
a drill-down from the linking.
Analysts may also group multiple components by
right-clicking them. Grouped components behave
as if being one component and represent the union
of all articles represented by any of them; for in-
stance, grouping the bar for October 21, 1883 and
the map inset showing London, England would create
a group representing all articles either published that
day, or published in London, or both. Brushing—or
left-clicking on—any component in the group would
link—or drill down into—the dataset satisfying this
union of criteria. An intersection of criteria can be
realized by concatenating drill-down operations. In-
stances for marked components are shown in Fig-
ure 5. The current drill-down steps are described in a
breadcrumb view in the top left (see Figure 1d). The
breadcrumb view enables jumping back to previous
stages of the drill-down, and forward again.
We refrained from changing too much of the word
cloud on hover because that was computationally too
time-consuming (R2). Because of flexible drill-down
options, arbitrary subsets of the data can be visualized
at a time. Hence, it is not viable to precalculate the
word cloud configurations for all brushable compo-
nents of any subset of data ahead of time. Similarly,
calculating this at the time of creation of the visual-
ization, that is, after a filtering action, would delay
the redraw too much and also make the user experi-
ence lackluster. Thus, we show a largely static word
cloud for a subset of data, in which words contained
in the brushed set of articles are only linked by color.
6 ANALYSIS SCENARIO
To demonstrate LilyPads’ applicability in the work-
flow of the RH, in the following we present an ex-
emplary analysis scenario on the Kossuth case study
introduced in Section 4. Viewed through the frame of
secondary literature on Kossuth’s exile in the United
States, his arrival appears to be a particularly na-
tional event with little resonance outside of the United
States. However, such a view ignores the profoundly
global consequences of his mission. In studying the
event through a wider global lens, it becomes possible
to tease out comparative points of discussion that ac-
knowledge networks of communication and disjunc-
ture. Indeed, when opening the Kossuth case study
data in LilyPads, we instantly see that, while many
of the articles were published in the eastern United
States, news sources in Europe make up about one
third of the data. Brushing the two main clusters—the
eastern United States and Europe—reveals that pub-
lication in Europe started about two weeks after Kos-
suth’s arrival in New York City, which took place on
December 6, 1851. We can also see this delay in pub-
lication from the radial histograms around those two
insets, shown in Figure 6a. Reading some of the arti-
cles published in Europe confirms that they report on
Kossuth’s arrival, weeks after the event. The transat-
lantic telegraph cable was not completed at that time,
which explains the delay.
Curious about the relation between the case study
data and the main topic, Kossuth, we hover over the
term “kossuth” in the word cloud, and read from the
tooltip that it only appears in 630 of the 668 arti-
cles. The case study was curated manually, and ide-
ally should only consist of articles reporting on Kos-
suth and his propaganda tour. Hence, this discrepancy
intrigues us. We identify some non-brushed docu-
ments in the document minimap (see Figure 6b). Us-
ing the red frame indicating the document list’s view
box as reference, we scroll the document list to show
some of those documents. We open these documents
in new browser tabs by clicking on the entries in the
list, and inspect the texts. We can conclude that the
word “kossuth” not being contained in certain docu-
ments is often due to excessive amounts of OCR er-
rors. In other instances, Kossuth is not mentioned by
name, but instead, for example, as “the exiled Gov-
ernor of Hungary.” Other articles seem to refer to
speeches by Kossuth, and so do not contain his name.
During the exploration of the data, we notice the
map inset containing Honolulu. When brushing the
inset, we notice that some articles were published in
week 49 of 1851—the week of Kossuth’s arrival in
New York City. This is intriguing, as Honolulu at
IVAPP 2020 - 11th International Conference on Information Visualization Theory and Applications
24
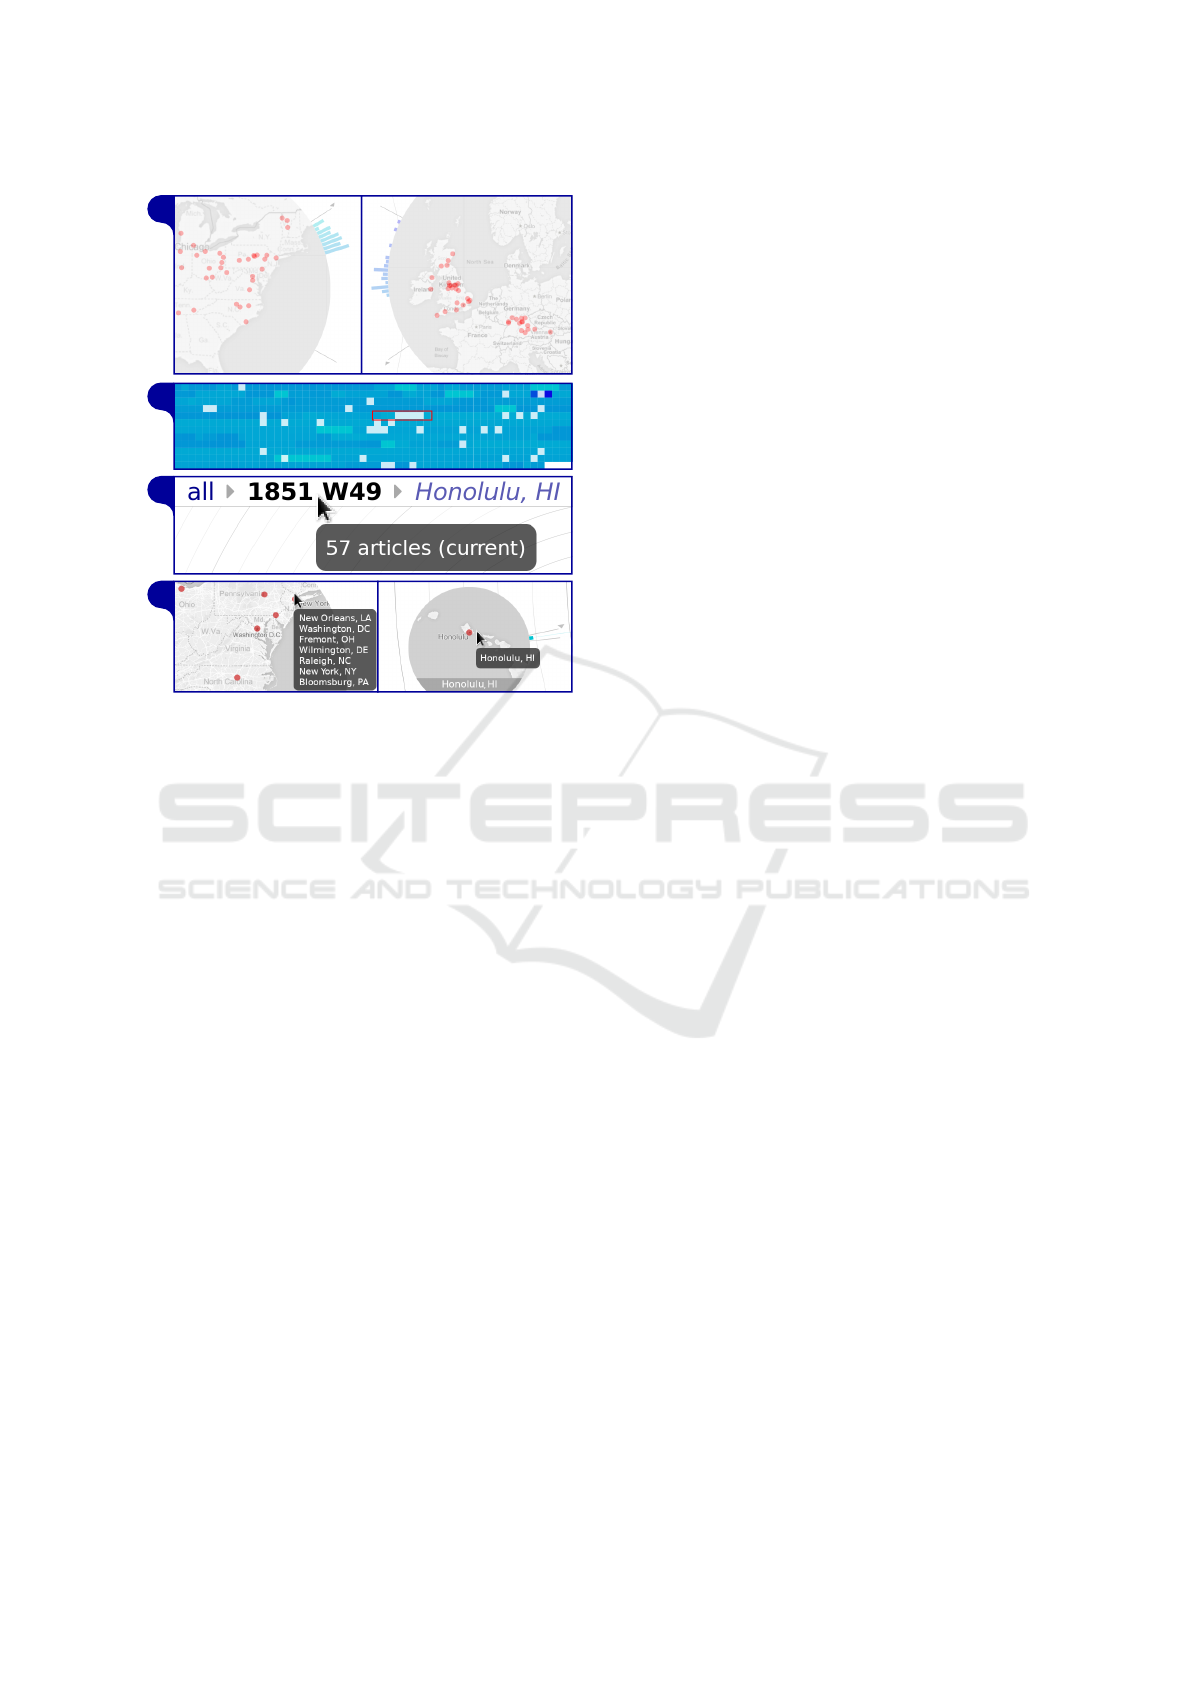
b
c
a
d
Figure 6: Interaction steps performed in the analysis sce-
nario described in Section 6. The (a) date histograms
around the insets show the delay in publication between the
US and Europe, the (b) document minimap reveals articles
not containing the term “Kossuth”, the (c) breadcrumb view
shows the drill-down stack, and the (d) tooltips are used to
retrieve publication locations from insets.
that time was getting news from the mainland only by
ship. We click first on the bar for week 49 of 1851 in
the total histogram, and subsequently on the Honolulu
inset, drilling down to show only one article. Read-
ing it, we confirm that the article in question does not
report on Kossuth’s arrival in New York, but instead
quotes an article from the New York Herald from Oc-
tober of 1851. We have, thus, revealed that the data
contains articles that do not cover Kossuth’s propa-
ganda tour. Nevertheless, this instance reveals a route
of information distribution of that time.
We want to further explore the data from week 49
of 1851. By clicking on the entry “1851 W49” in the
breadcrumb view, we step back in the drill-down to
show 57 articles (see Figure 6c) from 8 locations in
the United States, all published on December 6 and
7, 1851. We already notice a shift of contents in
the word cloud, which now portrays words frequently
used in this week, such as “reception”. By clicking on
the histogram bar representing December 6 in the to-
tal histogram, we drill down further to the day of Kos-
suth’s arrival. LilyPads now shows 43 articles from 8
locations. We hover over the remaining map insets
and read the names from the tooltips (see Figure 6d).
We go back to the full dataset by clicking “all” in
the breadcrumb view. We use the buttons above the
document list to sort the list by location name alpha-
betically, and subsequently ascending by date. Be-
cause of stable sorting, articles published in the same
location on the same day are now grouped. We notice
that multiple articles in the data were published by
the same newspapers on the same day; for instance,
nine articles were published by the New York Herald
on the first day. From reading them, we can glean
that all contain distinct textual information. However,
some seem to be incomplete, which hints to one arti-
cle being split up during the OCR preprocessing. That
can happen with newspaper scans because of tightly
packed text columns, and because of advertisements
inserted in the middle of a column.
By including LilyPads into the working method,
domain experts are able to gain insights into the case
study in an exploratory manner. In our analysis sce-
nario, we explored a dataset of newspaper articles
large enough that single researchers could not process
them efficiently with close reading. During that ex-
ploration, we came up with questions about the nature
of the data from looking at it. We could then answer
those questions on the spot; for instance, we found ar-
ticles that were not addressing the main topic of inter-
est. We also found routes of dissemination from New
York City to Honolulu and Europe, and could gauge
an approximate travel time of information in an age
shortly before transoceanic telegraph cables.
The strength of our approach is that the posing—
and answering—of research questions can be organi-
cally included in an exploration process, without hav-
ing to specify a specific goal in advance. While other
methods exist to efficiently answer concrete questions
about a dataset, LilyPads permits a more exploration-
oriented approach to a historical case study. Our ap-
proach takes up the challenge of distant or scalable
reading with an aim not to replace textual evidence
with graphs, maps, or trees, but to uncover and model
new sets of evidence difficult to discern at the level of
the individual newspaper.
7 DISCUSSION
We discuss our approach’s suitability regarding the
demands of the RH and the tasks and requirements
introduced in Section 3. This includes the implica-
tions of our approach for visualization research and
the scalability as well as limitations of our approach.
LilyPads: Exploring the Spatiotemporal Dissemination of Historical Newspaper Articles
25

7.1 Usefulness
Our project partners in the OcEx project acknowl-
edged the usefulness of the LilyPads approach for
their research environment positively. As visualiza-
tion makes it easy to detect outliers even in larger sets
of data, we were also able to find data entry errors—
such as mismatched date formats—in the case study
data, and subsequently correct them.
However, there are still some issues considering
usability, such as the multi-selection feature, which
some researchers from the OcEx project have claimed
not to completely understand immediately. Further
feedback and feature requests include collaborative
research improvements and facilities to exchange the-
ories and datasets, which we consider as future work.
LilyPads fulfills the criteria that were defined con-
sidering the tasks and requirements introduced in Sec-
tion 3. With our approach, researchers do not only get
an overview of the case study, but can further explore
the effects of spatial (T1.A), temporal (T1.B), and
textual (T1.C) distribution, being able to juxtapose
them. Our approach supports drill-down into subsets
of the data (T2), as well as access to the full doc-
uments (T3). In performing an analysis scenario of
one of the case studies in Section 6, we have demon-
strated the applicability of LilyPads for effective use
by domain experts from the OcEx project.
7.2 Scalability and Limitations
We consider scalability regarding different aspects in
the LilyPads approach. LilyPads facilitates an explo-
ration method starting with an overview, which ag-
gregates different aspects of the data accordingly. A
dataset spanning a longer time frame would be ag-
gregated to a higher degree; for instance, into months
(see Section 5.2). This aggregation implies scalabil-
ity to a degree, which we also show by visualizing the
considerably larger Kossuth case study. Researchers
would still be able to slice down into subsets of that
data (R7) and to access single documents (R9). As the
aggregation level both for time and for clusters (see
Section 5.4) depends on the total size of the respec-
tive domain, the drill-down also sufficiently limits the
size of the dataset in each step.
Our approach was specifically developed for non-
uniform geographic distributions. The usefulness of
our inset-based approach would suffer from uniform
geographic distributions. However, such uniformity is
unlikely to occur for the size of event- or topic-based
historic data sets we are dealing with. This is due to
thematic restrictions, but also limited sources and the
natural concentration on densely populated regions.
For considerably larger datasets, the performance
of the visualization would suffer. In these cases,
data needs to be aggregated adequately in the server
back-end, and details for subsets of data have to be
calculated and provided on demand. However, we
want to emphasize that arbitrary scalability of the ap-
proach is not required. The researchers’ objective is
to explore relatively small, curated case studies fo-
cusing on one topic or event. These case studies
have a size of between 50 and 2, 500 articles, which
is still within the capabilities of LilyPads. LilyPads
is an interactive approach to be employed by RH to
find and test hypotheses about specific case studies
in an exploratory manner. While these case stud-
ies are relatively small—especially in comparison to
the total amount of digitized newspapers available to
the RH—they are already too large to efficiently ex-
plore in a bottom-up fashion. Therefore, an overview-
first approach seems to be an adequate option, which
we were able to confirm by feedback from the re-
searchers, and in the scope of an analysis scenario.
The researchers agreed that details were accessible
using different types of interaction, emphasizing the
usefulness of the overview aggregation and the point-
of-view visualization approach.
7.3 Lessons Learned
Despite the use of imprecise visualization techniques,
such as word clouds and radial bar charts, the overall
feedback from the RH regarding usability and under-
standability of the approach was good. We conclude
that in visualization, precision can often be decreased
in favor of a good overview, as long as precise data
can still be provided on demand. Thus, interactive and
interconnected visualization in particular enables the
use of techniques unsuited for static visualization.
We also observe that the distribution of geograph-
ical positions does not need to be visualized on a con-
tiguous map. For the use case of the RH, our approach
of breaking up the map is effectual. However, the ap-
proach is specialized to the nature of the data, and
needs to be properly justified. In many cases, such
as spatially dense data (see Section 7.2), showing a
full map and integrating different aspects of the data
into that map might be more sensible. Our approach
especially works, on the one hand, due to the interac-
tive visual interface providing details on demand and,
on the other hand, because researchers can choose the
spatial perspective on the data.
IVAPP 2020 - 11th International Conference on Information Visualization Theory and Applications
26

8 CONCLUSION
With LilyPads, we provide an integrated visualization
approach that enables interactive exploration of cor-
pora of historical newspapers in sizes up to the lower
thousands. We explore an egocentric visualization ap-
proach that indicates the spatial distribution, while
maintaining the focus on other aspects of the data.
By providing an analysis scenario developed with the
RH, we demonstrate LilyPads’ applicability. We find
that LilyPads is generally scalable to datasets of sizes
and extents relevant for the case studies of the RH.
Future directions of research include confirm-
ing the scalability with case studies from the OcEx
project ranging up to the lower thousands of articles.
We also consider an extensive comparative study on
the topic of splitting up maps, exploring under which
circumstances this approach is beneficial. Finally, we
consider extending the functionality of LilyPads by
allowing import and export of arbitrary datasets and
improving facilities for collaborative exploration.
ACKNOWLEDGMENTS
This work has been funded by the German Research
Foundation (DFG) in the context of the Digging into
Data Challenge project “Oceanic Exchanges” and by
the VolkswagenStiftung as part of the Mixed Meth-
ods project “Dhimmis & Muslims.” Different ideas
proposed in this work are based on discussions with
scholars of the “Center for Reflected Text Analysis”
(CRETA) financed by the German Federal Ministry
of Research and Education (BMBF).
REFERENCES
Alexander, E., Chang, C.-C., Shimabukuro, M., Franconeri,
S., Collins, C., and Gleicher, M. (2018). Perceptual
biases in font size as a data encoding. IEEE TVCG,
24(8):2397–2410.
Andrienko, G., Andrienko, N., Fuchs, G., and Wood, J.
(2017). Revealing patterns and trends of mass mobi-
lity through spatial and temporal abstraction of origin-
destination movement data. IEEE TVCG, 23(9):2120–
2136.
Barker, E., Bouzarovski, S., Pelling, C., and Isaksen, L.
(2010). Mapping an ancient historian in a digital age:
the Herodotus Encoded Space-Text-Image Archive
(HESTIA). Leeds International Classical Studies, 9.
Bosch, H., Thom, D., Heimerl, F., P
¨
uttmann, E., Koch, S.,
Kr
¨
uger, R., W
¨
orner, M., and Ertl, T. (2013). Scat-
terBlogs2: Real-time monitoring of microblog mes-
sages through user-guided filtering. IEEE TVCG,
19(12):2022–2031.
Boyandin, I., Bertini, E., Bak, P., and Lalanne, D. (2011).
FlowStrates: An approach for visual exploration of
temporal origin-destination data. Computer Graphics
Forum, 30(3):971–980.
Brodkorb, F., Kuijper, A., Andrienko, G., Andrienko, N.,
and von Landesberger, T. (2016). Overview with de-
tails for exploring geo-located graphs on maps. Infor-
mation Visualization, 15(3):214–237.
Cao, N., Lin, Y.-R., Sun, X., Lazer, D., Liu, S., and Qu, H.
(2012). Whisper: Tracing the spatiotemporal process
of information diffusion in real time. IEEE TVCG,
18(12):2649–2658.
Card, S. K., Robertson, G. G., and Mackinlay, J. D.
(1991). The information visualizer, an information
workspace. In Proc. SIGCHI Conference on Human
factors in computing systems, pages 181–186. ACM.
Chen, S., Chen, S., Lin, L., Yuan, X., Liang, J., and Zhang,
X. (2017). E-Map: A visual analytics approach for
exploring significant event evolutions in social media.
In Proc. VAST, pages 36–47. IEEE.
Chen, S., Yuan, X., Wang, Z., Guo, C., Liang, J., Wang,
Z., Zhang, X. L., and Zhang, J. (2016). Interactive vi-
sual discovering of movement patterns from sparsely
sampled geo-tagged social media data. IEEE TVCG,
22(1):270–279.
Cho, I., Dou, W., Wang, D. X., Sauda, E., and Ribarsky,
W. (2016). VAiRoma: A visual analytics system for
making sense of places, times, and events in Roman
history. IEEE TVCG, 22(1):210–219.
Chuang, J., Manning, C. D., and Heer, J. (2012). Ter-
mite: Visualization techniques for assessing textual
topic models. In Proc. AVI, pages 74–77, New York,
NY, USA. ACM.
Collins, C., Viegas, F. B., and Wattenberg, M. (2009). Paral-
lel tag clouds to explore and analyze faceted text cor-
pora. In Proc. VAST, pages 91–98. IEEE.
D
¨
ork, M., Carpendale, S., Collins, C., and Williamson, C.
(2008). VisGets: Coordinated visualizations for web-
based information exploration and discovery. IEEE
TVCG, 14(6):1205–1212.
Drocourt, Y., Borgo, R., Scharrer, K., Murray, T., Bevan,
S. I., and Chen, M. (2011). Temporal visualization of
boundary-based geo-information using radial projec-
tion. Computer Graphics Forum, 30(3):981–990.
Dunning, T. (1993). Accurate methods for the statistics of
surprise and coincidence. Computational Linguistics,
19(1):61–74.
Fuchs, G. and Schumann, H. (2004). Visualizing abstract
data on maps. In Proc. InfoVis, pages 139–144. IEEE.
Ghani, S., Riche, N. H., and Elmqvist, N. (2011). Dynamic
insets for context-aware graph navigation. Computer
Graphics Forum, 30(3):861–870.
Hearst, M. A. and Rosner, D. (2008). Tag clouds: Data
analysis tool or social signaller? In Proc. HICCS,
pages 160–160. IEEE.
Heimerl, F., Lohmann, S., Lange, S., and Ertl, T. (2014).
Word cloud explorer: Text analytics based on word
clouds. In Proc. HICCS, pages 1833–1842. IEEE.
Hinrichs, U., Alex, B., Clifford, J., Watson, A., Quigley, A.,
Klein, E., and Coates, C. M. (2015). Trading conse-
LilyPads: Exploring the Spatiotemporal Dissemination of Historical Newspaper Articles
27

quences: A case study of combining text mining and
visualization to facilitate document exploration. Dig-
ital Scholarship in the Humanities, 30(suppl 1):i50–
i75.
Huang, G., Govoni, S., Choi, J., Hartley, D., and Wilson, J.
(2008). Geovisualizing data with ring maps. ArcUser,
11(1):54–55.
John, M., Marbach, E., Lohmann, S., Heimerl, F., and Ertl,
T. (2018). MultiCloud: Interactive word cloud visu-
alization for the analysis of multiple texts. In Proc.
Graphics Interface, pages 34–41. Canadian Human-
Computer Communications Society.
J
¨
anicke, S., Franzini, G., Cheema, M. F., and Scheuermann,
G. (2015). On close and distant reading in digital hu-
manities: A survey and future challenges. In Proc.
EuroVis STARs, pages 83–103. Eurographics Associ-
ation.
J
¨
anicke, S., Heine, C., Stockmann, R., and Scheuermann,
G. (2012). Comparative visualization of geospatial-
temporal data. In Proc. GRAPP/IVAPP, pages 613–
625. INSTICC.
Keim, D. (2000). Designing pixel-oriented visualization
techniques: Theory and applications. IEEE TVCG,
6(1):59–78.
Koch, S., Bosch, H., Giereth, M., and Ertl, T. (2011). It-
erative integration of visual insights during scalable
patent search and analysis. IEEE TVCG, 17(5):557–
569.
Lee, B., Riche, N. H., Karlson, A. K., and Carpendale, S.
(2010). SparkClouds: Visualizing trends in tag clouds.
IEEE TVCG, 16(6):1182–1189.
Lekschas, F., Behrisch, M., Bach, B., Kerpedjiev, P.,
Gehlenborg, N., and Pfister, H. (2020). Pattern-driven
navigation in 2D multiscale visualizations with scal-
able insets. IEEE TVCG, 26(1):611–621.
MacEachren, A. M., Jaiswal, A. R., Robinson, A., Peza-
nowski, S., Savelyev, A., Mitra, P., Zhang, X., and
Blanford, J. (2011). SensePlace2: GeoTwitter analyt-
ics support for situational awareness. In Proc. VAST,
pages 181–190. IEEE.
Moretti, F. (2005). Graphs, maps, trees: Abstract models
for literary history. Verso.
Nguyen, D. and Schumann, H. (2010). Taggram: Exploring
geo-data on maps through a tag cloud-based visualiza-
tion. In Proc. InfoVis, pages 322–328. IEEE.
Nguyen, D., Tominski, C., Schumann, H., and Ta, T. (2011).
Visualizing tags with spatiotemporal references. In
Proc. InfoVis, pages 32–39. IEEE.
Oceanic Exchanges Project Team (2017). Oceanic
Exchanges: Tracing global information networks
in historical newspaper repositories. https://
oceanicexchanges.org/. [Online; accessed 2019-
09-16].
Oelke, D., Janetzko, H., Simon, S., Neuhaus, K., and Keim,
D. A. (2011). Visual boosting in pixel-based visual-
izations. Computer Graphics Forum, 30(3):871–880.
Rivadeneira, A. W., Gruen, D. M., Muller, M. J., and
Millen, D. R. (2007). Getting our head in the clouds:
toward evaluation studies of tagclouds. In Proc.
SIGCHI Conference on Human Factors in Computing
Systems, pages 995–998. ACM.
Sheidin, J., Lanir, J., Bak, P., and Kuflik, T. (2017). Time-
ray maps: Visualization of spatial and temporal evo-
lution of news stories. In Proc. EuroVis Short Papers
, pages 85–89. Eurographics Association.
Stasko, J. and Zhang, E. (2000). Focus+context display
and navigation techniques for enhancing radial, space-
filling hierarchy visualizations. In Proc. InfoVis ,
pages 57–65. IEEE.
Thakur, S. and Hanson, A. J. (2010). A 3D visualization of
multiple time series on maps. In Proc. InfoVis, pages
336–343. IEEE.
Tomaszewski, B. M. and MacEachren, A. M. (2010). Geo-
historical context support for information foraging
and sensemaking: Conceptual model, implementa-
tion, and assessment. In Proc. VAST, pages 139–146.
IEEE.
Tomaszewski, B. M., Robinson, A. C., Weaver, C., Stryker,
M., and MacEachren, A. M. (2007). Geovisual analyt-
ics and crisis management. In Proc. ISCRAM, pages
173–179. ASP.
Tominski, C., Schulze-Wollgast, P., and Schumann, H.
(2005). 3D information visualization for time depen-
dent data on maps. In Proc. InfoVis, pages 175–181.
IEEE.
Torget, A. J., Mihalcea, R., Christensen, J., and McGhee, G.
(2011). Mapping texts: Combining text-mining and
geo-visualization to unlock the research potential of
historical newspapers. Technical report, University of
North Texas.
Vuillemot, R., Clement, T., Plaisant, C., and Kumar, A.
(2009). What’s being said near “Martha”? Explor-
ing name entities in literary text collections. In Proc.
VAST , pages 107–114. IEEE.
Wang Baldonado, M. Q., Woodruff, A., and Kuchinsky, A.
(2000). Guidelines for using multiple views in infor-
mation visualization. In Proc. Working Conference on
Advanced Visual Interfaces, pages 110–119. ACM.
Weaver, C., Fyfe, D., Robinson, A., Holdsworth, D., Peu-
quet, D., and MacEachren, A. M. (2007). Visual ex-
ploration and analysis of historic hotel visits. Infor-
mation Visualization, 6(1):89–103.
Yang, Y., Dwyer, T., Goodwin, S., and Marriott, K. (2017).
Many-to-many geographically-embedded flow visual-
isation: An evaluation. IEEE TVCG, 23(1):411–420.
Zhou, Z., Meng, L., Tang, C., Zhao, Y., Guo, Z., Hu, M.,
and Chen, W. (2018). Visual abstraction of large scale
geospatial origin-destination movement data. IEEE
TVCG, 15(1):43–53.
Ziemkiewicz, C. and Kosara, R. (2010). Implied dynamics
in information visualization. In Proc. AVI, pages 215–
222. ACM.
IVAPP 2020 - 11th International Conference on Information Visualization Theory and Applications
28
