
Detecting Tunnels for Border Security based on Fiber Optical
Distributed Acoustic Sensor Data using DBSCAN
Suleyman Alpay Aslangul
a
ASELSAN Homeland Security Programs Department, UGES Division ASELSAN Mehmet Akif Ersoy,
Mah. 296. Cad. No: 16 06370 Yenimahalle Ankara, Turkey
Keywords: Smart Border Security, Homeland Security, Intrusion Detection, DAS Fiber Optic Sensors, Data Mining,
DBSCAN, Standard Deviation, Software, Situational Awareness, Machine Learning.
Abstract: The Border Situational Awareness may consist of many different features. Mainly, these features focus on
detecting intrusion activities. New generation security systems are collecting important amount of data
obtained from sensors. In general, the alarm confirmation mechanism is visual identification using cameras
and Video Management Systems. On the other hand, this approach may not be enough to identify an invisible
tunnel digging activity underground for trespassing the border. This paper is suggesting a new method to
detect tunnels by using statically filtered alarm data and DBSCAN algorithm. In this particular case MIDAS®
Fiber Optic based Distributed Acoustic Sensor (DAS) system is used, which is designed by ASELSAN Inc.
The proposed approach is evaluated and positive results are seen on diverse areas of the Turkish borders.
1 INTRODUCTION
Border Situational Awareness may consist of many
different features. Mainly, these features focus on
detecting intrusion activities. New generation
security systems are collecting important amount of
data obtained from sensors. In general, the alarm
confirmation mechanism is visual identification using
cameras and Video Management Systems. On the
other hand, this approach may not be enough to
identify an invisible tunnel digging activity
underground for trespassing the border. This paper is
suggesting a new method to detect tunnels by using
statically filtered alarm data and DBSCAN algorithm.
In this particular case MIDAS® Fiber Optic based
Distributed Acoustic Sensor (DAS) system is used,
which is designed by ASELSAN Inc. The proposed
approach is evaluated and seen positive results on
diverse areas of the Turkish borders (Figs. 1 and 2).
DAS Technology is commonly based on coherent
Rayleigh scattering. The principle of DAS is based on
Rayleigh-scattering. Basically this phenomenon can
be explained by physical vibrations that cause
scattering from multiple points within the same fiber.
These captured scattered light signals lead the system
to detect and identify intrusions. DAS provides long
a
https://www.aselsan.com.tr
distance spatial-resolution (around 50 km range), and
high dynamic-range sensing. In addition to this, DAS
uses standard single mode fiber optic cable to provide
the long-distance acoustic and seismic detection.
With suitable analysis software, continuous
monitoring of pipelines for unwanted interference, as
well as leaks or flow irregularities and environmental
monitoring is possible (Abbar, 2019). Roads, borders,
railways, traffic, perimeters etc. can be monitored for
unusual activity with the position of the activity being
determined to within approximately 10 meters. Due
to the ability of the optic fiber to operate in harsh
environments, the technology can also be used in oil
well monitoring applications. This ability allowes
real-time information on the state of the well to be
determined. In this document the channel referred to
each measured scattering point. Which represents the
distance from the beginning of the fiber connection.
Each channel has known with its geographic location
(latitude and longitude).
Clandestine Tunnel is one of the ancient
techniques for intrusion. There are already certain
methodologies exist to discover tunnel’s underground
such as using magnetic sensors and ground
penetration radars (Llopis, Dunbar, Wakeley,
Corcoran,
2005, Nibi, Menon, Amrita, 2016 and
78
Aslangul, S.
Detecting Tunnels for Border Security based on Fiber Optical Distributed Acoustic Sensor Data using DBSCAN.
DOI: 10.5220/0008869600780084
In Proceedings of the 9th International Conference on Sensor Networks (SENSORNETS 2020), pages 78-84
ISBN: 978-989-758-403-9; ISSN: 2184-4380
Copyright
c
2022 by SCITEPRESS – Science and Technology Publications, Lda. All rights reserved
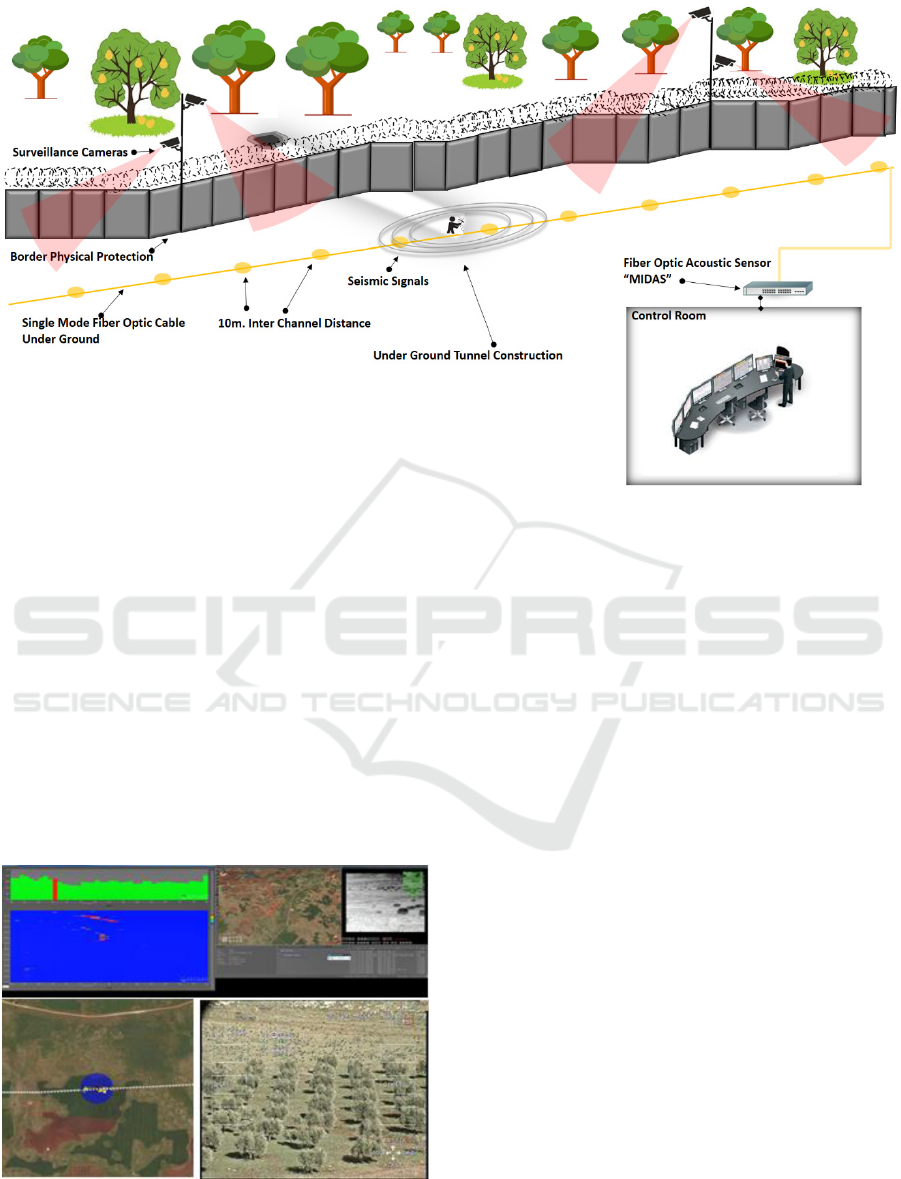
Figure 1: Smart Border Security System.
Kumari, Kumar, Gupta, Priyadarshini, 2018) as well
as discovering digging activities coming from
underground by using two different DAS sensor
systems which are located apart from each other
(Duckworth, Owen, Worsley, Stephenson, 2013).
These techniques require additional equipment,
installation and trained personal that will increase the
cost dramatically, regarding the hundreds of miles of
border length. This paper presents a cost-effective
approach by using already recorded unclassified
alarm data in Data Base rather than using signal
processing techniques or additional devices and
sensors.
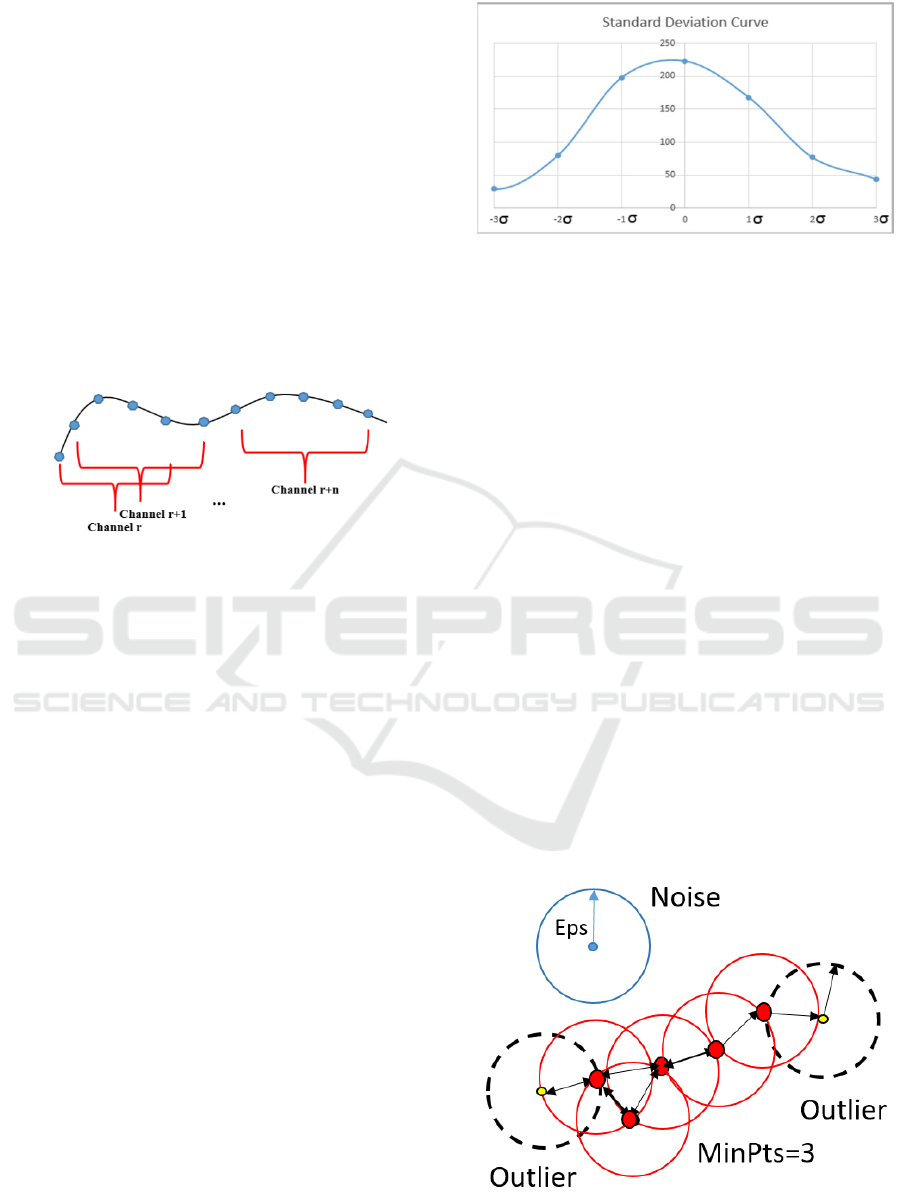
Figure 2: Border Security System Screens, Waterfall Screen
shows the DAS activation, GIS screen shows the alarm
location on the map, and video stream.
The method consists of three phases (Fig.3). The
first phase analysis the activations on Time Domain.
This process searches increasing trends of activities
according to channel based historic data. The second
phase analysis Spatial Domain. This process finds
active channels in comparison with neighboring
channels. The third phase takes the data combined
from Step 1 and Step 2 as input. It searches the
clustered channels by using DBSCAN algorithm. The
purpose of this step is to combine multiple suspected
consistent channels which are located closely to
eliminate false alarms.
2 METHOD
Expecting tunneling activities most likely will affect
more than one channel. It is a combination of
construction, observation and logistics events.
According to gathered intelligence and experience,
tunnels are made around 10 to 50 meters long and it
takes around 7 days to finish. And all tunneling
activities are made during the nighttime. In order to
detect tunneling activities, unclassified DAS sensor
alarms are used. In other words, every detection
above a certain threshold point is reported as alarm by
DAS equipment. The data have been collected from
Data Base of Active Border Patrol Command Control
Station. The data used here is from real environment,
real case. Collected data consists of 865 channels. As
Detecting Tunnels for Border Security based on Fiber Optical Distributed Acoustic Sensor Data using DBSCAN
79

a result, 103,949 alarm records are captured. Every
record has Date, Time, and Channel information. By
using time and date information, all alarm counts
have been calculated for each channel, on nighttime
duration. During development phase, the algorithm
has been implemented in VBA in Excel and
DBSCAN is implemented in Python (ver.3.7.3).
Spyder IDE is used over Anaconda and Pandas
installations. However, In Border Security System the
algorithm has been implemented in Java on Windows
10 OS. In real case is designed to operate on the server
which launches the algorithm on nightly bases with
latest data. It searches the Data Base and finds the
most active channels and executes the methods and
generates warnings.
The method consists of three phases (Fig. 3). The
first phase analyzes the activations on the Time
Domain. This process searches increasing trends of
activities according to channel based historic data.
The second phase analyzes Spatial Domain. This
process finds active channels in comparison with
neighboring channels. The third phase takes the data
combined from Step 1 and Step 2 as input. It searches
the dense clustered channels by using DBSCAN
algorithm. The purpose of this step is to combine
multiple suspected consistent channels which are
located closely to eliminate false alarms.
Figure 3: Phases of Method.
2.1 Time Domain Data Analysis
The purpose of this step is to detect highly active
channels according to its historic data. The Long-
Term Daily Average alarm counts are calculated as
reference point (1).
Averageᵣ=∑ᵢⁿAᵢ/n
r : Channel Number
n : Number of Days
i : Day Index
Aᵢ : Nightly Alarm Count for channel r
(1)
According to given information a typical tunnel
boring activity takes around seven days to finish.
Since the goal is to find tunnels before getting
finished shorter-term moving average should be less
than 7. Subsequently, the moving average of five days
is used as latest activity indicator. Alternatively,
tested shorter duration moving averages generated
faster results. However, shorter moving averages
increased false alarm rate. In contrast longer moving
averages generated delayed results of already finished
tunnels. According to experiments the moving
average of the five days is the best fit (2).
SMA5ᵣ: Last 5 Day Moving Average
SMA5ᵣ=∑ᵢ⁵Aᵢ/n
(2)
Both long term and short-term averages are used
to differentiate abnormal activity from usual activity
(3).
ARᵣ: Activation Rate of Channel r.
ARᵣ = (SMA5ᵣ- Averageᵣ) / Averageᵣ
(3)
ARᵣ is converted by sigmoid function (Nantomah,
2019) to limit the value in between -1 to 1 (Fig. 4).
The reason of this conversion is because some
channels can have big ARᵣ numbers because they
have very low activation history (Long Term
Activation Average) and small activations highly
increase their percentage. As a result, the sigmoid
function is used to limit the results of Activation Rate
for every channel (r) (4).
RALᵣ: Recent Activation Level.
X = ARᵣ
RALᵣ = 1/(1+1/eˣ)
(4)
The most active first 10% of channels is marked
as suspected channel. The Operator has privilege to
change channel status manually “Suspected” to
“Normal” or “Normal” to “Suspected” according to
their knowledge (Such as constructions, intelligence
etc.).
Figure 4: Sigmoid Function.
2.2 Spatial Domain Analysis
According to gathered field experience the alarm
count information may vary channel to channel due
to differentiations of environmental conditions.
SENSORNETS 2020 - 9th International Conference on Sensor Networks
80
Wind, river, earth types, rocks may affect each
channel to generate different numbers of alarms. For
example, wet earth absorbs some of the seismic
vibrations. On the other hand, a floating river may
cause more alarms around that region. The vibrating
camera holders and poles from wind is also another
factor. Installation differences of the cable also
creates differences on the field.
A discovery process is applied on each channel
location along with their local area statistics. The
reference frame should be large enough to encapsulate
sensing a possible boring tunnel. As a result, five
channels’ windows are used (maximum tunnel length
50m corresponds with 5 channels). Regional Average
is calculated as the number of alarms of every reference
window. RAᵣ: Regional Average.
Figure 5: Sliding Window of Channels.
RAᵣ is the Average Activation of 5 Channels
Window centered by channel r (5).
RAᵣ = ∑ᵢ⁵ Averageᵢ/5
(5)
Standard Deviation technique is used to compare
specific channel’s Recent Activation Rate against
reference window average (Fig. 5). Standard Deviation
method is a common approach in data classifying
(Kumar, Kuttiannan, 2006). Sigma measures how far
an observed data deviates from the average.
σᵣ: Standard Deviation for channel r
σᵣ=√ (∑ᵢ⁵ (RAᵣ-SMA5ᵣ)/4)
(6)
Most active 10% of the values lie within two
standard deviations of the mean, respectively. As a
result, to determine intrusion, values above 2 sigma
(> 2σ) are collected (Fig. 6). Even so all channels that
have a standard deviation less than 2σ are filtered out.
Others are used for further analysis.
2.3 DBSCAN Algorithm and
Clustering Channels
Previously, Time Domain Analysis finds the most
active channels according to their historic data. And
Spatial Domain Analysis finds the most active
channels according to their local area. The result of
these
two analysis has been merged in a table
Figure 6: Standard deviation distribution of Data Analysis.
consisting of the most active channels, in terms of
both time and location analysis.
In the literature, there are several extensive
reviews discussing intrusion detection approaches.
Kumar (Banerjee and Kumar, 2009) provided a recent
review of the intrusion detection problems,
techniques, and application areas. DBSCAN is a
clustering method that is used in machine learning to
separate clusters of high density from clusters of low
density. DBSCAN is a density-based clustering
algorithm, very effective way of seeking areas in the
data that have a high density of observations. The
main purpose of DBSCAN algorithm is to locate
regions of high density alarms that are separated from
one another by regions of low density alarms.
DBSCAN iteratively expands the cluster, by going
through each individual channels within the cluster,
and counting the number of other data points nearby
(Fig. 7). Following the definition of dense region, a
point can be classified as a Core Point if |N (p)|≥
MinPts (7). The Epsilon neighborhood of a point P in
the database D is defined as the following (referring
to the definition from Ester et.al. Ester, 1996).
N (p) = {q ∈ D | dist(p, q) ≤ ϵ}….
(7)
Figure 7: DBSCAN Core and Outlier points.
Detecting Tunnels for Border Security based on Fiber Optical Distributed Acoustic Sensor Data using DBSCAN
81
The Core Points, as the name suggests, lie usually
within the interior of a cluster. An outlier Point has
fewer than MinPts within its ϵ-neighborhood (N).
However, it lies in the neighborhood of another core
point. Noise is any data point that is neither core nor
outlier point.
In this paper DBSCAN algorithm is used to find
the high-density clusters based on statistical data and
location. Clusters with high density will be
considered as intrusion locations. As a result,
DBSCAN has been implemented in Python. The
Software takes the input produced by Excel in csv file
format basically a table consisting of three columns.
These are channel numbers, RAL (Recent Activation
Level), LAL (Local Area Activation Level). The
purpose of this phase is to find consistency in between
suspected channels by clustering DBSCAN
algorithm. Instead of using channel numbers,
geographic location data (latitude, longitude) can be
used in the future. The DBSCAN algorithm will
cluster dense channels with given parameters.
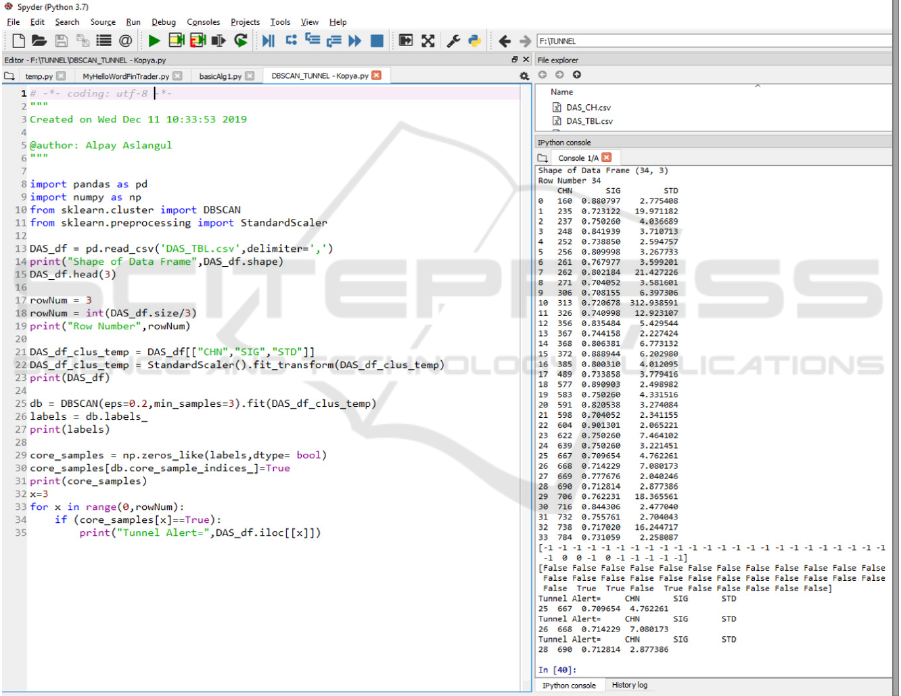
The LAL, RAL parameters of selected Channels`
are read from the csv file (marked as "SIG","STD" ,
"CHN" in the table and Python Code) as input. The
parameter settings of ϵ and MinPts are set to 0.3 and
3 respectively (noise is labelled as -1) (Fig. 8). The
algorithm find 1 cluster as the result which will be
further evaluated in section 3.
Figure 8: Python Code and results of DBSCAN.
3 RESULT
The algorithm has been implemented with real
environmental data acquired from South Turkish
Border. The collected data have 103,949 Alarm
Records (every record consists of Time, Date and
Channel Number) coming from 865 channels.
Methods are applied to data base alarm records. At
the first step “Time Domain Analysis” has detected
93 recently active channels. At the second step
“Spatial Domain Analysis” has detected 49 active
SENSORNETS 2020 - 9th International Conference on Sensor Networks
82

channels. At the third step these two data sets
combined in a table of suspicious 34 channel
candidates marked by both methods. The result of
DBSCAN algorithm is a cluster consisting of the
following channel numbers: 690, 668, and 667. The
Channel numbered 668, pinpoints the exact location
of a discovered tunnel at the border.
Figure 9: Tunnel found at Turkish Syria Border.
4 CONCLUSIONS
In this paper a data mining approach is presented to
detect tunnels under ground as a part of Smart Border
Security System (Svitek, Horak, Cheu and Ferregut,
2019). This method has three distinct phases. Time
Domain Data Analysis classifies acquired data
according to the most recent nightly activities. Spatial
Domain Data Analysis phase finds the active
channels according to their local statistics. And
finally, DBSCAN Algorithm is used to detect clusters
in the similar channels. The detection result with real
case and real data shows that data mining can help to
discover intrusion tunnels.
The major limitation in this work is both the lack
and difficulty to obtain real case data. Additionally,
using moving averages generates late results.
However, the border security system eventually will
accumulate tagged data for future usage, containing
the time domain and spatial domain analysis table.
This tagged data can be linked to a KNN based
machine learning algorithm as a future work (Amer
and Goldstein, 2012). There are new methods and
studies for intrusion detection. They could be
alternative to KNN (Ranjan and Sahoo, 2014 and
Yong, Guo-hong, Jia-xia 2010). Eventually, more
tagged data will allow the software to learn to detect
an intrusion by using a KNN algorithm according to
physical effort level needs to be done to make a tunnel
versus local geographical dynamics. This approach
also can be applied to other specific types of
intrusions such as identifying periodic smuggling
events, massive immigration events. On the other
hand, system can identify harmless events at border
such as agriculture activities. Those types of events
can be masked to reduce unnecessary false alarms.
Sensor fusion techniques will help to analyze other
type of sensor alarms such as motion detection alarms
generated by cameras, geophone seismic sensors, PIR
sensors, and radars. As a result, Smart Border
Security System Software nightly analyzes the latest
data and increase situational awareness by generating
high level alarms.
ACKNOWLEDGEMENTS
The author would like to thank the Turkish Army
Border Troops for the cooperation and support.
REFERENCES
Abbar, B., 2019. Optic Sensors for Environmental
Monitoring. SCITEPRESS.
Smith, J., 1998. The book, The publishing company.
London, 2
nd
edition.
Llopis J. L., Dunbar J. B., Wakeley D., Corcoran K., 2005.
Tunnel Detection Along the Southwest U.S. Border.
U.S. Army Engineer Research & Development Center.
Nibi, Menon, Amrita, Vidyapeetham, 2016. Underground
Tunnel Detection Across Border Areas. Center for
Wireless Networks and applications, India.
Duckworth, Owen, Worsley, Stephenson, 2013. OptaSense
distributed acoustic and seismic sensing performance
for multi-threat, multi-environment border monitoring.
OptaSense.
Arguedas, Mazzarella, Vespe, 2015. Spatio-temporal Data
Mining for Maritime Situational Awareness. European
Commission - Joint Research Centre (JRC).
Dorj, Altangerel, 2013. Anomaly Detection Approach using
Hidden Markov Model. MUST, CSMS/Computer
Science, Ulaanbaatar, Mongolia.
Chen, Li, 2011. Anomaly Detection Based on Enhanced
DBScan Algorithm.
Wang, Ren, Luo, Tian, 2019. NS-DBSCAN: A Density-
Based Clustering Algorithm in Network Space.
Nantomah, 2019. On Some Properties of Sigmoid Function.
Kumar, Kuttiannan, 2006. A Combined Standard Deviation
Based Data Clustering Algorithm. Government Arts
College.
Banerjee and Kumar, 2009, Anomaly Detection: A Survey.
Chandola V., Banerjee A., and Kumar V., 2009. Anomaly
Detection: A Survey, Journal of ACM Computing
Surveys.vol.41. no.3, article no.IS.
Detecting Tunnels for Border Security based on Fiber Optical Distributed Acoustic Sensor Data using DBSCAN
83

Ester M., Kriegel H., Sander J. and Xu X., 1996. A density
based algorithm for discovering clusters in large
spatial databases with noise,
Svitek M., Horak T., Cheu R. and Ferregut C., 2019. Smart
Border as a Part of Smart and Resilient El Paso.
Amer M. and Goldstein M., 2012. Nearest-Neighbor and
Clustering based Anomaly Detection Algorithms for
RapidMiner.
Ranjan R. and Sahoo G., 2014, A New Clustering Approach
for Anomaly Intrusion Detection.
Yong L., Guo-hong G., Jia-xia 2010 Li Xue-yong, Gao
Guo-hong, Sun Jia-xia A New Intrusion Detection
Method Based on Improved DBSCAN.
SENSORNETS 2020 - 9th International Conference on Sensor Networks
84
