
Eye-pointer Coordination in a Decision-making Task Under Uncertainty
Catia Cepeda
1,2
, Maria Camila Dias
1
, Dina Rindlisbacher
2,3
, Marcus Cheetham
2,3,∗
and Hugo Gamboa
1,∗
1
LIBPhys (Laboratory for Instrumentation, Biomedical Engineering and Radiation Physics),
Faculdade de Ciências e Tecnologia, Universidade Nova de Lisboa, Caparica, Portugal
2
Department of Internal Medicine, University Hospital Zurich, Zurich, Switzerland
3
University Research Priority Program "Dynamics of Healthy Aging", University Zurich, Zurich, Switzerland
hgamboa@fct.unl.pt
Keywords:
Eye-tracking, Pointer-tracking, Human Computer Interaction, Decision making, Uncertainty.
Abstract:
Eye-tracking (ET) systems, which capture eye movements, are often used to measure human behavior while
interacting with a user interface. Given the high costs and challenges of acquiring, installing and ensuring
good calibration of ET systems, the use of pointer (or mouse) tracking is gaining interest as a viable alter-
native in research on human-computer interaction. In this study, we measured and evaluated temporal and
spatial relationships between eye and pointer movements in a standardized task that allowed us to examine
the relationship between eye and pointer movements while participants made decisions under conditions of
high and low uncertainty. We collected data from N=81 participants and applied a range of metrics to a total
of 5205 decision trials. The overall findings show that the convergence between eye and pointer movements
is consistently high. Importantly, there are differences in levels of convergence depending on the temporal,
spatial and combined temporo-spatial metrics used. There are also differences in eye-pointer convergence
depending on the relative level of decision uncertainty in the task. In conclusion, the present findings favour
the use of pointer tracking to analyse human-computer interaction in more complex tasks.
1 INTRODUCTION
The individual style of interaction with a computer
can give insights into user experience, usability and
design of the user interface, and also about the users’
interests, preferences or personality (e.g., (Olson
and Olson, 2003; Dillon and Watson, 1996; Pocius,
1991)). The latter finding reflect the increasing in-
terest in understanding the influence of the user be-
haviour in human-computer interaction (HCI) (Dja-
masbi et al., 2008; Payne et al., 1988).
The eye-tracker (ET) technique is the usual ap-
proach for tracking human behavior since the mid-
1970s (Rayner, 1998). ET is thought to permit insight
into individuals’ cognitive states (Just and Carpenter,
1976; Olk and Kappas, 2011). A major drawback of
ET is the expensive equipment, challenges of calibra-
tion, and data loss. In addition, participants need to
be physically present for ET studies, which can lead
to smaller sample sizes (Chen et al., 2001; Rodden
and Fu, 2007).
∗
These authors have made an equal contribution.
More recently, several interesting approaches for
pointer tracking analysis have been developed. In
contrast to eye-tracking systems, pointer-tracking
data can be acquired easily and without extra equip-
ment. Taking into account that the results of both sys-
tems are similar, using x and y coordinates across the
screen, pointer-tracking is gaining interest as a viable
alternative to ET.
In the present study, we measured eye and pointer
movement, computed a range of metrics and evalu-
ated temporal and spatial relationships between eye
and pointer movements in a standardized decision
making task. This task, the Iowa Gambling Task
(IGT) (Bechara et al., 1994), allowed us to examine
these relationships while participants made decisions
under conditions of high and low uncertainty.
The IGT was originally devised as a well-
controlled laboratory simulation of real-life decision-
making under conditions of uncertainty. At the begin-
ning of the task, the participant is unfamiliar with the
probabilities of the negative and positive outcomes of
the different decision alternatives that are presented to
the participant. In the first phase of the task, the de-
30
Cepeda, C., Dias, M., Rindlisbacher, D., Cheetham, M. and Gamboa, H.
Eye-pointer Coordination in a Decision-making Task Under Uncertainty.
DOI: 10.5220/0008867500300037
In Proceedings of the 13th International Joint Conference on Biomedical Engineering Systems and Technologies (BIOSTEC 2020) - Volume 4: BIOSIGNALS, pages 30-37
ISBN: 978-989-758-398-8; ISSN: 2184-4305
Copyright
c
2022 by SCITEPRESS – Science and Technology Publications, Lda. All rights reserved

cision maker must search, explore and learn the pos-
sible contingencies of monetary gains and loss in or-
der to maximize the overall monetary outcome of the
task. In this sense the participant explores the task
contingencies and engages in decision making under
conditions of high uncertainty (cf. (White and Roth,
2009; Marchionini, 2006)). After gathering infor-
mation and acquiring an understanding of the task’s
reward and loss contingencies, participants learn to
maximize the overall monetary outcome and in effect
make decisions under conditions of higher certainty.
We use these phases of the task to differentiate and
analyse information search and decision making be-
havior under conditions of less compared with more
certainty. We examined whether there is a difference
in the temporal and spatial relationship between eye
gaze and pointer movements in the more uncertain
compared with the less uncertain phases of the task.
2 BACKGROUND
An issue associated with the eye-tracking equipment
is loss of calibration that can lead to missing miss-
ing data or deviation between the recorded and actual
eyed position. According to the context and task, it
is possible to correct this data. Hornof and Halverson
(2002) reported an approach that depends on required
fixation locations to re-calibrate the eye tracker. In
their experiment, it was required to click on a spe-
cific target and, assuming that the participant looks
at the target during the click, to determine if the dis-
tance between the eye-tracking data and the click was
higher than a certain threshold, the eye tracker would
be automatically recalibrated after the click. An al-
ternative technique consists of two linear regressions
(one for horizontal dimension - x-axis - and another
for vertical dimension - y-axis) between the known
data points and the corresponding raw data (Blignaut
et al., 2014).
In HCI, most authors attempt to find a relation-
ship between the eye movements and pointer move-
ments during web browsing using a computer mouse
(Chen et al., 2001; Cooke, 2006; Rodden and Fu,
2007; Rodden et al., 2008; Bieg et al., 2010; Huang
et al., 2011; Liebling and Dumais, 2014; Milisavljevic
et al., 2018), while others build predictive models of
the eye gaze based on mouse movements (Guo et al.,
2013; Huang et al., 2011; Navalpakkam et al., 2013).
A strong correlation between pointer position and
gaze position was found by Chen et al. (2001) in dif-
ferent styles of websites. The authors conclude that
when the mouse is moving to a meaningful region,
the eye gaze is very correlated with the pointer move-
ment. Cooke did in 2006 a similar approach, conclud-
ing that people move more the pointer while searching
information (Cooke, 2006).
Restricting the analysis, Rodden and Fu (2007)
considered the time spent in specific regions by
pointer and eye, finding proportions ranging from
25.8% and 59.9%. Later, in 2008, Rodden et al.
(2008) identified three patterns that seem to indicate
active mouse usage: following the eye vertically, fol-
lowing the eye horizontally, and marking a particular
result.
Whilst determining the influence of visual search
for a target in pointer-eye coordination, Bieg et al.
(2010) observed two behaviours: usually, the eye
reaches a targeted region before the mouse cursor
does, and if the participant knows the target location,
pointer movements begin without eye guidance. The
study of Liebling and Dumais (2014) also took into
account past experience on the interface in use, con-
cluding that the pointer and eye movements are not
coordinated during one-third of the time depending
on the type of target and familiarity with the task.
Some studies also followed a different approach
and, instead of comparing directly the eye and pointer
cursor, set up mouse features to predict gaze. A study
that improved the eye-pointer correlation using a vari-
ety of cursor behaviours and time-related pointer fea-
tures, also concludes that the future position of the
pointer has a strong correlation with the current eye
position (Huang et al., 2012). Navalpakkam et al.
(2013) predicted eye gaze with 67% accuracy using
mouse features and found a strong correlation be-
tween eye and pointer in areas of user main interest.
Believing that the relation between eye and pointer
movements is dependent on the task performed, Mil-
isavljevic et al. (2018) predicted the regions where the
pointer and eye are for different tasks with an accu-
racy of 70%.
The acquisition of eye-tracking data in the context
of the IGT has been mainly done to analyse pupil dila-
tion as a measure of cognitive effort and arousal dur-
ing the decision process (Fiedler and Glöckner, 2012;
Franco-Watkins and Johnson, 2011), as a marker for
uncertainty (Lavín et al., 2014) or as an anticipation
of disadvantage and advantageous decks (Simonovic
et al., 2017). Zommara et al. (2018) explored the exis-
tence of a gaze bias towards the chosen deck and con-
clude that this happens with or without using a mouse.
In contrast, pointer-tracking is increasingly being
used in psychological research, such as social cogni-
tion, decision-making and learning (for a review, see
(Freeman et al., 2011)). Some studies correlated the
mouse response dynamics with the subjects’ prefer-
ences (e.g. (Koop and Johnson, 2013; Chen and Fis-
Eye-pointer Coordination in a Decision-making Task Under Uncertainty
31

chbacher, 2016)). For example, Koop and Johnson
(2013) used the IGT and pointer-tracking and, using
metrics from mouse paths, showed that they could
reveal participants’ preferences for different decision
alternatives.
3 STUDY SETUP
3.1 Data Acquisition
To capture eye movements, we used a SMI Red250
eye tracker running IView software. The eye gaze
data file includes the person ID, the trial number, the
x and y position (in pixels) to where the right and left
eyes are looking, among other information.
The IGT was developed in Presentation software,
from Neurobehavioral Systems r and the pointer-
tracking data was being recorded to an independent
file in the local disk that is saved after the end of the
game. This file contains the person ID, the trial num-
ber, the x and y pointer’s position (in pixels) and time.
3.2 Participants
81 volunteers - 59 female and 22 male - participated
in this study, with ages between 16 and 34 years old.
Participants were students and recruited by mailing
list. All participants were native or fluent speakers of
Standard German, consistently right-handed (Annett,
1970). All were healthy, with normal, or corrected-
to-normal, vision, no record of neurological or psy-
chiatric illness and no current medication use. None
reported gambling problems. Written informed con-
sent was obtained before participation according to
the guidelines of the Declaration of Helsinki. Each
volunteer received 20 Swiss Francs for participation.
All participants were tested individually in a small,
sound-attenuated, dimly lit experimental room.
3.3 Task
The IGT (Bechara, 2007) is a widely explored task
that simulates the daily decision-making under condi-
tions of uncertainty. It is a card game with four decks
that differs in the amount of money that could be won
or lost. The game starts by giving the player a fic-
titious amount of money that should be increased as
much as possible. It covers 100 trials, which is un-
known to the player, and in each one of them, the
participant needs to choose one card out of four (by
clicking on it with the cursor). After each choice, it is
revealed the money won or lost. At a certain moment
of the IGT, the player should understand that there are
two advantageous decks (Buelow and Suhr, 2009).
3.4 Procedure
Participants attended a single testing session in a
quiet and comfortable laboratory room, lasting ap-
proximately 60 min. The experiment was conducted
in three phases: First, informed consent and demo-
graphic data were collected. Second, pointer data and
eye-tracking data were acquired during the IGT. Fi-
nally, subjects answered a questionnaire that is not re-
ported in the present study.
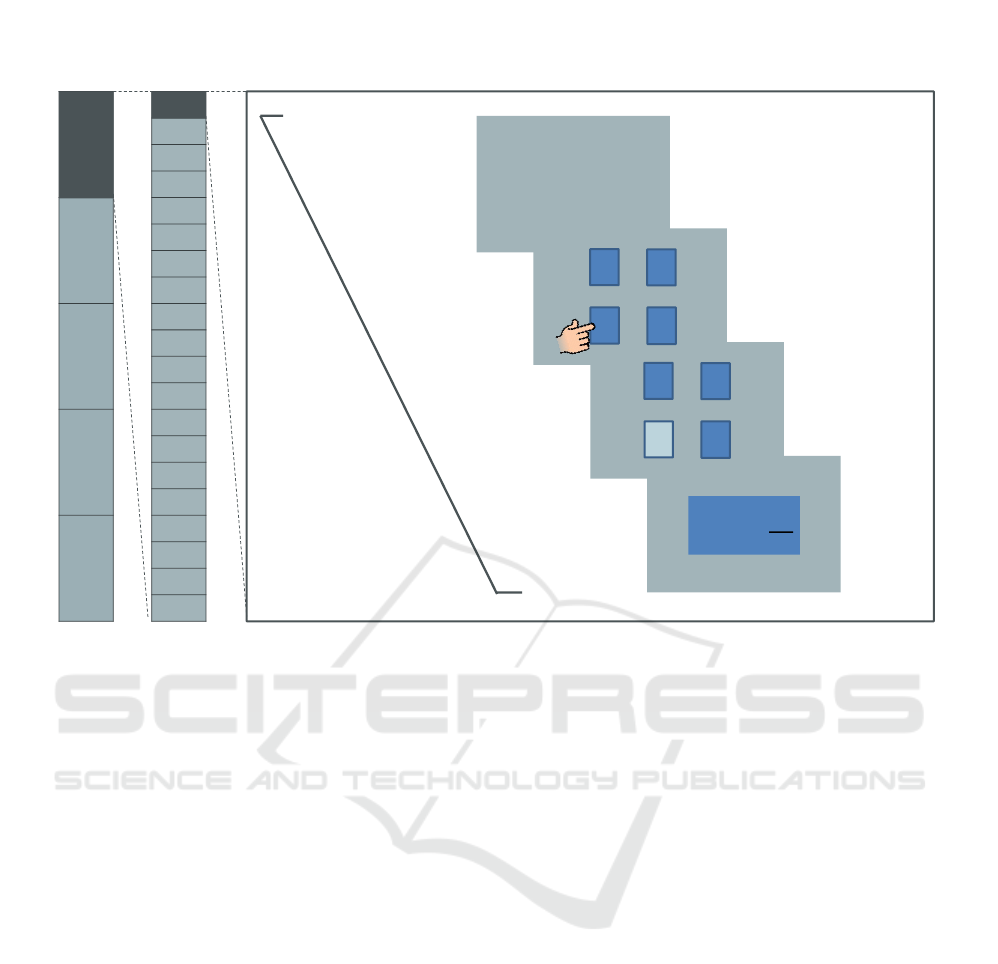
In Figure 1 is represented how the IGT was struc-
tured. As is conventionally done, a learning profile
during the IGT can be discerned from an examina-
tion of the card selections in blocks of 20 cards across
the 100 card choices (block 1, cards 1-20; block 2,
cards 21-40 ... block 5, cards 81-100). In each trial,
the participant is instructed to focus on the question
mark. After a brief moment, a set of four cards is
shown and the question mark is replaced by the cur-
sor, that is only available from this moment. The dis-
tribution of the decks on the screen was adjusted to
acquire the eye and pointer-tracking data, with two
decks at the top and two decks at the bottom. The par-
ticipant is told to choose a card from one of the decks
by pressing the mouse button on the corresponding
deck (choice phase). After choosing a card, a red
rectangle appeared around the deck chosen and the
cursor disappears. Only after 1.5 seconds the win and
punishment are shown as feedback. Participants are
told that the goal of the game is to maximize their
winnings and that they are free to switch from any
deck to another at any time. The participants began
with a loan of 2000 CHF. Participants had no knowl-
edge of the distribution of probability and magnitude
of gains and losses over the decks or how many trials
they must play.
4 PRE-PROCESSING
As already referred, a problem that arises in every
study involving eye-tracking data is due to equipment
losses of calibration. Given that we aim to compare
the pointer data and eye-tracking data, we considered
the trials of all subjects and just removed the pointer-
tracking data correspondent to the lost data of the
eye-tracking. The average percentage of lost data for
all subjects was 23.83% and the values range from
0.15% to 99.99%. Besides, 10.7% of the trials had
no data recorded. Using the remaining data, there
was still some eye-tracking data out-of-calibration.
BIOSIGNALS 2020 - 13th International Conference on Bio-inspired Systems and Signal Processing
32
?
1
3
2
4
+ 50
- 50
total: 1250
next trial
previous trial
700 ms
~1000 ms
1500 ms
1500 ms
1 trial
fixation
choice
anticipation
feedback
1
3
2
4
Block
1
Block
2
Block
3
Block
4
Block
5
Trial 1
Trial 2
Trial 3
Trial 4
Trial 5
Trial 6
Trial 7
Trial 8
Trial 9
Trial 10
Trial 11
Trial 12
Trial 13
Trial 14
Trial 15
Trial 16
Trial 17
Trial 18
Trial 19
Trial 20
Block
1
Trial 1
Figure 1: IGT schematic representation of the sequential phases of each trial and respective duration. The total game was
divided into 5 different blocks, each one with 20 trials. A trial was composed by four phases, the fixation, the choice while the
subject is deciding the deck he/she want to select, the anticipation phase to present the deck selected and, finally, the feedback
with the monetary win, loss and the current money.
The method applied in this work to correct the eye-
tracking data is an adaptation of the one presented by
Hornof and Halverson (2002).
In our experiment, this problem was essentially
solved with two linear regressions (one for X coor-
dinates and another for Y coordinates) between the
known data and the corresponding raw data in two
parts:
1. Adjustment of the eye-tracking data by translat-
ing the whole set of coordinates according to the
difference between a known fixation position and
its given position. The IGT was programmed to
have a question mark in the centre of the screen,
and then the cursor replace the mark. This forces
the player to look initially to the middle of the
screen and therefore, having the initial position of
the eye-tracking for each player able us to trans-
late the x and y axes. This procedure requires the
correct acquisition of the initial fixation of the eye,
otherwise, the calibration can not be done and the
respective trial should not be considered. 9.5% of
the initial trials have no fixation at the beginning
and, consequently, they were not considered.
2. Adjustment of the eye-tracking data by scaling a
known distance. It was assumed that when the
participant clicks in a target, he tends to look at
it. The distance between the pointer and eye coor-
dinates during the click (the choice of the deck)
was accessed for each trial. The ratio between
the pointer and eye coordinates in the moment of
the click was computed and multiplied to the eye-
tracking data (this method was based on (Hornof
and Halverson, 2002)). This step is only applied
if, after the first step, the distance between eye and
pointer at the click time was higher than 80 pixels.
This procedure requires the correct acquisition of
the final fixation of the eye, otherwise no conclu-
sion can be made and this trial should not be con-
sidered. 5% of the trials resulted from the first cal-
ibration have no fixation during the time of click-
ing and, consequently, were not considered. More
than 60% of the trials had not the final fixation
near the click area, so these trials were calibrated.
Figures 2 and 3 are an example of a trial that, to
be correctly compared to mouse movements, have
to be calibrated.
Even with the application of the two-phased lin-
ear regression, some trials still have not suitable eye
gaze data. To remove this data, the ratio between the
amount of data outside the region of interest (the cen-
Eye-pointer Coordination in a Decision-making Task Under Uncertainty
33
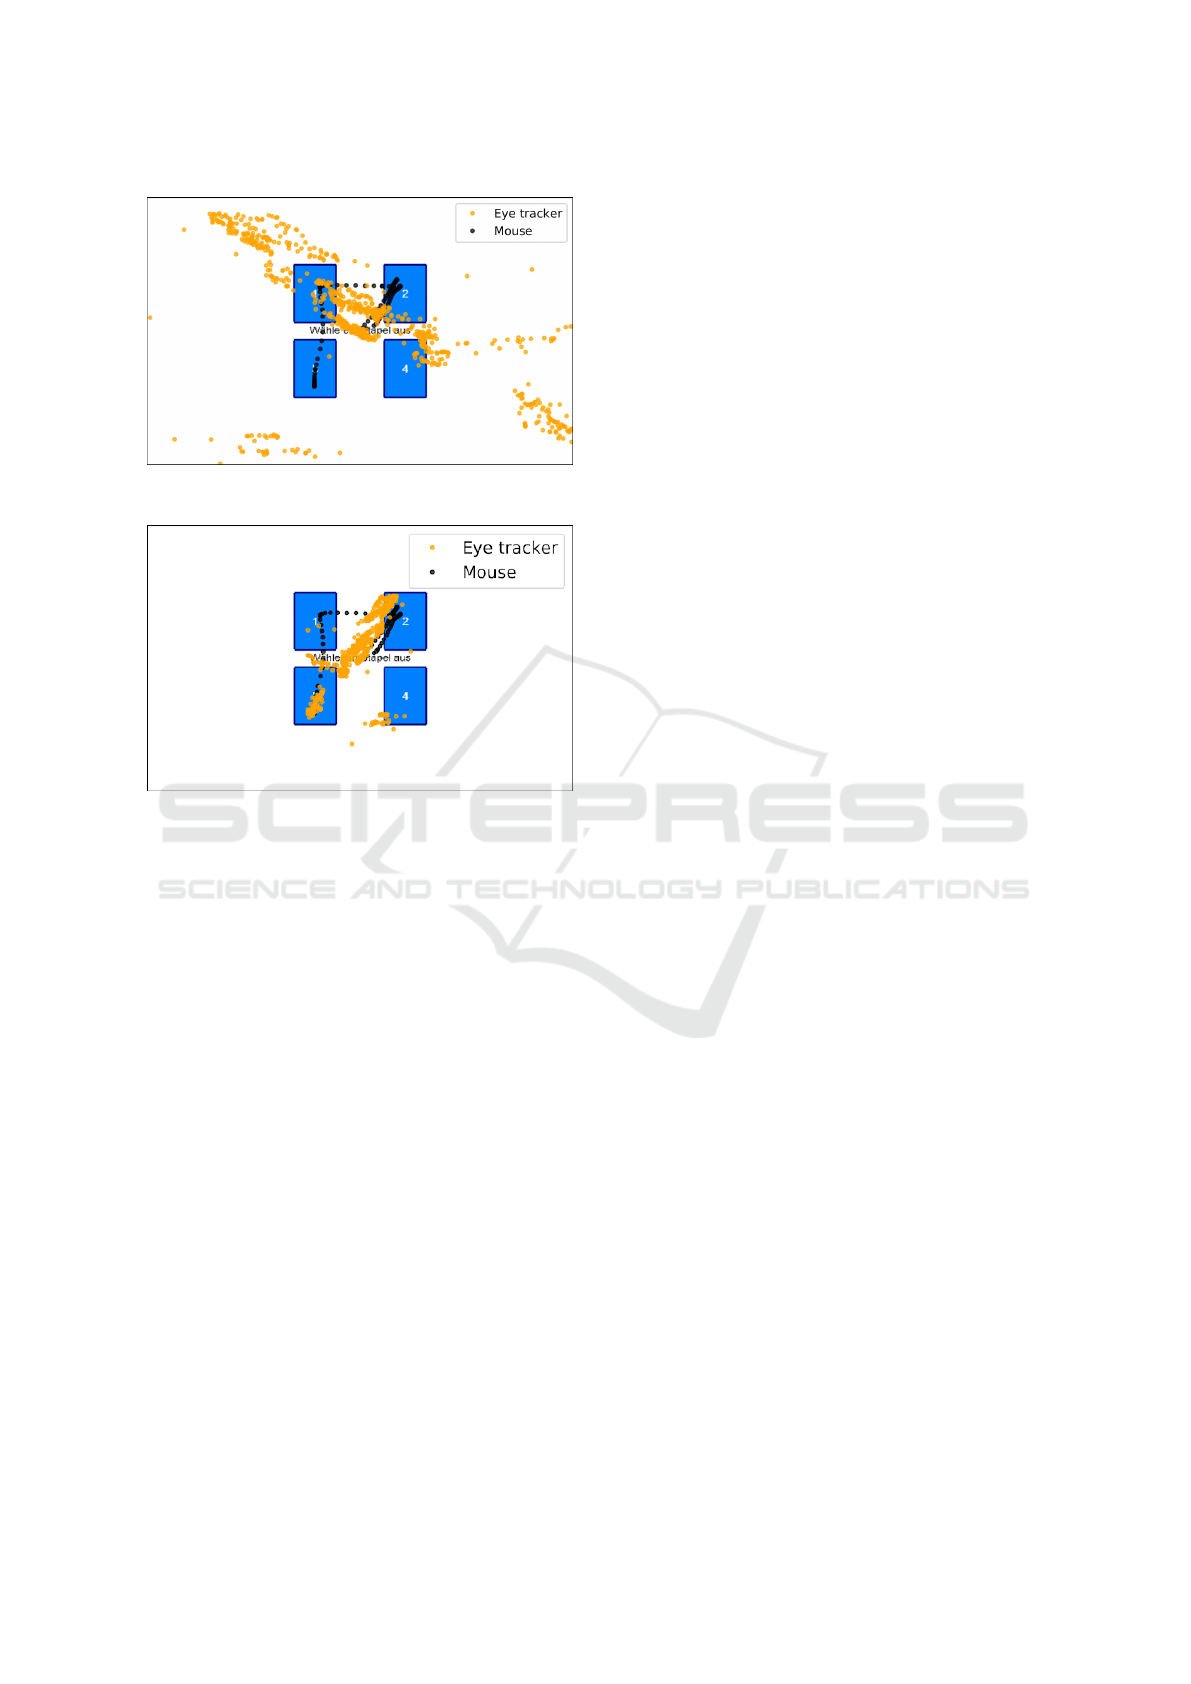
Figure 2: Example of a trial before calibration.
Figure 3: Example of a trial after calibration.
tral square where the decks are) and the total data -
outside ratio - was computed. 11.2% of trials were
discarded with this procedure, considering a thresh-
old higher than 20% of outside ratio.
A difference between this method to correct eye-
tracking data and the approaches presented in other
studies (for example, (Chen et al., 2001)) is this elim-
ination of the trials that, after the correction, are still
uncalibrated. If this procedure had been done in the
data without calibration 89.1% of the trials would be
eliminated. This process of calibration reduced our
dataset from 8100 trials to 5205.
5 COMPARISON METRICS AND
RESULTS
To compare the eye gaze and cursor movements dur-
ing a decision-making task, some measures were
computed to take into consideration the spatial and
temporal domain. With this purpose, it was consid-
ered a few regions inside the IGT - each deck consti-
tuted a region and the last region was constituted by
the space outside the decks. Two of the metrics cal-
culated, spatial coordination and temporal coordina-
tion, were adapted from Chen et al. (2001) and Rod-
den and Fu (2007). Another variable was introduced,
temporal-spatial coordination, to assess the amount of
time that the eye gaze and the cursor were visiting the
same region.
5.1 Spatial Coordination (SC)
Independent of time, this feature only evaluate if, dur-
ing a trial, the participant had a consistent interest in
the regions manifested both by pointer and eye move-
ments. This feature is the ratio between the number
of regions that were visited by both eye gaze and cur-
sor and the total number of regions visited by eye or
pointer, according to which of the two visited more
regions.
The considered regions were ”Deck 1”, ”Deck 2”,
”Deck 3” and ”Deck 4”. Region ”Outside the decks”
was not considered since it is a region visited by both
eye gaze and cursor in almost all trials, and, therefore,
the ratio would increase significantly due to a region
which is nearly compulsory to visit. For example, to
go from a deck to another, it is required to visit the
region ”Outside the decks”, as well as at the beginning
of each trial, where the participants were instructed to
focus on the middle of the screen.
In terms of possibilities, if the eye gaze and cursor
visited the exactly same decks, this ratio has its max-
imum value of 1. A more specific example, if in a
certain trial the eye gaze visited ”Deck 1” and ”Deck
4” and the pointer visited only the ”Deck 4”, the value
of this relation would be 0.5.
The mean value of all trials for each participant
was determined. The values range from 0.00 to 1.00
and the mean value and its standard deviation are
0.78 ± 0.29. In our study, it was only considered, for
the eye gaze, the regions visited for more than 60 ms,
which corresponds the minimum fixation duration ac-
cording to SMI (2010).
5.2 Temporal Coordination (TC)
In contrast with the previous feature described, the
one extracted from temporal coordination takes into
account the time spent in each region by the eye gaze
and by the cursor. For each trial, it is calculated the to-
tal duration spent by the pointer and eye gaze in each
region, to then find the correlation between these two
measurements (Rodden and Fu, 2007). This correla-
tion was calculated for each region and this feature is
the result of its mean. Here, in addition to the decks’
area, also the area outside the decks is important to be
considered as a region. The correlation was measured
by the Pearson correlation coefficient, which mea-
BIOSIGNALS 2020 - 13th International Conference on Bio-inspired Systems and Signal Processing
34
sures the linear relationship between the two datasets.
It varies between -1 and +1, with the extremes im-
plying the strongest linear relationships (negative and
positive, respectively) and 0 indicating no correlation
(Sedgwick, 2012).
The times’ correlation coefficient ranges from
0.59 to 0.84, with a mean value and a standard de-
viation of 0.66 ± 0.09.
5.3 Temporal-Spatial Coordination
(TSC)
This variable covers the spatial information and the
temporal information, quantifying the ratio between
the time where the eye gaze and the cursor were in
the same region and the trial time. Similar to tempo-
ral coordination, this feature also considered the five
regions mentioned above. The mean value of all tri-
als was calculated and the values range from 0.00 to
1.00 with a mean value and a standard deviation of
0.65 ± 0.19.
5.4 High and Low Uncertainty
Conditions
When the participants know in advance the deck that
will be selected, they make a fast decision. There-
fore eye and mouse move directly from the centre
of the screen to the chosen deck. In this condition,
both movements should highly correlate. In contrast,
when the participants explore the options and waver
between different decks, those movements may not
be correlated. To differentiate these two conditions,
the less uncertain condition is established when the
eye gaze and the cursor only visit one region, and the
more uncertain condition is verified in the other tri-
als, in which the eye gaze and/or cursor examine more
than one deck. In our data set, 62% of the trials rep-
resent the low uncertainty condition.
The three metrics previously presented were as-
sessed for these two conditions and the results are
presented in Tables 1 and 2. As expected, the results
show a higher correlation between the eye and pointer
movements in non-exploratory condition. Neverthe-
less, although spatial coordination shows a decrease
of 48% from non-exploratory to exploratory trails, the
decline is inferior for temporal coordination (22%)
and temporal-spatial coordination (16%). This means
that the time spent by the eye gaze and cursor in the
same regions is comparable in both conditions, but
the visited regions diverge in the exploratory condi-
tion. This suggests that the common regions visited
by both pointer and eye gaze are the ones where the
participant spends the most of the time, and there are
regions that the eye gaze rapidly visits, and the cursor
does not visit at all.
Table 1: Relation between eye and pointer movements for
non-exploratory condition.
Mean STD Min Max
SC 0.97 0.17 0.00 1.00
TC 0.81 0.05 0.76 0.90
TSC 0.71 0.17 0.01 0.99
Table 2: Relation between eye and pointer movements for
exploratory condition.
Mean STD Min Max
SC 0.49 0.16 0.00 1.00
TC 0.59 0.11 0.48 1.00
TSC 0.55 0.18 0.00 0.97
6 CONCLUSIONS
The presented study compared eye and mouse move-
ments during a decision task to understand whether
pointer-tracking could serve as a useful alternative to
eye-tracking for assessing user behavior.
To ensure correct analysis and comparison of eye
and pointer data, it was necessary to resolve calibra-
tion issues and eye drift in the eye gaze data. The
design of the IGT in this study allowed us to deter-
mine the initial and final eye fixation in each trial and
therefore, to spatially correct the recorded eye posi-
tions within each decision trail. By applying this pro-
cedure, we were able to use 65% instead of just 11%
of the eye data in further analyses.
Our three approaches for evaluating the coordina-
tion between eye and pointer movements are consis-
tently high. Spatial coordination has a higher mean
correlation, which is in line with previous studies
that reported a stronger correlation of eye and mouse
movements in areas of interest and not necessarily
moving at the same time (Huang et al., 2011; Naval-
pakkam et al., 2013; Bieg et al., 2010). Still, the tem-
poral coordination is higher than the correlations re-
ported in previous studies (Rodden and Fu, 2007).
Regarding the relationship between eye and cur-
sor trajectories in conditions of higher and lower un-
certainty, the developed work demonstrated that there
is a high correlation when uncertainty is low. Never-
theless, when a person hesitates between different de-
cision alternatives this correlation decreases and, con-
trary to what was expected, the results of the temporal
coordination is higher than spatial coordination. This
could mean that in uncertain trials the pointer move-
ment in the area of interest is relatively consistent with
gaze.
Eye-pointer Coordination in a Decision-making Task Under Uncertainty
35

The temporal-spatial coordination, as a combina-
tion of coordination metrics, gives a clear picture of
the convergence between eye and mouse movements.
The level of correlation is somewhat lower in less un-
certain conditions. Nevertheless, the findings support
the idea that pointer tracking may be useful as an al-
ternative to eye-tracking.
REFERENCES
Annett, M. (1970). A classification of hand preference by
association analysis. Br. J. Psychol., 61:303–321.
Bechara, A. (2007). Iowa Gambling Task: Professional
Manual. Lutz, FL: Psychological Assessment Re-
sources, Inc.
Bechara, A., Damasio, A. R., Damasio, H., and Anderson,
S. W. (1994). Insensitivity to future consequences fol-
lowing damage to human prefrontal cortex. Cognition,
50:7–15.
Bieg, H.-J., Chuang, L. L., Fleming, R. W., Reiterer, H., and
Bülthoff, H. H. (2010). Eye and pointer coordination
in search and selection tasks. In Proceedings of the
2010 Symposium on Eye-Tracking Research & Appli-
cations - ETRA ’10, page 89, New York, New York,
USA. ACM Press.
Blignaut, P., Holmqvist, K., Nyström, M., and Dewhurst,
R. (2014). Improving the accuracy of video-based
eye tracking in real time through post-calibration re-
gression. In Current Trends in Eye Tracking Re-
search, pages 77–100. Springer International Publish-
ing, Cham.
Buelow, M. T. and Suhr, J. A. (2009). Construct validity of
the Iowa gambling task.
Chen, F. and Fischbacher, U. (2016). Response time and
click position: cheap indicators of preferences. Jour-
nal of the Economic Science Association, 2(2):109–
126.
Chen, M. C., Anderson, J. R., and Sohn, M. H. (2001).
What can a mouse cursor tell us more? In CHI ’01 ex-
tended abstracts on Human factors in computing sys-
tems - CHI ’01, page 281, New York, New York, USA.
ACM Press.
Cooke, L. (2006). Is the Mouse a "Poor Man’s Eye
Tracker"? In Proceeding of the 53rd Annual Con-
ference of the Society for Technical Communication,
pages 252–255.
Dillon, A. and Watson, C. (1996). User analysis in HCI -
The historical lessons from individual differences re-
search. International Journal of Human Computer
Studies, 45(6):619–637.
Djamasbi, S., Tulu, B., Loiacono, E., and Shitefleet-Smith,
J. (2008). Can a Reasonable Time Limit Improve
the Effective Usage of a Computerized Decision Aid?
Communications of the Association for Information
Systems, 23(22):393–408.
Fiedler, S. and Glöckner, A. (2012). The dynamics of deci-
sion making in risky choice: An eye-tracking analysis.
Frontiers in Psychology, 3(OCT):335.
Franco-Watkins, A. M. and Johnson, J. G. (2011). Decision
moving window: using interactive eye tracking to ex-
amine decision processes. Behavior Research Meth-
ods, 43(3):853–863.
Freeman, J. B., Dale, R., and Farmer, T. A. (2011). Hand in
motion reveals mind in motion.
Guo, Q., Jin, H., Lagun, D., Yuan, S., and Agichtein, E.
(2013). Mining touch interaction data on mobile de-
vices to predict web search result relevance. In Pro-
ceedings of the 36th international ACM SIGIR con-
ference on Research and development in information
retrieval - SIGIR ’13, page 153.
Hornof, A. J. and Halverson, T. (2002). Cleaning up sys-
tematic error in eye-tracking data by using required
fixation locations. Behavior Research Methods, In-
struments, and Computers, 34(4):592–604.
Huang, J., White, R., and Buscher, G. (2012). User see,
user point. In Proceedings of the 2012 ACM annual
conference on Human Factors in Computing Systems
- CHI ’12, page 1341.
Huang, J., White, R. W., and Dumais, S. (2011). No clicks,
no problem. In Proceedings of the 2011 annual con-
ference on Human factors in computing systems - CHI
’11, page 1225, New York, New York, USA. ACM
Press.
Just, M. and Carpenter, P. (1976). Eye fixations and cogni-
tive processes. Cognitive Psychology, 8(4):441–48.
Koop, G. J. and Johnson, J. G. (2013). The response dy-
namics of preferential choice. Cognitive Psychology,
67(4):151–185.
Lavín, C., San Martín, R., and Rosales Jubal, E. (2014).
Pupil dilation signals uncertainty and surprise in a
learning gambling task. Frontiers in Behavioral Neu-
roscience, 7:218.
Liebling, D. J. and Dumais, S. T. (2014). Gaze and mouse
coordination in everyday work. In Proceedings of the
2014 ACM International Joint Conference on Perva-
sive and Ubiquitous Computing Adjunct Publication -
UbiComp ’14 Adjunct, pages 1141–1150, New York,
New York, USA. ACM Press.
Marchionini, G. (2006). Exploratory search. Communica-
tions of the ACM, 49(4):41.
Milisavljevic, A., Hamard, K., Petermann, C., Gosselin, B.,
Doré-Mazars, K., and Mancas, M. (2018). Eye and
Mouse Coordination During Task: From Behaviour to
Prediction. In Proceedings of the 13th International
Joint Conference on Computer Vision, Imaging and
Computer Graphics Theory and Applications, pages
86–93. SCITEPRESS - Science and Technology Pub-
lications.
Navalpakkam, V., Jentzsch, L., Sayres, R., Ravi, S., Ahmed,
A., and Smola, A. (2013). Measurement and model-
ing of eye-mouse behavior in the presence of nonlin-
ear page layouts. In Proceedings of the 22nd inter-
national conference on World Wide Web - WWW ’13,
pages 953–964.
Olk, B. and Kappas, A. (2011). Eyetracking as a Tool
for Visual Research. In Margolis, E., Pauwels, L.
(eds) The Sage Handbook of Visual Research Meth-
ods, pages 433–51. Los Angeles: Sage.
BIOSIGNALS 2020 - 13th International Conference on Bio-inspired Systems and Signal Processing
36

Olson, G. M. and Olson, J. S. (2003). Human-Computer
Interaction: Psychological Aspects of the Human
Use of Computing. Annual Review of Psychology,
54(1):491–516.
Payne, J. W., Bettman, J. R., and Johnson, E. J. (1988).
Adaptive Strategy Selection in Decision Making.
Journal of Experimental Psychology: Learning, Mem-
ory, and Cognition, 14(3):534–552.
Pocius, K. E. (1991). Personality factors in human-
computer interaction: A review of the literature. Com-
puters in Human Behavior, 7(3):103–135.
Rayner, K. (1998). Eye movements in reading and informa-
tion processing: 20 years of research. Psychological
bulletin, 124(3):372–422.
Rodden, K. and Fu, X. (2007). Exploring how mouse move-
ments relate to eye movements on web search results
pages. In Special Interest Group on Information Re-
trieval Workshop on Web Information Seeking and In-
teraction, pages 29–32.
Rodden, K., Fu, X., Aula, A., and Spiro, I. (2008). Eye-
mouse coordination patterns on web search results
pages. In Proceeding of the twenty-sixth annual CHI
conference extended abstracts on Human factors in
computing systems - CHI ’08, page 2997, New York,
New York, USA. ACM Press.
Sedgwick, P. (2012). Pearson’s correlation coefficient.
Simonovic, B., Stupple, E. J., Gale, M., and Sheffield, D.
(2017). Stress and Risky Decision Making: Cognitive
Reflection, Emotional Learning or Both. Journal of
Behavioral Decision Making, 30(2):658–665.
SMI (2010). Begaze manual.
White, R. W. and Roth, R. A. (2009). Exploratory Search:
Beyond the Query-Response Paradigm. Synthesis
Lectures on Information Concepts, Retrieval, and Ser-
vices, 1(1):1–98.
Zommara, N. M., Takahashi, M., Ounjai, K., and Lauw-
ereyns, J. (2018). A gaze bias with coarse spatial in-
dexing during a gambling task. Cognitive Neurody-
namics, 12(2):171–181.
Eye-pointer Coordination in a Decision-making Task Under Uncertainty
37
