
Approximate Conditional Independence Test using Residuals
Shinsuke Uda
a
Medical Institute of Bioregulation, Kyushu University, 3-1-1 Maidashi Higashi-ku Fukuoka 812-8582, Japan
Keywords:
Information Theory, Conditional Mutual Information, Permutation Test, Biological Data Analysis.
Abstract:
Conditional mutual information is a useful measure for detecting the association between variables that are
also affected by other variables. Though permutation tests are used to check whether the conditional mutual
information is zero to indicate mutual independence, permutations are difficult to perform because the other
variables in a dataset may be associated with the variables in question. This problem is particularly acute
when working with datasets of small sample size. This study aims to propose a computational method for
approximating conditional mutual information based on the distribution of residuals in regression models. The
proposed method can implement the permutation tests for statistical significance by translating the problem
of measuring conditional independence into the problem of estimating simple independence. Additionally,
a reliability of p-value in permutation test is defined to omit unreliably detected associations. We tested
our proposed method’s performance in inferring the network structure of an artificial gene network against
comparable methods submitted to the Dream4 challenge.
1 INTRODUCTION
Recent progress in the field of information technology
has made the analysis of high-dimensional datasets
possible with novel analytic techniques. However,
these techniques remain in development stage due to
some problems faced to the curse of dimensional-
ity (Hastie et al., 2001). When three variables may
be dependent on each other, we may want to ex-
amine the associations between variables X and Y
while ignoring the effects of Z, which apparently
boosts/depresses association. The dataset is of high
dimension and X ⊂ ℜ, Y ⊂ ℜ and Z ⊂ ℜ
m
are con-
tinuous random variables. Conditional mutual infor-
mation is a statistically robust measure to quantify the
association between variables while removing the ef-
fects of other variables, without assuming a particular
model distribution. X and Y are conditionally inde-
pendent given Z if and only if the conditional mutual
information between X and Y given Z is zero, and
vice versa. Conditional independence can serve as a
measure to infer the network structure of associations
between variables (Pearl, 2009). Perfect conditional
independence between X and Y given Z indicates that
no edge connects nodes X and Y . In inference net-
works, in most of the cases, it is assumed that the
dimensions of X and Y are one, therefore, hereafter,
a
https://orcid.org/0000-0001-6221-3587
we will assume it. While conditional mutual infor-
mation has theoretical advantages, there are two dif-
ficulties for inferring network from finite sample size
datasets. First, estimating conditional mutual infor-
mation is computationally difficult if the dimension of
Z is high, even if X and Y are one-dimensional. Sec-
ond, though conditional independence is detected by
examining whether conditional mutual information is
zero or not, the conditional mutual information esti-
mated from a dataset with finite sample size is rarely
zero due to statistical errors, even if the variables are
conditionally independent.
To infer the associations in high-dimension net-
works, statistical tests must be employed to examine
whether the conditional mutual information is close
to zero or not. A permutation test is a powerful strat-
egy for this analysis and involves generating the ex-
pected data distribution of the null hypothesis with-
out making any assumptions about the distribution of
the actual data. Permutations are not easy to apply
for examining the conditional independence between
X and Y given Z, because Z may be associated with
X and/or Y , and the permutations of X and Y ignore
the influence of Z. This problem can be addressed by
grouping the data in resampling, but this approach re-
quires a large sample. This article proposes a compu-
tational method for approximating conditional mutual
information. The method translates the test for condi-
tional independence with a simple independence test
Uda, S.
Approximate Conditional Independence Test using Residuals.
DOI: 10.5220/0008866102970304
In Proceedings of the 12th International Conference on Agents and Artificial Intelligence (ICAART 2020) - Volume 2, pages 297-304
ISBN: 978-989-758-395-7; ISSN: 2184-433X
Copyright
c
2022 by SCITEPRESS – Science and Technology Publications, Lda. All rights reserved
297

using the distribution of residuals in regression mod-
els of X or Y against Z. With this translation of the
problem, permutations can be used to isolate the as-
sociations between X and Y. Additionally, a reliabil-
ity of p-value in permutation test is defined to omit
unreliably detected associations.
The biological datasets compiled in recent years
are of high dimension, because of technological de-
velopments in measurement techniques that allow
the measurement of greater numbers of molecular
species. The structure of associations between molec-
ular species can be expressed as a regulatory network
when seeking insight into biological phenomena. To
test our proposed analytic method with a widely avail-
able dataset, the method was used to infer the ar-
tificial gene network structure in the Dream4 chal-
lenge dataset (Schaffter et al., 2011). Next, Section
2 presents related works including comparable meth-
ods of gene network inference, Section 3 introduces
the proposed method for approximating conditional
mutual information, Section 4 discusses the results of
artificial gene network inference, and Section 5 con-
cludes the paper.
2 RELATED WORK
Mutual information
I(X;Y ) =
Z
dxdy p(x, y)log
p(x, y)
p(x)p(y)
,
is a statistical measure to quantify association be-
tween X and Y . Mutual information combining with
permutation test is a promising method to examine
statistical dependence between variables and applied
to analyzing gene expression data sets(Daub et al.,
2004). Conditional mutual information
I(X;Y |Z) =
Z
dxdydz p(x, y,z)log
p(x, y|z)
p(x|z)p(y|z)
,
is a statistical measure to quantify association be-
tween X and Y given Z removing the effect of other
variables Z. Therefore, conditional mutual informa-
tion would be a more suitable measure to infer di-
rect association than mutual information. However,
estimating conditional mutual information is com-
putationally difficult if the dimension of Z is high,
and permutations are not easy to apply for examining
conditional independence, in general. The proposed
method enables us to examine conditional indepen-
dence by permutation test and applied to inference of
gene network.
A number of methods to infer gene network were
reported. ARACNE (Margolin et al., 2006) and
CLR (Faith et al., 2007) are network-inference meth-
ods based on information theoretic approach. Both
determine the presence of an edge between nodes
by calculating the mutual information of the two
nodes. ARACNE employs data-processing inequal-
ities to eliminate weakest associations in every closed
triplet of nodes. The procedure would be exact if the
network structure was a tree. On the contrary, CLR
compares each value of mutual information between
nodes to the empirically determined distribution of all
the mutual information values between pairs of nodes.
CLR is designed around the assumption that the em-
pirical distribution provides background information
about the absence of edges. GEne Network Inference
with Ensemble of Trees (GENIE3) (Irrthum et al.,
2010) uses a tree-based method combining with boot-
strap method and feature selection. TIGRESS uses
least angle regression (LARS) (Haury et al., 2012),
which is a sparse regression method, with stability se-
lection. NIMEFI (Ruyssinck et al., 2014) takes an
ensemble approach to combine the results of regres-
sions with feature selection such as support vector re-
gression and the elastic net. PLSNET (Guo et al.,
2016) uses PLS-based feature selection with an en-
semble technique.
3 METHODS
3.1 Approximation of Conditional
Mutual Information
Suppose continuous random variables X,Y ∈ ℜ,Z ∈
ℜ
N−2
. We can compute the conditional mutual in-
formation I(X;Y |Z). The conditional expectation and
standard deviation are written as
m
(·)
(z) = E[(·)|Z = z], σ
(·)
(z) =
p
Var[(·)|Z = z].
We write X and Y as
X = m
x
(Z) + σ
x
(Z)ε, Y = m
y
(Z) + σ
y
(Z)η, (1)
using random variables ε, η.
The entropy function is defined as
H(X) = −
Z
dxp(x)log p(x).
The following relations hold (see Appendix).
H(X + f (Z)|Z) = H(X|Z ), (2)
H( f (Z)X|Z) = H(X |Z) + E
Z
[log f (Z)] . (3)
f is an arbitrary continuous function and E
Z
[(·)] indi-
cates expectation of (·) with respect to the distribution
of Z. Equations (1)-(3) yield I(X;Y |Z) = I(ε; η|Z).
ICAART 2020 - 12th International Conference on Agents and Artificial Intelligence
298

Furthermore, we find I(ε;η|Z) = I(ε;η) − I(ε;η;Z).
Finally,
I(X;Y |Z) = I(ε; η) − I(ε;η; Z), (4)
results. The multivariate mutual information (McGill,
1954) is defined as
I(ε; η;Z) = H(ε, η) + H(ε, Z) + H(η,Z)
− (H(ε) + H(η) + H(Z) + H(ε, η, Z)).
One can see that I(ε; η; Z) corresponds to the inter-
section of the uncertainties of ε, η and Z. Thus, if
we find values of ε and η that give I(ε;η; Z) = 0, the
conditional mutual information I(X;Y |Z) is equiva-
lent to the mutual information I(ε; η). This translation
of conditional mutual information into mutual infor-
mation avoids any integral with respect to Z. In other
words, if I(ε; η; Z) = 0 holds, we have:
ε ⊥ η ⇔ X ⊥ Y |Z.
The upper bound of I(ε; η;Z) is
|I(ε; η;Z)| ≤ min{I(ε;Z),I(η; Z),
I(ε; η),I(ε;Z|η), I(η; Z|ε), I(ε; η|Z)}. (5)
Instead of evaluating I(ε; η; Z), we evaluate sufficient
condition
I(ε; Z) or I(η; Z) = 0 ⇒ I(ε;η; Z) = 0. (6)
Note that I(ε;Z) or I(η;Z) = 0 is a sufficient, but not
necessary, condition for I(ε;η; Z) = 0. In particular,
if ε and η follow a Gaussian distribution with corre-
lation ρ which is equivalent to partial correlation be-
tween X and Y , we have
I(X;Y |Z) = −
1
2
log
1 − ρ
2
.
3.2 Heteroscedastic Kernel Ridge
Regression (HKRR)
We suppose that the conditional distribution of X
given Z can be approximated as a Gaussian distribu-
tion,
p(X|Z = z) =
exp
h
−
1
2σ
2
x
(z)
(x − m
x
(z))
i
p
2πσ
2
x
(z)
. (7)
Once we obtain m
x
(z),σ
x
(z) from the dataset D ≡
{x
i
,y
i
,z
i
}
n
i=1
by Heteroscedastic Kernel Ridge Re-
gression (HKRR) (Cawley et al., 2004), we have
ε
i
=
x
i
− m
x
(z
i
)
σ
x
(z
i
)
. (8)
m
x
(z),σ
x
(z) is inferred by solving the minimization
problem of the negative log-likelihood function of (7)
−log
∏
i
p(x
i
|z
i
) =
∑
i
(x
i
− m
x
(z
i
))
2
2σ
2
x
(z
i
)
+ log σ
x
(z
i
). (9)
The constant term can be ignored. m
x
(z),log σ
x
(z) are
written as
m
x
(z) =
∑
i
α
m
x
i
K
m
x
(z,z
i
) + b
m
x
,
logσ
x
(z) =
∑
i
α
σ
x
i
K
σ
x
(z,z
i
) + b
σ
x
.
The parameters α
m
x
,α
σ
x
,b
m
x
,b
σ
x
and kernel matrix
K
(·)
(z,z
0
) = hφ
(·)
(z),φ
(·)
(z
0
)i, are defined by the ker-
nel function regarding the basis function φ. The
function φ maps the data vector z onto the high-
dimensional feature space F , that is, φ
(·)
: Z →
F . h(·),(∗)i represents the inner product between
(·) and (∗). We can find ε by solving the min-
imization problem in (9) and determining the pa-
rameters α
m
x
,α
σ
x
,b
m
x
,b
σ
x
. The minimization prob-
lem is solved numerically with iterative solutions of
subproblems that are defined as linear simultaneous
equations (Cawley et al., 2004; Cawley and Talbota,
2004). In addition, the leave-one-out cross validation
error of the minimization problem is obtained analyt-
ically without retraining using the Sherman-Morrison
formula. Similarly, η is obtained by way of y instead
of x.
3.3 Independence Measure
Using the kernel matrices, {K
X
}
i j
=
K(x
i
,x
j
),{K
Y
}
i j
= K(y
i
,y
j
), we define the mea-
sure of the mutual dependence between X and Y
as
J(X,Y ) ≡
1
n
2
Tr
K
X
I
n
−
1
n
1
n
K
Y
I
n
−
1
n
1
n
,
(10)
where I
n
denotes the identity matrix of size n and
1
n
denotes the square matrix of size n, all of whose
elements are 1 (Sun et al., 2007). J(X,Y ) = 0 means
that X and Y are independent and the scale of J(X,Y )
is arbitrary. Though one can use mutual information
instead of J to indicate the dependence between X
and Y , the calculation of J avoids the computationally
costly estimation of density distributions.
3.4 Permutation Test
In general, tests for statistical significance are re-
quired when inferring the dependence between vari-
ables as statistical errors in the sample prevent the
Approximate Conditional Independence Test using Residuals
299

measure of dependence from ever reaching zero. We
employ permutation test (Edgington and Onghena,
2007) to test the hypotheses,
H
0
: X and Y are independent,
H
1
: X and Y are not independent.
In permutation tests, the expected distribution of data
given the null hypothesis is generated by permuta-
tions of the dataset. When examining the degree
of dependence between X and Y , the pseudo-dataset
{x
i
,y
I
p
(i)
}
n
i=1
following the null hypothesis is gener-
ated by random permutations of x
i
and y
i
with the
original dataset {x
i
,y
i
}
n
i=1
. I
p
(i) denotes the i-th el-
ement of the index set, which is generated by random
permutation of the index set i ∈ {1,. . . , n}. We obtain
the null distribution of J(X ,Y ) empirically by evalu-
ating a number of J(X,Y ) with iteratively generated
pseudo-datasets by permutation. The percentile point
J(X,Y ) of the original dataset against the empirically
determined null distribution is the p-value. In gen-
eral, the permutation test is easy to apply when infer-
ring the mutual dependence between X and Y . How-
ever, the permutation test is difficult to apply when
trying to infer the conditional dependence between
X and Y given Z when the data were compiled from
a small sample. Since Z may be associated with X
or Y or both, an intentional sampling technique such
as grouping is needed to retain the associations be-
tween Z and X and/or Y . Even such intentional re-
sampling techniques are difficult if the dataset was
prepared from a small sample, and datasets used in
biology tend to be compiled from small samples.
3.5 Reliability of p-value
The standard error of independence measure J is esti-
mated by Jackknife method
SE
Jack
=
s
n − 1
n
n
∑
i
¯
J − J
\i
2
, (11)
where J
\i
is independence measure using the data
set of sample size n − 1 removed sample i, and
¯
J =
1
n
∑
n
i
J
\i
. We write the p-value in the permutation test
for J = J
(·)
as p(J
(·)
), and define a reliability of p-
value as
p
reli
= p(J
(l)
) − p(J
(u)
), (12)
where J
(l)
= max{0, J
0
− SE
Jack
}, J
(u)
= J
0
+ SE
Jack
.
J
0
is the value of J calculated from the whole data set.
The domain of p
reli
is [0,1]. The reliability of p-value
decreases with an increase in p
reli
.
Algorithm 1 : Let D be the n × m matrix describing the
dataset, where n is the sample size and m is the number of
variables/nodes. The vector d
·i
represents the i-th column
of D.
for each pair of nodes i and j do
x ⇐ d
·i
,y ⇐ d
· j
,Z ⇐ {d
·k
}
k\i, j
Infer m
x
,σ
x
,m
y
,σ
y
by HKRR for x and y on Z.
ε and η is obtained by the (8).
Compute J(ε; η).
Generate the null distribution of independence
between ε and η through permutations.
Obtain p-value by comparing J(ε; η) to the null
distribution.
Compute J(ε, Z) and J(η, Z).
Generate the null distributions of independence
between ε and Z and between ε and Z through
permutations.
Obtain p-values by comparing J(ε;Z) and
J(η; Z) against each of the null distributions.
Compute the reliability of p-value by the (12)
and omit the low reliable p-values.
end for
4 ARTIFICIAL GENE NETWORK
INFERENCE
The datasets from the Dream4 challenge (Schaffter
et al., 2011) were used to evaluate the proposed
method. The datasets are generated by simulations
based on ordinary differential equations that imitate
the biochemical reactions that make up a gene regu-
lation network. We employed multifactorial datasets
comprising five networks that include 100 nodes.
The multifactorial dataset corresponds to steady-state
measurements of all network nodes after a multifacto-
rial perturbation. The multifactorial perturbations are
given by slightly increasing or decreasing the basal
activation of all genes of the network simultaneously
by different random amounts. Thus, the data matrix
D for each network consists of 100 rows that corre-
spond to 100 measurements under perturbation of a
single node and 100 columns that correspond to all
100 nodes of the network. We infer the presence of an
edge between nodes i and j by calculating the approx-
imating conditional mutual information between i and
j given all other nodes except i and j. The data ma-
trix is divided into three parts, x, y and Z, where x and
y are vectors consisting of the i-th and j-th columns
of data matrix D, respectively, and Z is the redefined
data matrix that consists of D excluding the i-th and
j-th columns. The parameters m
x
(z) and σ
x
(z) are
inferred by HKRR, setting x as output and Z as in-
ICAART 2020 - 12th International Conference on Agents and Artificial Intelligence
300
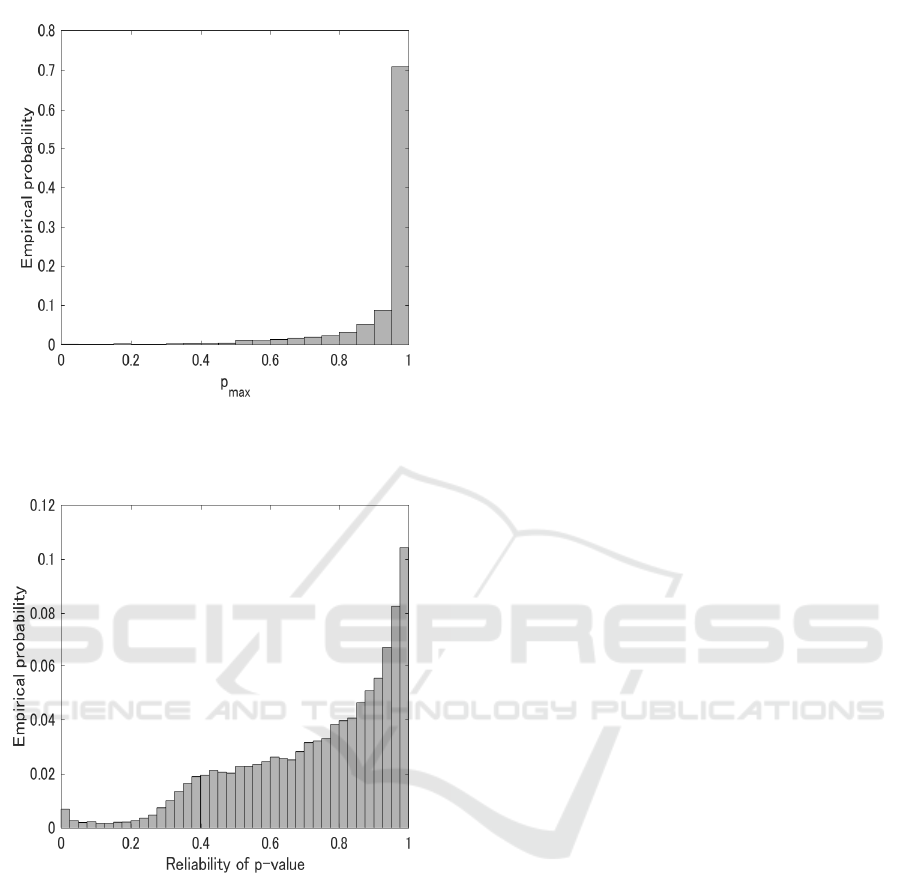
Figure 1: Empirical probability distribution of p
max
for all
inferred edges of five networks. A total of 24750 were in-
ferred.
Figure 2: Empirical probability distribution of reliability of
p-value for all inferred edges of five networks. A total of
24750 were inferred.
put. Similarly, by setting y as output, the parameters
m
y
(z) and σ
y
(z) are inferred. ε and η are determined
with (8). Leave-one-out training of sample µ is used
to infer m
x
(z) and m
y
(z), from which ε
µ
and η
µ
follow
analytically. The Gaussian kernel function
K
(·)
(x, x
0
) = exp
−β
(·)
k x − x
0
k
2
2
, (13)
is used for kernel functions K
m
x
and K
σ
x
. The
same hyper parameters of HKRR are set for the x
and y input models, and are determined so that the
leave-one-out cross validation error, which is ana-
lytically estimated without retraining (Cawley et al.,
2004), is minimized with a grid search. In the grid
search, we set the hyper parameters as β
m
= [1.00e-
4, 1.78e-4, 3.16e-4, 5.62e-4, 1.00e-3], β
σ
=[1.00e-
6, 3.16e-6, 1.00e-5], λ
m
=[5.00e-4, 7.50e-4, 1.00e-3,
1.30e-3, 1.50e-3], and λ
σ
=[0.1, 0.55, 1]. λ
m
and λ
σ
are weight parameters of the `
2
norm-regularization
terms for m
x
(z) and σ
x
(z), respectively. The Gaus-
sian kernel function is also included in the indepen-
dence measure J, and the scaling parameter is set as
β
J
=0.01.
Permutation tests in 50000 trials are applied to
check for the independence of ε and η. Instead of
imposing the condition that I(ε;η; Z) = 0 for ε and η,
the sufficient condition, which is x and Z or y and Z
are independent, is examined in post-processing. The
term p
max
is defined as max[p
xZ
, p
yZ
], where p
xZ
and
p
yZ
are the p-values of the permutation tests for the
independence of x and Z, and of y and Z, respec-
tively. The ratio of p
max
< 0.05 to all results is al-
most 0.0019(Fig.1). Thus, we do not discriminate
between edges that failed to fulfill the sufficient con-
dition below. The result p
max
< 0.05 is not equiv-
alent to I(ε; η; Z) 6= 0, as the latter is a sufficient,
but not necessary condition. Even if p
max
< 0.05,
I(ε; η;Z) = 0 may hold. In general, there no guar-
antee that I(ε; η; Z) = 0 when inferring ε and η using
nonlinear regression models. However, we consider
that the measure is sufficiently reliable if the gener-
alization error in the data set is small enough, since
most regression models assume that noise is added
to the output independently. We plan to clarify this
hypothesis in the future. We employed top 10% re-
liable p-values for network inference. Thus, the p-
values which have larger p
reli
than the value of 10 per-
centile point of p
reli
were omitted. The each empirical
probability distribution of p
reli
is similar among five
inferred networks (Fig.2), and that of 10 percentile
point of p
reli
was around 0.4. The point can be seen
as the edge of plateau of distribution, and empirical
probability rapidly decreases with an decrease in p
reli
.
The proposed method for network inference is sum-
marized as pseudo-code in algorithm1.
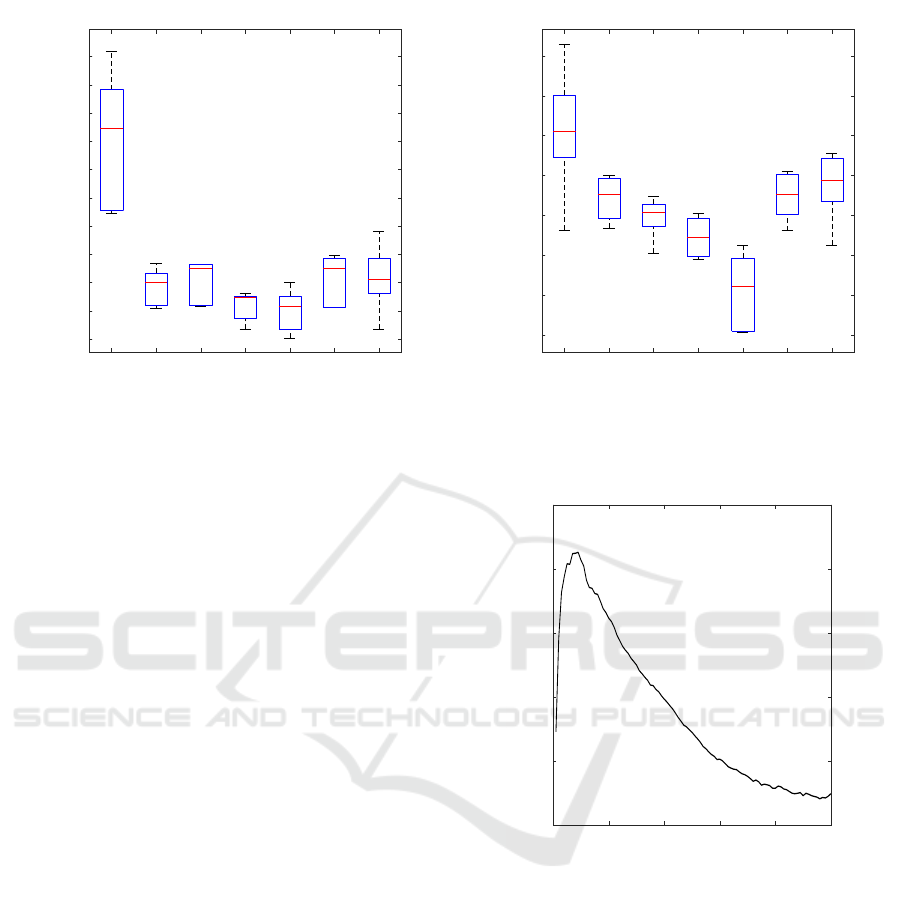
We compared our proposed method against GE-
NIE3(Irrthum et al., 2010), TIGRESS(Haury et al.,
2012), CLR(Faith et al., 2007), ARACNE(Margolin
et al., 2006), NIMEFI(Ruyssinck et al., 2014),
PLSNET(Guo et al., 2016). The proposed method
performs better than the other methods in terms of
both the average area under the receiver operating
characteristic curve (AUROC) and the average area
under precision recall curve (AUPR) (Fig.3), although
the low reliable p-values are omitted in the perfor-
mance evaluation of proposed method. This result
indicates that approximate conditional independence
and omitting low reliable p-value is effective for in-
Approximate Conditional Independence Test using Residuals
301
Prop.(Top10%) GENIE3 TIGRESS CLR ARACNE NIMEFI PLSNET
0.1
0.15
0.2
0.25
0.3
0.35
0.4
0.45
0.5
0.55
0.6
AUPR
(a)
Prop.(Top10%) GENIE3 TIGRESS CLR ARACNE NIMEFI PLSNET
0.6
0.65
0.7
0.75
0.8
0.85
0.9
0.95
AUROC
(b)
Figure 3: Boxplot of (a)AUPR and (b) AUROC of the results for five inferred networks. The results except proposed method
were taken from (Guo et al., 2016)
ferring the associations of a gene network. Infer-
ring whole network is not always needed. One of the
goals of network inference for biologists is to find un-
known associations in biological knowledge. There-
fore, there is an advantage to infer a part of network
more accurately rather than whole of that, although it
is depending on the intended use. Furthermore, merg-
ing parts of network of high reliable p-values inferred
by various estimators would be a promising strategy
to identify whole network structure.
The AUPR almost monotonically decreases with
an increase in unreliable p-values, whereas the AU-
ROC is skewed bell-shaped curve (Fig.4, 5). In gen-
eral, the precision recall (PR) curve is a useful mea-
sure, when dealing with highly skewed datasets in the
class distribution(Davis and Goadrich, 2006). In other
words, the PR curve offers insight about the quality
of inferred association networks that are not dense,
as biological networks tend to be. Given that AUPR
is put more weight than AUROC, the characteristics
of monotonic decrease of AUPR is useful, and the
threshold of p
reli
is determined by the degree to which
accuracy is required.
The advantage of permutation testing is that it re-
turns a p-value. AUROC and AUPR reveal potential
performances of network inference, but the network
structure affects how the threshold for judging the
presence of an edge is determined in practice. The
p-value can be considered as a normalized score de-
fined in [0,1], so the scale of the measure is always
constant. Additionally, the score can be easily in-
terpreted because the probability was under a given
statistical assumption that when conditional or ordi-
nary independence is true, the conditional or ordinal
0 20 40 60 80 100
top x%
0.65
0.7
0.75
0.8
0.85
0.9
AUROC
Figure 4: Average AUROC for inferred networks of reliable
top x% edges.
mutual information would be greater than or equal to
observed result.
5 CONCLUSION
This article has proposed a novel computational
method for approximating conditional mutual infor-
mation based on the distribution of residuals in re-
gression models of the data. The proposed method
translates the problem of conditional independence to
that of determining independence, to enable the use of
permutation testing. The translation of the problem is
an essential feature of the proposed method. The pro-
ICAART 2020 - 12th International Conference on Agents and Artificial Intelligence
302

0 20 40 60 80 100
top x%
0.15
0.2
0.25
0.3
0.35
0.4
0.45
0.5
0.55
AUPR
Figure 5: Average AUPR for inferred networks of reliable
top x% edges.
posed method can translate a problem to use other es-
timators of residuals ε, η and independence measures
instead of HKRR and J. The score of p-value offered
by the permutation test can be interpreted as the sig-
nificance level, and this threshold is easier to deter-
mine than other scores such as the conditional mutual
information. Additionally, the reliability of p-value is
defined.
The proposed method was applied to inferring
artificial gene networks from the Dream4 challenge
datasets, and had the better performance in terms of
AUROC and AUPR. Although the proposed method
infers an part of network by omitting low reliable
p-values, there an advantage to find unknown asso-
ciations. Furthermore, merging parts of network of
high reliable p-values inferred by various estimators
would be a promising strategy to identify whole net-
work structure.
The proposed method would be basically ex-
tended to the inference of associative networks in case
that the dataset is many-dimensional, that is, X and
Y can be multidimensional. This method may prove
useful, for instance, in the examination of associations
between layers or pathways in transomics datasets.
The HKRR method is employed to infer ε and η in
the method proposed above. However, if p(x|Z) or
p(y|Z) can have a multi-modal distribution for some
fixed Z, HKRR is no longer suitable. The appropriate
method for inferring ε and η depends on the distri-
bution of the data in question, and demands further
study.
ACKNOWLEDGEMENTS
This work was supported by the Creating informa-
tion utilization platform by integrating mathemati-
cal and information sciences, and development to so-
ciety, CREST (JPMJCR1912) from the Japan Sci-
ence and Technology Agency (JST) and by the Japan
Society for the Promotion of Science (JSPS) KAK-
ENHI Grant Number (JP18H04801, JP18H02431)
and Kayamori Foundation of Informational Science
Advancement.
REFERENCES
Cawley, G. and Talbota, N. (2004). Fast exact leave-one-out
cross-validation of sparse least-squares support vector
machines. Neural Networks, 17:1467–1475.
Cawley, G. C., Talbota, N., Foxalla, R. J., Dorlingb, S. R.,
and Mandic, D. P. (2004). Heteroscedastic kernel
ridge regression. Neurocomputing, 57:105–124.
Cover, T. M. and Thomas, J. (2006). Elements of Informa-
tion Theory. Wiley-Interscience New York, NY, USA,
2nd edition.
Daub, C. O., Steuer, R., Selbig, J., and Kloska, S.
(2004). Estimating mutual information using b-
spline functions–an improved similarity measure for
analysing gene expression data. BMC bioinformatics,
5(1):118.
Davis, J. and Goadrich, M. (2006). The relationship be-
tween precision-recall and roc curves. In Proceed-
ings of the 23th international conference on Machine
learning (ICML’06), pages 233–240.
Edgington, E. and Onghena, P. (2007). Randomization
Tests. Chapman and Hall/CRC, 4th edition.
Faith, J., Hayete, B., Thaden, J., Mogno, I., Wierzbowski,
J., Cottarel, G., Kasif, S., Collins, J., and Gardner,
T. (2007). Large-scale mapping and validation of es-
cherichia coli transcriptional regulation from a com-
pendium of expression profiles. PLoS Biol., 5(1):e8.
Guo, S., Jiang, Q., Chen, L., and Guo, D. (2016). Gene reg-
ulatory network inference using pls-based methods.
BMC Bioinformatics, 17(545).
Hastie, T., Tibshirani, R., and Friedman, J. (2001). The
Elements of Statistical Learning. Springer New York
Inc, NY, USA.
Haury, A.-C., Mordelet, F., Vera-Licona, P., and Vert, J.-
P. (2012). Tigress: trustful inference of gene regula-
tion using stability selection. BMC systems biology,
6(1):145.
Irrthum, A., Wehenkel, L., Geurts, P., et al. (2010). Inferring
regulatory networks from expression data using tree-
based methods. PloS one, 5(9):e12776.
Margolin, A., Nemenman, I., Basso, K., Wiggins, C.,
Stolovitzky, G., Favera, R., and Califano, A. (2006).
Aracne: An algorithm for the reconstruction of gene
regulatory networks in a mammalian cellular context.
BMC Bioinformatics, 7(57).
Approximate Conditional Independence Test using Residuals
303

McGill, W. J. (1954). Multivariate information transmis-
sion. Psychometrika, 19(2):97–116.
Pearl, J. (2009). Causality:Models, Reasoning and Infer-
ence. Cambridge University Press New York, NY,
USA.
Ruyssinck, J., Geurts, P., Dhaene, T., Demeester, P., Saeys,
Y., et al. (2014). Nimefi: gene regulatory network
inference using multiple ensemble feature importance
algorithms. PLoS One, 9(3):e92709.
Schaffter, T., Marbach, D., and Floreano, D. (2011).
Genenetweaver: in silico benchmark generation and
performance profiling of network inference methods.
BIOINFORMATICS, 27(16):2263–2270.
Sun, X., Janzing, D., Sch
¨
olkopf, B., and Fukumizu, K.
(2007). A kernel-based causal learning algorithm. In
Proceedings of the 24th international conference on
Machine learning (ICML’07), pages 855–862.
APPENDIX
The formula for equation (2) is widely known (Cover
and Thomas, 2006).
Theorem 1. When X = f (Z)ε, H(X|Z) = H(ε|Z) +
E
Z
[log f (Z)].
proof. we have p
X|Z
(x|z) =
1
f (z)
p
ε|Z
x
f (z)
|z
, then,
H(X|Z = z) = H(ε|Z = z) + log f (z). Thus, we ob-
tain
H(X|Z) = E
Z
[H(X|Z = z)] = H(ε|Z) + E
Z
[log f (Z)] .
Similarly, we obtain H(X,Y |Z) = H(ε|Z) +
E
Z
[log f (Z)g(Z)].
ICAART 2020 - 12th International Conference on Agents and Artificial Intelligence
304
