
A Public Participatory Approach toward the Development of a
Comprehensive Geospatial Database in Support of High-scale Food
Security Analysis
Timothy Mulrooney
a
and Tysean Wooten
b
Department of Environmental, Earth and Geospatial Sciences, North Carolina Central University,
1800 N. Fayetteville Street, Durham, NC, U.S.A.
Keywords: Geographic Information System, Geodatabase Development, Geospatial Standards, Geospatial Metadata,
Geospatial Data Development, Food Desert, Food Swamp.
Abstract: While Geographic Information Systems (GIS) has slowly been integrated into the study of the food
environment, little research has been performed to determine the data development needs and standards that
best necessitate high-quality research at a high scale. In an era with limited resources such as personnel,
bandwidth, space and time, the optimization of these resources in order to understand, visualize and facilitate
interventions at an appropriate scale is critical if not necessary. In this research, subject matter experts assessed
and evaluated the relative importance of various GIS data themes, attributes and facets of GIS database
development in support of local-scale food security analysis. It was found that factors related to the placement
of various food sources (grocery stores and farmers markets) and individualized vehicular transportation
(roads) outweighed those related to land cover, utilities and zoning, as well as non-vehicular (sidewalks) and
public (bus routes) means of transportation. In addition, when ranking various dimensions of data quality,
subject matter experts found positional accuracy and attribute accuracy to be the most important when
undertaking the development of a geospatial database of this magnitude.
1 INTRODUCTION
Patterns of negative health-related outcomes such as
obesity, hypertension, and diabetes are spatial in
nature and when mapped, are typically prevalent and
clustered in low-income communities. While lifestyle
choices and genetics contribute to individual and
household vulnerability that lead to these differential
health outcomes, it is possible to identify social and
environmental factors, sometimes associated with
geographic location, that have an effect on larger
groups, and might be considered as critical indicators
to address in any mitigation plan. There is, for
example, a strong relationship between health and
diet and it seems clear the accessibility of sources for
fresh meats, fruits, and vegetables is an important
factor in the overall health of a community. Even in
poorer neighborhoods, Rose and Richards (2004)
found food stamp recipients who live close to
a
https://orcid.org/0000-0001-9333-9641
b
https://orcid.org/0000-0001-8355-3249
supermarkets ate more fresh food and vegetables.
While it is safe to say that geography is not a prime
determinant in explaining or even justifying health
outcomes, it does have more of a role than one would
think.
The United States Department of Agriculture
(USDA) has popularized the term food desert to
highlight areas within low-income communities that
have limited accessibility to supermarkets. While
some research has focused on rural areas (Van
Hoesen, 2013; Gross and Rosenberger, 2005;
Blanchard and Lyson, 2006; Morton, Ella and
Oakland, 2005) much of the knowledge base on the
subject has been associated with urban areas. In
urban areas, this phenomenon can occur for a couple
of reasons. The number of large retailers is decreasing
or consolidating, but increasing in size to
accommodate all shoppers, both grocery and non-
grocery (Clarke et al., 2002). Combined with the fact
that retailers are leaving downtowns for the suburbs
Mulrooney, T. and Wooten, T.
A Public Participatory Approach toward the Development of a Comprehensive Geospatial Database in Support of High-scale Food Security Analysis.
DOI: 10.5220/0008863900210032
In Proceedings of the 6th International Conference on Geographical Information Systems Theory, Applications and Management (GISTAM 2020), pages 21-32
ISBN: 978-989-758-425-1
Copyright
c
2020 by SCITEPRESS – Science and Technology Publications, Lda. All rights reserved
21
(Furey et al., 2001), Mamen (2007) found large
retailers are tending to locate near high-volume roads
that are less accessible to non-vehicular
individualized transportation (i.e. walking, public
transit or riding a bike). Lewis et al. (2005) reinforced
this when he found unhealthy food options greatly
outweighed their healthy counterparts in Los Angeles
while Powell (2007) found poor and minority
neighborhoods had less healthy food options than
their richer and whiter counterparts. As a result,
typical sources of fresh and ‘healthy’ foods
(supermarkets, farmers’ markets and other sources)
are being replaced by fast food restaurants and
convenience stores, which offer food options that are
convenient, inexpensive but typically less healthy.
While a seemingly even trade in terms of net food
balance, the long-term ramifications on community
health far outweigh any gains. In response to this
increasing disproportion, research has explored the
notion of food swamps which represent areas with
inordinately high number of unhealthy food options
compared to healthy options. Research at the local
level (Cooksey-Stowers et al., 2017; Zenk et al.,
2015) has shown food swamps actually better predict
obesity and other negative health outcomes than food
deserts.
Geospatial tools such as Geographic Information
Systems (GIS) serve as a popular technology to assess
and evaluate spatial dimensions of the food
environment. A GIS serves as the tangible and
intangible means by which information about
spatially-related phenomena can be created, stored,
analyzed and rendered in the digital environment.
Experts in many dissimilar fields have seen the utility
of GIS as a means of quantifying and expanding their
research. GIS is used in disciplines such as business,
sociology, justice studies, surveying and the
environmental sciences. As applied to food security,
GIS can be used to measure the proximity of
residences to large supermarkets or supercenters or the
concentration of food outlets within an enumeration
unit (census tract or zip code) as a commonly used
proxy for access (Morton and Blanchard, 2007;
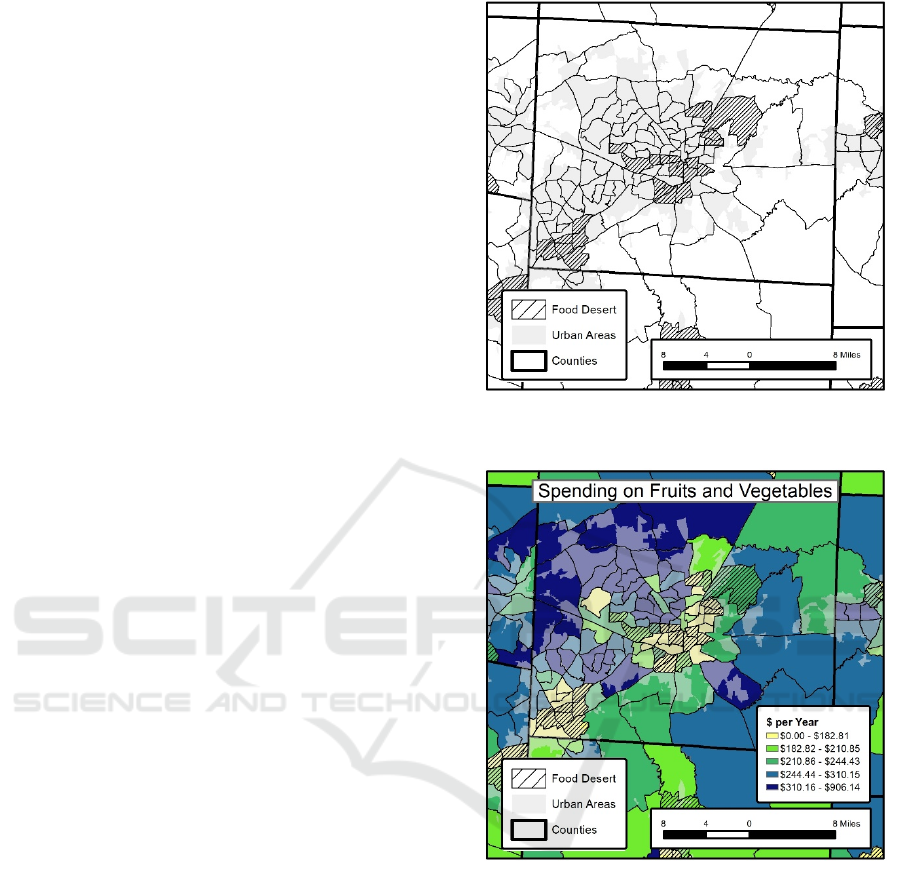
Sharkey and Horel, 2008). These areas of high access
and low access can be analyzed and mapped across
both space and time (Chen and Clark, 2013) as shown
in Figure 1, as well as the factors that may explain this
access such as spending (Figure 2). These make
powerful visual products both easy to understand and
disseminatable to the entire public that can have long-
term policy implications.
Figure 1: Map of USDA food deserts in Guilford County,
North Carolina.
Figure 2: Map of spending patterns combined with food
deserts.
While many only see the output of GIS data and
analysis in the form of maps, resources must be
dedicated to creating high-quality data at a local scale.
This data creation takes on many different forms,
ranging from the conversion of analog data and
extraction from a larger database to the use of high
precision equipment. This paper takes a holistic look
at the types of geospatial data needed to perform high-
quality analysis in support of assessing, evaluating
and mapping spatial dimensions of the food
environment at a local scale. These database needs
are quite different than data that may be required to
remediate food insecurity at the individual/household
GISTAM 2020 - 6th International Conference on Geographical Information Systems Theory, Applications and Management
22

level or at a national or sub-national scale. Minimal
research has been performed in this field of database
development, whether for the sake of science
research, decision-making or policy.
In the United States, food insecurity has been
described as a “serious public health problem
associated with poor cognitive and emotional
development in children and with depression and
poor health in adults” (Chilton and Rose, 2009, p. 1).
Some have called for a rights-based approach to
addressing food security in the United States given
that women and children have much higher rates of
food security than their male and more senior
counterparts (Chilton and Rose, 2009). As a result,
this research explores both technical and non-
technical issues by understanding the needs and
subsequently developing the database to solve this
pressing and immediate problem.
2 LITERATURE REVIEW
While many operational definitions exist, food
security is generally considered to be the state “when
all people, at all times, have physical and economic
access to sufficient, safe and nutritious food to meet
their dietary needs and food preferences for an active
and healthy life” (Food and Agriculture Organization
2009, p. 1). Contemporary literature has used terms
such as availability, accessibility, proximity,
disparity, inequality, density, variety, affordability
and quality as well as the aforementioned food desert
and food swamp to describe quantitative measures of
the food environment and ultimately food security.
These measures, as well as the data which describe
them, can be represented at different scales. The data
needs for national-level food security analysis differs
than those required for community level analysis.
The mapping and delineation of food-insecure
areas within the digital environment has been made
exponentially easier with GIS technologies. While
first used as an aesthetic tool to map study areas
(Wrigley et. al, 2002) or display underlying
explanatory variables (Guy et. al, 2004), GIS has
since been used to measure distances,
quantitatively
express proximity and render this proximity with
statistical significance using a
variety of analytical,
geostatistical and cartographic techniques. Among
the
first to do this within the realm of food desert
research were Donkin et al. (1999), Lovett et al.
(2002) and Pearce (2006) while more recent research
(Mulrooney, 2017; Rose et al., 2009) has
quantitatively calculated and mapped the spatial
extent of the aforementioned food swamps at a local
scale.
Within the GIS data environment, ways to express
quantitative dimensions of the food environment vary
from study to study. Prior research has expressed
these measures as absolute linear units such as
kilometers or miles (Jago, 2007), travel time in
minutes (Ver Ploeg et al., 2009; Jiao et al., 2012) and
densities such as the number of food options per
square mile by census tract (Block et al., 2004), as
well as derived metrics based on the cost to operate a
car (Hallett and McDermott, 2011). More recently,
relative unitless metrics (Zenk et al., 2014; Clary et
al., 2015; Mason et al., 2013) have been used as
alternatives to absolute measures because these
absolute measures are meaningless if not placed
within some context. A ten-minute drive time to the
nearest fresh food source in a downtown urban area
means something much different than a ten-minute
drive to the nearest fresh food source in a rural area.
The proper and prudent use of absolute measures
requires more data, analysis and interpretation. Food
swamp research using GIS has used existing metrics
such as the Retail Food Environmental Index (RFEI)
and the Expanded RFEI (Cooksey-Stowers et al.,
2017; Luan et al., 2015) while others (Mulrooney et
al., 2017; Rose et al, 2009) have derived their own
metrics and subsequent interpretations to define
spatial extents of food deserts and swamps using the
RFEI, Expanded RFEI, Modified RFEI (mRFEI)
developed by the Centers for Disease Control (2011)
and Food Balance Metric (Gallagher, 2006) as
guidelines.
In studies that model the supply and demand
forces from farm to plate at a national scale, it is
necessary to have geospatial data regarding farm
locations, their arrangement, land cover, flood plains,
rivers, climate and population change which support
burgeoning sustainable planning, management and
development efforts, especially in developing
countries (Soneye, 2014; Babtunde, Omotesh and
Sholatan, 2010; Obioha, 2009). At this most basic
level, food security at the national scale can be
thought of as a function of the socio-economic and
political environment regarding factors such as
macro-economy, natural resource endowment,
market conditions, education, policy environment,
food safety/quality and health care practices. These
are not considerations in local-scale analysis where
distances, drive times or derivations of these
measures with respect to known food sources are
calculated alongside explanatory variables to
delineate food-needy regions.
A Public Participatory Approach toward the Development of a Comprehensive Geospatial Database in Support of High-scale Food Security
Analysis
23
While food security does exist at a variety of
scales, the geospatial data required for local
(community) level food is scale dependent and
different in nature than data required at a coarser
national or sub-national scale. These geospatial data
required for this type of local research vary in scope,
ranging from roads and businesses to zoning and
municipal boundaries. For example, Van Hoesen et
al. (2013) looked at the quality of food in conjunction
with point-to-point distances along a vector road
network in Vermont that is grouped within polygonal
enumeration units such as towns/townships. Pioneers
in the application of GIS to assess food accessibility
such as Blanchard and Morton (2007), Gallagher
(2006) and McEntee and Agyeman (2010) also used
vector GIS data at some level (individual point,
census block group, tract, etc.) to express food
security. In national-scale analysis of this type,
analyzing thousands to hundreds of thousand sources
traveling to thousands of destinations is resource-
intensive and requires large, ancillary data layers such
as roads in support of this analysis as well as the
abovementioned interpretation to be useful.
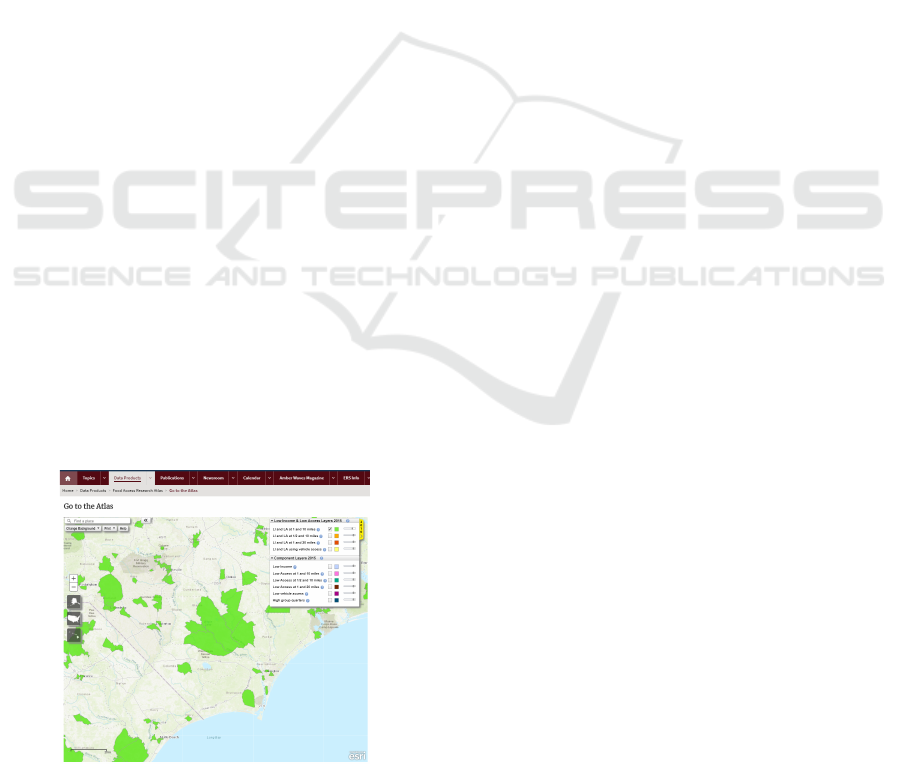
In the United States, guidance on the quantitative
assessment of the food environment begins with the
United States Department of Agriculture Food
Access Atlas (https://www.ers.usda.gov/data-
products/food-access-research-atlas/go-to-the-atlas/).
Food access take into account both the availability or
proximity of food sources to residents as well as
having readily-available transportation. Information
collected and mapped at the census tract level
includes the aforementioned food desert metric (low
income and limited access) as shown in Figure 3 as
well as individual components that make up this
metric and ancillary measures such as income,
vehicle access and high-density housing. As shown
in Figure 3, census tracts can take on varying sizes
Figure 3: USDA Food Access Atlas of Southeastern North
Carolina showing low income and low access census tracts.
and shapes. These larger census tracts, one of which
is 322 sq. miles in size, in the middle of the diagram
located in Columbus, Pender and Sampson Counties
in North Carolina are especially problematic because
they may be too large to emphasize high-scale food
security patterns necessary for community-based
research. As a result, high-scale food environment
analysis performed at the block group (D’Acosta,
2015; Wang, 2012; Jiao, 2012) or even pixel
(Mulrooney et al., 2017) scale, which is finer than
census tracts, better articulates local-level patterns
and serves as a focus of this research.
Depending upon the focus and scale of analysis,
the number of points used in the GIS analysis of the
food environment, whether as sources or destinations,
can range from the dozens (Opher, 2010; Love et al.,
2013) to hundreds (Sharkey et al., 2009; McEntee &
Agyeman, 2010) and even thousands (van Hoesen et
al., 2013). As a basis for this research on high-scale
food security in North Carolina, GIS work
(Mulrooney et al., 2017; Major et al., 2018; Love et
al., 2013) highlighted metrics to measure food
security at some level at the block group level. A
variety of disparate themes were used in these studies,
ranging from roads, business locations and rivers to
municipal boundaries, farmers’ markets and
convenience stores. Each of these layers were
developed or extracted at a scale appropriate for
local-scale analysis in order to facilitate decision and
policy making.
While there is boundless value in performing
local-scale food environment analysis using GIS,
little research has been performed on the actual
themes or topics that would be necessary for high-
quality research at a high scale. While many end-uses
only want the end-products of GIS analysis, the
largest cost of any GIS project is developing the data
which go into high-quality research. It goes without
saying that in an era with limited resources such as
personnel, space and time, database developers must
be pointed and direct in the how, when and to what
extent (temporal, spatial and topical) data must be
developed. Attempts have been made to estimate the
actual and tangible costs (Johnson et al., 2017;
Janssen et al., 2012) and value (Bernknopf and
Shapiro, 2015; Garcia-Rojas, 2015) of geospatial
data; however, it is difficult if not impossible to place
a monetary value on the data although various entities
(Koutnik, 1996; Ledbetter, 1996) have tried to
estimate it from a cost-savings approach in the early
days of GIS in the 1990s. Nonetheless, in this day and
age when GIS is omnipresent in all levels of local and
state government, GIS does facilitate informed
GISTAM 2020 - 6th International Conference on Geographical Information Systems Theory, Applications and Management
24

decision-making, which can be realized a number of
different ways.
In particular, little work has been performed to
determine how important roads are in food security
research at the local level. What about elevation? In
addition to the actual features, there are various
questions about the individual attributes required for
high-quality food desert research. Is income (at the
census tract level) a necessary attribute for sub-
county food desert research? What about road
length? This research explores how can these themes
and attributes can be prioritized when time and
personnel constraints, which are a reality in the
professional world, exist.
Nonetheless, the resources dedicated to data
creation, especially high-quality data, are
extraordinarily high. Early pioneers of GIS
recognized the importance of data quality, not only
from a cost efficiency standpoint, but because of the
legal ramifications in publishing incorrect spatial
information which may lead to accidents or the
misuse of data (Epstein, 1988). Even then, they
understood the compromise between accuracy, the
cost of creating accurate data and the inevitability that
some error will still exist. This compromise is what
Bédard (1987) called uncertainty absorption. Given
that hundreds to thousands of individual features are
required for this type of GIS analysis, it is impossible
to field verify every single feature used in analysis.
Studies (Sharkey and Horel, 2009; Lake, 2015) have
highlighted the inaccuracy of existing geospatial
databases used in the study of food security using
varied field techniques.
Various forms of accuracy exist, to include
horizontal accuracy (distance between actual feature
and GIS representation of feature), attribute accuracy
(description of features matches the field) and
attribute completeness (all attributes have viable
values). The Federal Geographic Data Committee
(FGDC) and spatial data transfer standards (SDTS)
also consider vertical accuracy (error in measured vs.
represented elevation), data lineage (source materials
of data) and logical consistency (compliance of
qualitative relationships inherent in the data structure)
as part of data quality (FGDC, 1997; USGS, 2000).
In some GIS circles, temporal accuracy (age of the
data compared to usage date) and semantic accuracy
or “the quality with which geographical objects are
described in accordance with the selected model” are
also considered elements of data quality (Salge, 1995)
as well as metadata, the formal cataloguing of GIS
data. In addition to better understanding to what
extent different data layers are required for research,
this study will also address these facets of data
quality.
3 PROCEDURES
In order to prioritize data layers, attributes and facets
of data quality, a survey was developed and
distributed to the GIS community that focuses on
local-scale food security research. It is composed of
twelve questions that not only ask about users’ GIS
experience, but also asks users Likert-type questions
about their preferences for particular GIS data layers
(Figure 4) and the attributes attached to those layers
(Figure 5).
As shown in these figures, respondents were
asked to scale responses to these questions on a 5-
point Likert-type scale, representing “Not Applicable
at All” through “Essential to Research”. The Likert
scale uses ordered responses on a bipolar
measurement scale to assess the level of agreement or
disagreement with a statement. Some scales do have
an even number of responses (4, for example), which
force respondents to choose one side of the mean or
the other.
Figure 4: Likert-type assessment used to rate importance of
GIS data themes for use in food desert research. 23 layers
were used in this assessment.
Table 1: Respondents were asked the question “You are
developing a GIS database in order to conduct local-scale
food security analysis. How important are the following
GIS data layers to your research and analysis?” regarding
GIS data layers (street network, for example). The
following scale assigned point values to their answers.
Response Point Value
Not Applicable at All 1
Slightly Important 2
Moderately Important 3
Very Important 4
Essential to Research 5
A Public Participatory Approach toward the Development of a Comprehensive Geospatial Database in Support of High-scale Food Security
Analysis
25
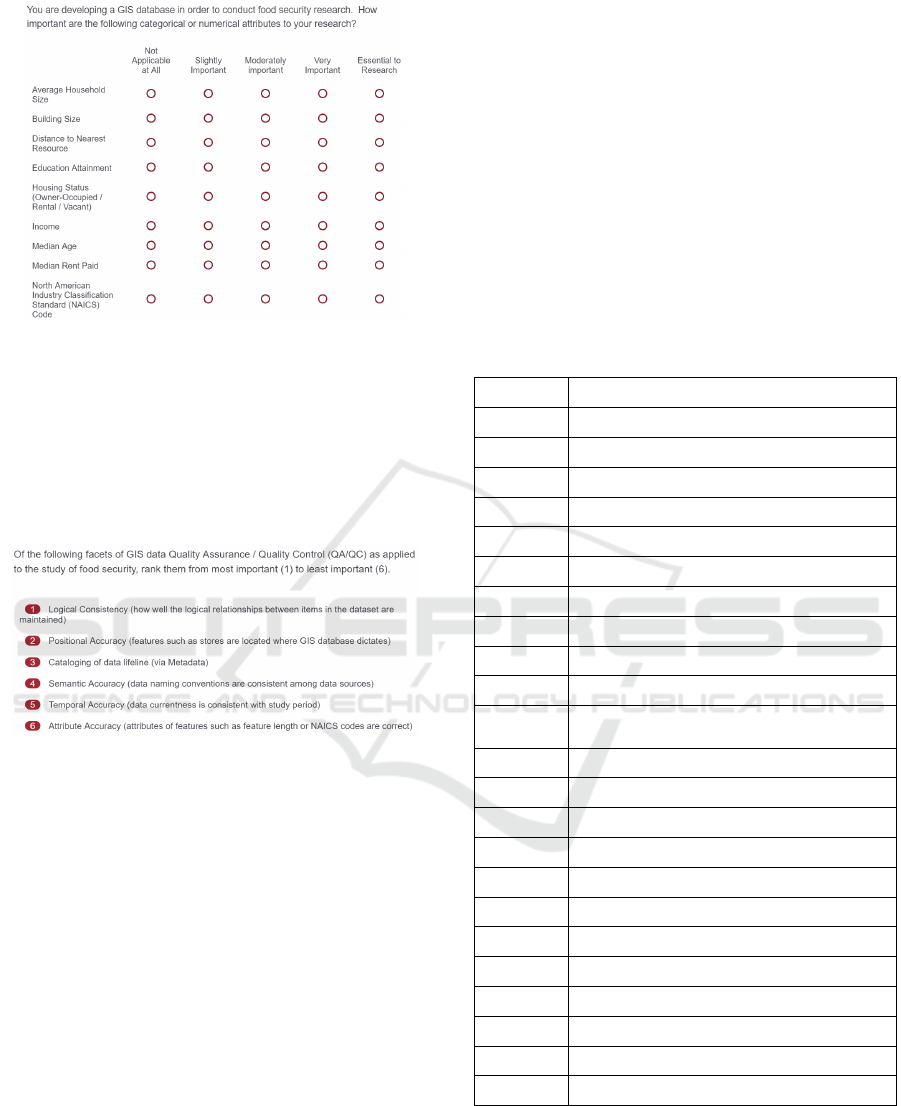
Figure 5: Likert-type assessment used to rate importance of
attributes for use in local-level food desert research. 18
attributes were used in this assessment.
As applied to rating the various dimensions of
data quality, respondents were given a survey rating
six facets of data quality. An example of this survey
and explanations of these facets are highlighted below
in Figure 6.
Figure 6: Dimensions of spatial data quality that
respondents were asked to rate using online assessment
tool.
This survey was created and distributed to the
food desert community via message boards, e-mails
and online forums in the Fall of 2017 and Spring
2018. 32 respondents answered the survey.
4 RESULTS
4.1 Prioritization of Data Layers
Respondents were asked to rate data layers on 5-point
Likert-type scale ranging from “Not Applicable at
All” to “Essential to Research” where each response
as assigned a point value as highlighted in Table 1.
For each layer, an average based on responses was
computed from the values and Table 1 and ranked
according to all 23 data layers in the survey. For
example, for the Counties data layer, there were two
responses for “Not Applicable at All”, two for
“Slightly Important”, six for “Moderately Important”,
twelve for “Very Important” and the remaining ten
responded with “Essential to Research”. This would
compute to a value of 3.94 and this value would be
ranked among the other 22 data layers selected for
this survey. In this case, the Counties layer ranked 8
th
amongst the 23 data layers in the questionnaire.
Unsurprisingly the “Grocery Stores” data layer
ranked with the highest with a score of 4.25, followed
closely by “Roads”, “Farmers’ Markets” and “Urban
Areas”. These are highlighted in Table 2.
Table 2: Rank of Layers/Themes as Voted by GIS User
Community.
Rank Layer
1 Grocery Stores
2 Roads
3 Farmers Markets
4 Urban Areas
5 Census Units (block groups, tract, etc.)
6 Cities and Towns
7 Fast-Food Restaurants
8 Counties
9 Bus Routes
10 Businesses (All)
11
Non-census sub-county units (boroughs,
townships, etc.)
12 Schools
13 Zoning
14 Sidewalks
15 Land Cover
16 States
17 Churches
18 Walking / Jogging Trails
19 Building Footprints
20 Crime
21 Utilities (Electrical / Gas / Cable / Phone)
22 Elevation
23 Golf Courses
In addition, users were asked to name themes not
mentioned in the above list. Themes that were
mentioned include: Community Gardens, Parks,
Greenhouses, Arable Land, Irrigation Pathways,
Rivers, Access to Water, Food Banks, Food
GISTAM 2020 - 6th International Conference on Geographical Information Systems Theory, Applications and Management
26

Assistance Organizations, Non-Profit Businesses,
Health Agencies, Corner Stores, Partial Markets
(Walgreens, for example), Liquor Stores, Bus Stops
and County Agencies.
4.2 Prioritization of Attributes
The same conventions and number scales were
applied to attributes that may be used to describe data
layers from Table 1. After averaging values marked
by uses, the “Distance to Resource” attribute was
ranked highest, followed by “Income” and “Race
/Ethnicity (by enumeration unit)”. These results are
highlighted in Table 3.
Table 3: Rank of Attributes to Layers/Themes as Voted by
GIS User Community.
Rank Attribute
1 Distance to Nearest Resource
2 Income
3
Race / Ethnicity (by
enumeration unit)
4 Population Density
5 Average Household Size
6 Population
7 Education Attainment
8
Housing Status (Owner-
Occupied / Rental / Vacant)
9
Transportation (# of vehicles
by enumeration unit)
10 Median Age
11 Median Rent Paid
12
Spending Patterns (by
enumeration unit)
13 Zoning Type
14
North American Industry
Classification Standard
(NAICS) Code
15 Road Length
16 Building Size
17
Number of Employees by
Business
18 Speed Limit
4.3 Dimensions of Data Quality
Users were asked to rate six different dimensions of
data quality from 1 (most important) to 6 (least
important). These data dimensions speak to how the
data are created, described and catalogued as part of
the data development process. Scores for each facet
were averaged and ranked. These rankings are
highlighted in Table 4.
Table 4: Rank of Dimensions of Data Quality.
Rank Facet of Data Quality
1
Positional Accuracy (features such as
stores are located where GIS database
dictates)
2
Attribute Accuracy (attributes of features
such as feature length or NAICS codes are
correct)
3
Temporal Accuracy (data currentness is
consistent with study period)
4
Logical Consistency (how well the logical
relationships between items in the dataset
are maintained)
5
Semantic Accuracy (data naming
conventions are consistent among data
sources)
6 Cataloging of data lifeline (via Metadata)
5 STANDARDS-BASED
APPROACH TO DATABASE
DEVELOPMENT
Data standards such as the Spatial Data Standards for
Facilities Infrastructure and Environment (SDSFIE)
are used by the Department of Defense (DoD) to
maximize interoperability across installations and
branches by dictating naming conventions, attributes
and domain values for spatial data layers. The name
road_centerline is denoted as “the center of the
roadway as measured from the edge of the paved
surface” and is consistent across all DoD installations
instead of using layer names such as street, streets or
roads. The road_centerline feature class contains 55
attributes. The FGDC has defined data standards for
landmarks, addressing, thoroughfares and parcels
(FGDC, 2011) in order to standardize attributes so
features can geocoded, described and represented
fully and completely. While the development of a
database dedicated solely to food security is still
being realized, point and polygonal features
representing municipal and census-based units such
as zip codes, towns, census tracts and census block
groups should have attributes which rank highly in
this study such as distance to the nearest resource and
access to transportation, as well as socio-economic
indicators such as income, race/ethnicity, education
attainment, population and population density. The
calculation of these attributes may require further
processing or the import of data from various spatial
A Public Participatory Approach toward the Development of a Comprehensive Geospatial Database in Support of High-scale Food Security
Analysis
27

databases such as the 2010 Census, Esri Demographic
Database, Esri Spending Patterns and American
Community Survey.
In order to catalog both data for this specific
purpose and the processing performed to develop the
database, it is necessary to describe administrative,
structural and descriptive information about the
geospatial data. Metadata serves as an organized
means to describe a dataset, and provides the formal
framework for providing information about a
dataset’s lineage, age and creators using both
qualitative and quantitative entries. In the GIS
community, the FGDC-endorsed Content Standard
for Digital Geospatial Metadata (CSDGM) is slowly
giving way to an International Standards
Organization (ISO)-based metadata standard that
accounts for evolving technologies such as remotely
sensed imagery, online services and ontologies that
did not exist when the CSDGM (formally known as
FGDC-STD-001-1998) was first published.
While more than 400 individual elements
comprise a complete metadata record, the state of
North Carolina has developed a State and Local
Government Profile, based on the ISO 19115, 19115-
1 and 19119 standards that streamlines these 400
elements into about 75 elements that best capture the
necessary information about a data layer which
enable content consistency and improves the search
and discoverability of data through online data
repositories such as NCOneMap. This standard, as
well as guidance for its use, is provided by the North
Carolina Geographic Information Coordinating
Council (NCGICC) through the NCOneMap online
portal (North Carolina Geographic Information
Coordinating Council, 2019).
Using the State and Local Government Profile as
a guideline, data layers developed in support of high-
scale food security research should be cognizant of
the following entries that already exist within this
profile which speak explicitly to data quality and data
discoverability:
1) Process Description: A repeatable element that
provides a description of how the data were
created and indicate the data source, where
applicable. This process description should
include any geoprocessing and/or field
calculations used to derive spatial and attribute
data derived for the sole purpose of food security
research. This process description should also
contain the source scale denominator and
publication date of source information, where
available to clarify positional and temporal
accuracy respectively.
2) Topic Category: A theme keyword that adheres
to at least one of the ISO Topic Categories.
3) Feature Catalogue: Entity and Attribute
Descriptions and Citations referenced to ISO
19110, where possible.
In addition, the following Data Quality elements not
explicitly addressed in this profile should be
completed to catalog attempts to maintain the highest
possible accuracies given this scale of analysis.
While not required, this cataloguing should strive to
achieve popular positional (horizontal and vertical)
accuracy standards such as the National Mapping
Accuracy Standards (NMAS) for paper maps (United
States Bureau of the Budget, 1947) and more recent
National Standard for Spatial Data Accuracy
(NSSDA) used for digital data (Federal Geographic
Data Committee, 1998)
1) Attribute Accuracy Report: an explanation of the
accuracy of the identification of the entities and
assignments of values in the data set and a
description of the tests used. This may be useful
if food sources and/or destinations have been
field checked for attribute errors.
2) Quantitative Attribute Accuracy Assessment: a
value assigned to summarize the accuracy of the
identification of the entities and assignments of
values in the data set and the identification of the
test that yielded the value.
3) Attribute Accuracy Value: an estimate of the
accuracy of the identification of the entities and
assignments of attribute values in the data set.
4) Logical Consistency Report: an explanation of
the fidelity of relationships in the data set and
tests used. This may be applicable if data used in
the same analysis or derivation of attributes come
from multiple data sources and/or at different
scales.
5) Completeness Report: information about
omissions, selection criteria, generalization,
definitions used, and other rules used to derive
the data set. Useful for both spatial data and
attribute completion.
6) Horizontal Positional Accuracy Report: an
explanation of the accuracy of the horizontal
coordinate measurements and a description of the
tests used. This may be useful when field
checking the locations of food sources and/or
destinations.
7) Horizontal Positional Accuracy Value: an
estimate of accuracy of the horizontal positions
of the spatial objects.
GISTAM 2020 - 6th International Conference on Geographical Information Systems Theory, Applications and Management
28

8) Horizontal Positional Accuracy Explanation:
the identification of the test that yielded the
Horizontal Positional Accuracy Value.
9) Vertical Positional Accuracy Report (where
applicable): an explanation of the accuracy of
the vertical coordinate measurements and a
description of the tests used (FGDC 2000).
6 CONCLUSIONS
Food security entails the ability, whether it be at the
individual, community or national scale, to procure
nutritious and affordable food. While GIS has
increasingly become a powerful tool to map spatial
dimensions of food security and the factors that help
explain it, little research has been performed to
determine what themes are useful in local-level food
security research. Given that data and the people that
develop it are the most expensive component of any
GIS project, this is especially important when limited
resources exist. This data development can take on
many forms, ranging from the downloading of
existing data, extraction from currently existing
databases, the creation of brand-new spatial data via
digitization, geocoding or the use of remotely sensed
imagery, either purchased, procured or captured using
a UAS (Unmanned Aircraft System). Regardless of
the method, time and personnel resources must be
utilized in order to derive the attributes that facilitate
food security research while cataloguing these
people, processes and resources.
The database requirements for food security
analysis in the digital environmental at a local scale
are much different than those needs at the
national/sub-national scale. National scale and sub-
national (state) studies in food security explore the
economics of food production and links between this
food and those who need it using data such as land
cover, soil type, low-scale transportation networks
(both road and railroad), state and county outlines
using coarse and general data. High-scale analysis at
the block group and even pixel scale requires more
specialized data, analysis, attribution and cataloguing
than data grouped at tracts, the standard for a lot of
research, including the United States Department of
Agriculture Food Access Atlas, as well as more
coarse zip codes and counties. From a data
development standpoint, the realization of a database
in support of local-scale food security research
requires a reconciliation between developing the
correct data layers while developing them at an
appropriate scale that allows for local-level (sub
county) scale analysis.
In a survey of 32 GIS professionals who utilize
GIS data in support of food security research,
questions were asked about their opinions of various
themes and their relative importance in food security
research. Themes directly related to the food
environment and food accessibility such as grocery
stores, roads and farmers’ markets were ranked
highest by these GIS professionals. In addition, sub-
county census units such as census tracts and block
groups were ranked higher than counties, highlighting
the need for higher-scale data compared to the coarser
county-level data.
In addition, attributes used to describe these
themes were prioritized in this survey. Information
related to distance (more specifically distance from
resources) and socio-demographic indicators such as
income, race/ethnicity and household size ranked
amongst the highest in the GIS community. This ties
in directly with food desert research and specifically
the USDA definition of a food desert, which utilize
both distance and poverty components. Lastly,
various dimensions of data quality exist and users
were asked to rank them in their order of importance.
Positional accuracy and attribute accuracy ranked the
highest while the cataloguing of data in the form of
data was ranked the lowest.
The specific focus of this work has been on the
collection, integration, analysis, assessment and
description of geospatial data that is of a type and
level of detail to be of practical value in the
development, implementation and evaluation of
interventions addressing food security. While the
results of this work can be used as pure research in
and of itself, it is anticipated that results can be used
in helping to facilitate decision-making and formulate
policy at directly addressing and remediating the
phenomenon of food deserts. Furthermore, it
addresses the technical aspects of geospatial database
development such as attribution, naming conventions
and metadata according to existing standards such as
the ISO-based North Carolina State and Local
Government Metadata Profile. While some minor
questions still remain unanswered such as the
potential for cross-validation or the use of qualitative
data given that food desert research has been trending
towards a mixed-methods approach combining
qualitative and quantitative data, it is our hope to
further explore cost-effective methods for needs
assessment that take into account both causal
complexity and programmatic challenges imposed by
the combination of limited resources and increased
demand. Integrating GIS technologies with
intervention planning has the potential to be a cost-
effective means for organizations to conduct effective
A Public Participatory Approach toward the Development of a Comprehensive Geospatial Database in Support of High-scale Food Security
Analysis
29

planning aimed at improving food and nutritional
security at multiple spaital and temporal scales.
Prudent database development serves as the
cornerstone of this effective planing and
implementation.
ACKNOWLEDGEMENTS
The project was supported by the Agricultural and
Food Research Initiative Competitive Program of the
USDA National Institute of Food and Agriculture
(NIFA), grant number 2016-67023-24904.
This material is also based upon work supported by
the National Science Foundation under Grant No.
1824949. Any opinions, findings, and conclusions or
recommendations expressed in this material are those
of the author(s) and do not necessarily reflect the
views of the National Science Foundation.
REFERENCES
Apparicio P., Cloutier M.S. and Shearmur, R. 2007. The
case of Montreal’s missing food deserts: evaluation of
accessibility to food supermarkets. International
Journal of Health Geographics 6:4: 1-13.
Babatunde R.O., Omotesho O.A. and Sholatan, O.S. 2010.
Factors influencing food security status of rural farmers
in North Central Nigeria. Agricultural Journal 2(3):
351-357.
Bedard, Y. 1987. Uncertainties in land information systems
databases. Proceedings of the 8th International
Symposium on Computer Assisted Cartography (Auto
Carto 8), (pp. 175-184). Baltimore, MD.
Bernknopf, R. and Shapiro, C. 2015. Economic assessment
of the use value of geospatial information. ISPRS
International Journal of Geo-Information 4: 1142–
1165. doi: 10.3390/ijgi4031142
Blanchard, T. & Lyson, T. 2006. Access to low cost
groceries in nonmetropolitan counties: Large retailers
and the creation of food deserts. Paper presented at the
Measuring Rural Diversity Conference, Washington,
DC [online]. Retrieved from: http://srdc.msstate.edu/
trainings/presentations_archive/2002/2002_blanchard.
pdf
Block J.P., Scribner R.A. and DeSalvo K.B. 2004. Fast
food, race/ethnicity, and income: a geographic analysis.
American Journal of Preventative Medicine 27: 211–
217.
Both, A., Wauer, M., Garcia-Rojas, A, Hladky, D and
Lehmann, J. 2015. GeoKnow Generator Workbench –
An integrated tool supporting the linked data lifecycle
for enterprise usage. Proceedings of the 11th
International Conference on Semantic Systems Posters
and Demos, of SEM '15. 92-92.
Burns, C. and Inglis, A. 2007. Measuring food access in
Melbourne: access to healthy and fast foods by car, bus
and foot in an urban municipality in Melbourne. Health
Place 13: 877–885.
California Center for Public Health Advocacy. 2007.
Searching for Healthy Food: The Food Landscape in
California Cities and Counties [online]. Retrieved
from http://www.publichealthadvocacy.org/RFEI/
expanded percent20methods.pdf
Centers for Disease Control and Prevention. 2011.
Children’s Food Environment State Indicator Report,
2011 [online]. Retrieved from http://www.cdc.gov/
obesity/downloads/ChildrensFoodEnvironment.pdf
Chen, X. and Clark, J. 2013. Interactive three-dimensional
geovisualization of space–time access to food. Applied
Geography 43: 81–86.
Chilton, M. and Rose, D. 2009. A Rights-Based Approach
to Food Insecurity in the United States American
Journal of Public Health 99: 1203_1211, https://doi.
org/10.2105/AJPH.2007.130229
Clarke, G., Heather E., and Guy, C. 2002. Deriving
Indicators of Access to Food Retail Provision in British
Cities: Studies of Cardiff, Leeds and Bradford. Urban
Studies 39(11): 2041-2060.
Clary C.M., Ramos Y., Shareck, M., and Kestens, Y. 2015.
Should we use absolute or relative measures when
assessing foodscape exposure in relation to fruit and
vegetable intake? Evidence from a wide-scale Canadian
study. Preventative Medicine (Baltimore) 71: 83–87.
Cooksey-Stowers, K, Schwartz, M. and Brownell, K. 2017.
Food Swamps Predict Obesity Rates Better than Food
Deserts in the United States. International Journal of
Environmental Research and Public Health 14: 1366.
D’Acosta, J. 2015. Finding food deserts: a study of food
access measures in the phoenix-mesa urban area
(Master’s Thesis). University of Southern California.
Los Angeles, CA.
Donkin, A. J., Dowler, E. A., Stevenson, S. J., & Turner, S.
A. 1999. Mapping access to food at a local level. British
Food Journal 101(7): 554.
Epstein, E. F. 1988. Litigation over information: The use
and misuse of maps. Proceedings, IGIS: The Research
Agenda 1 (pp. 177-184). Washington, D.C.: NASA.
Food and Agriculture Organization of the United Nations.
2009. Declaration of the World Summit on Food
Security [online]. Retrieved from
ftp://ftp.fao.org/docrep/fao/Meeting/018/k6050e.pdf
Federal Geographic Data Committee (FGDC). 1998.
Geospatial Positioning Accuracy Standards Part 3:
National Standard for Spatial Data Accuracy. FGDC-
STD-007.3-1998.
Federal Geographic Data Committee (FGDC). 2000.
Content Standard for Digital Geosp atial Metadata
Workbook. Washington D.C.: Federal Geographic
Data Committee.
Federal Geographic Data Committee (FGDC). 2011.
United States Thoroughfare, Landmark and Postal
Address Data Standard. Washington D.C.: Federal
Geographic Data Committee.
GISTAM 2020 - 6th International Conference on Geographical Information Systems Theory, Applications and Management
30

Furey, S., Strugnell, C. and McIlveen, H. 2001. An
Investigation of the Potential Existence of “Food
Deserts” in Rural and Urban Areas of Northern Ireland.
Agriculture and Human Values 18: 447–457.
Gallagher M. 2006. Examining the impact of food deserts
on public health in Chicago. Mari Gallagher Research
and Consulting Group [online]. Retrieved from
http://www.marigallagher.com/site_media/dynamic/pr
oject_files/1_ChicagoFoodDesertReport-Full_.pdf
Gross, J. and Rosenberger, N. 2005. Food Insecurity in
Rural Benton County: An Ethnographic Study.
Working Paper No. 05-02, Rural Studies Program,
Oregon State University, Corvallis, OR.
Guy, C. M., Clarke, G., & Eyre, H. 2004. Food retail change
and the growth of food deserts: a case study of Cardiff.
International Journal of Retail & Distribution
Management, 32: 72–88.
Hallett, L. and McDermott, D., 2011. Quantifying the
extent and cost of food deserts in Lawrence, Kansas,
USA. Applied Geography 31: 1210–1215.
Jago R., Baranowski T., Baranowski J.C. 2007. Distance to
food stores and adolescent male fruit and vegetable
consumption: mediation effects. International Journal
of Behavioral, Nutritional and Physical Activity 4:35.
Janssen, M., Charalabidis, Y. and A. Zuiderwijk. 2012.
Benefits, adoption barriers and myths of open data and
open government. Information Systems Management
29(4): 258 – 268.
Jiao, J., Moudon, A., Ulmer, J., Hurvitz, P. and
Drewnowski, J. 2012. How to identify food deserts:
Measuring physical and economic access to
supermarkets in King County, Washington. American
Journal of Public Health 102(10): 32–39.
Johnson, P. A., Sieber, R., Scassa, T., Stephens, M. and
Robinson, P. 2017. The Cost (s) of Geospatial Open
Data. Transactions in GIS 21: 434–445,
Koutnik, Mike. 1996. The Benefits of GIS in Local
Government: Examples from ESRI’s User Community.
Environmental Systems Research Institute, Inc.
(Unpublished).
Ledbetter, M., Carder Hunt and Don Anderson. 1997.
Blueprints for a Citywide GIS: Scottsdale’s Award-
Winning System Provides a Profitable Example. GIS
World, November, 62-64.
Lewis, L.B., D.C.Sloane, L.M. Nascimento, A.L. Diamant,
J.J. Guinyard, A.K. Yancey, G. Flynn. 2005. "African
Americans' Access to Healthy Food Options in South
Los Angeles Restaurants." American Journal of Public
Health 95(4): 668-73.
Love, G., Mulrooney, T., and Brown, L. 2012. Using GIS
to address food availability in Durham, North Carolina.
The North Carolina Geographer 19: 34-52.
Lovett, A., Haynes, R., Sunnenberg, G., & Gale, S. 2002.
Car travel time and accessibility by bus to general
practitioner services: a study using patient registers and
GIS. Social Science & Medicine. 55(1): 97–111.
Major E., Delmelle E., Delmelle E. 2018 SNAPScapes:
Using geodemographic segmentation to classify the
food access landscape. Urban Science 2:71. doi:
10.3390/urbansci2030071.
Mamen, Katy. 2007. “Facing Goliath: Challenging the
Impacts of Supermarket Consolidation on our Local
Economies, Communities, and Food Security.” Policy
Brief, The Oakland Institute 1(3): 1-8.
McEntee, J., and Agyeman, J. 2010. Towards the
development of a GIS method for identifying rural food
deserts: Geographic access in Vermont, USA. Applied
Geography 30(1): 165–176.
Morton, L., Bitto, E. and Oakland, M. 2005. Solving the
Problems of Iowa Food Deserts: Food Insecurity and
Civic Structure. Rural Sociology 70(1): 94–112.
Morton, L., and Blanchard, T. C. 2007. Starved for access:
Life in Rural America’s food deserts. Rural Realities
1(4):1–10.
Mulangu, F. and Clark, J. 2012. Identifying and measuring
food deserts in rural Ohio. Journal of Extension, 50(3):
3FEA6. Retrieved from: http://www.joe.org/joe/
2012june/a6.php.
Mulrooney, T., McGinn, C., Branch, B., Madumere, C. and
Ifediora, B. 2017. A New Raster-Based Metric to
Measure Relative Food Availability in Rural Areas: A
Case Study in Southeastern North Carolina.
Southeastern Geographer 57(2): 151 - 178.
North Carolina Geographic Information Coordinating
Council (NCGICC). 2018. North Carolina State and
Local Government Metadata Profile for Geospatial
Data and Services [online]. Retrieved from
http://www.nconemap.gov/DiscoverGetData/Metadata
.aspx#iso.
Obioha, E.E. 2009. Climate Variability, Environment
Change and Food Security Nexus in Nigeria. Journal of
Human Ecology 26(2): 107-121.
Opfer, P. 2010. Using GIS technology to identify and
analyze ‘food deserts’ on the southern Oregon coast.
Oregon State University Archives 1–52.
Pearce, J., Witten, K., & Bartie, P. 2006. Neighbourhoods
and health: a GIS approach to measuring community
resource accessibility. Journal of Epidemiology and
Community Health 60(5): 389–395.
Powell, L. M., Slater, S., Mirtcheva, D. Bao, Y. and
Chaloupka, F. 2007. Food Store Availability and
Neighborhood Characteristics in the United States.
Preventive Medicine 44:198-95.
Rose, D. and Richards, R. 2004. Food Store Access and
Household Fruit and Vegetable Use Among
Participants in the US Food Stamp Program. Public
Health Nutrition 7(8):1081-8.
Rose D., Bodor J.N., Swalm C.M., Rice J.C., Farley T.A.,
Hutchinson P.L. 2009. Deserts in New Orleans?
Illustrations of urban food access and implications for
policy. Paper presented at: University of Michigan
National Poverty Center/USDA Research Conference
on Understanding the Economic Concepts and
Characteristics of Food Access; February 2009;
Washington, DC [online]: Retrieved from:
http://www.npc.umich.edu/news/events/food-access/
rose_et_al.pdf.
Salgé, F. 1995. Semantic accuracy. In S.C. Guptill and J.L.
Morrison (Eds.), Elements of Spatial Data Quality (pp.
139-152). New York: Elsevier Science Ltd.
A Public Participatory Approach toward the Development of a Comprehensive Geospatial Database in Support of High-scale Food Security
Analysis
31

Sharkey, J. R., and Horel, S., 2008. Neighborhood
socioeconomic deprivation and minority composition
are associated with better potential spatial access to the
ground-truthed food environment in a large rural area.
Journal of Nutrition 30(5): 620–627.
Soneye, Alabi. 2014. Farm Holdings in Northern Nigeria
and Implication for Food Security: A Remote Sensing
and GIS Assessment. African Journal of Food and
Agriculture, Nutrition and Development 14(2): 1-15.
United States Bureau of the Budget, 1947, United States
National Map Accuracy Standards: U.S. Bureau of the
Budget, Washington, D.C.
United States Geological Survey (USGS). 1997. Spatial
Data Transfer Standard (SDTS): Logical
specifications. Reston, Virginia: United States
Geologic Survey.
Van Hoesen, J., Bunkley, B. & Currier, C. 2013. A GIS-
based methodology toward refining the concept of rural
food deserts: a case study from Rutland County,
Vermont. Journal of Agriculture, Food Systems and
Community Development 3(2): 61-76.
Ver Ploeg, M., Breneman, V., Farrigan, T., Hamrick, K.,
Hopkins, D., et al. 2009. Access to affordable and
nutritious food–measuring and understanding food
deserts and their consequences: Report to congress.
Washington, D.C.: United States Department of
Agriculture, Economic Research Service.
Wang, Z. 2012. Socio-demographic and economic
determinants of food deserts (Master’s Thesis).
University of Arkansas. Fayetteville, AR.
Wrigley, N. 2002. ‘Food Deserts’ in British cities: policy
context and research priorities. Urban Studies 39(11):
2029–2040.
Zenk S.N., Powell, L.M., Rimkus, L., Isgor, Z. and Barker,
D.C. 2014. Relative and absolute availability of
healthier food and beverage alternatives across
communities in the United States. American Journal of
Public Health 104: 2170–2179.
GISTAM 2020 - 6th International Conference on Geographical Information Systems Theory, Applications and Management
32
