
Advanced Analytics to Predict Survivability of Breast Cancer
Patients
Sonal Bajaj
1 a
and Waqar Haque
2 b
1
Northern Health, Prince George, Canada
2
Department of Computer Science, University of Northern British Columbia, Prince George, Canada
Keywords: Data Modeling, Health Informatics, Oncology, Breast Cancer, Health Care Systems.
Abstract: A frequently asked question by cancer patients post-diagnosis is the lifespan they are left with. The
oncologist’s response is generally based on past records of cancer patients with similar prognosis or by
consulting other physicians and researchers working on comparable cases. Although careful prognosis is vital,
it is difficult to predict accurate survival time of patients as survivability is based on many factors. Also, these
predictions may not be accurate as the past records are not completely reliable and the prognosis from different
oncologists are generally inconsistent. Further, existing repositories of data are not easily accessible and the
stored formats are difficult to analyze. We propose an end-to-end process to build a model which predicts
survival months of breast cancer patients. The predictive model is trained, tested and validated with different
subsets of data. The modeling techniques used in this research are Neural Networks, CHAID, C&RT and an
Ensemble of these techniques. The predictive model can also be used as a calculator which predicts survival
months of a specific case.
1 INTRODUCTION
Cancer is generally referred to as a large group of
diseases that can affect any part of the human body.
It is the uncontrolled growth of cells, which can
invade a localized area or spread to other body parts
(WHO, n.d.). In Canada, cancer is the leading cause
of mortalities accounting for 30% of all deaths
(Canadian Cancer Society). Breast cancer remains the
most commonly diagnosed cancer among women. In
2015, Canadian Breast Cancer Foundation (CBCF)
reported that one in four Canadian women were
diagnosed with breast cancer making it the second-
most leading cause of cancer deaths in Canadian
women (CBCF, n.d.). According to GLOBOCAN, in
2018, breast cancer ranked highest in incidence
(46.3%) and second highest in mortality (13.0%)
rates, worldwide (GLOBOCAN, 2018). Putting a
different perspective on this, every 19 seconds, a
breast cancer case is diagnosed among women and
every 74 seconds, a breast cancer patient dies
(Komen, 2011).
a
https://orcid.org/0000-0002-9323-9453
b
https://orcid.org/0000-0002-6921-8097
Historical data from cancer patients’ medical
records is a very powerful source of information. It
helps oncologists and researchers find the grounds for
inter-relationships of present to historical cases
(Meren, 2014). Using historical data to predict
outcomes in breast cancer could be dated back to
1992 where neural network analysis was used to
predict the recurrence of breast cancer (Ravdin, et al.,
1992). However, with no specific global standard to
record patient data, a wide inconsistency is often
observed across the available data. Despite this
inconsistency, these records remain invaluable
medical literature. The National Cancer Institute’s
Surveillance, Epidemiology, and End Results (SEER)
Program is a premier source for cancer statistics in the
United States (SEER, n.d.). This data source has
formed the basis of several studies because of the
volume and credibility of data. We have used forty
years of cancer data from this repository to develop a
model which predicts survival months of a breast
cancer patient. The proposed model is trained, tested
and validated with different subsets of data. The
predictor’s selection is based on Key Performance
Indicators (KPIs) identified by analysis and
Bajaj, S. and Haque, W.
Advanced Analytics to Predict Survivability of Breast Cancer Patients.
DOI: 10.5220/0008857302950302
In Proceedings of the 13th International Joint Conference on Biomedical Engineering Systems and Technologies (BIOSTEC 2020) - Volume 5: HEALTHINF, pages 295-302
ISBN: 978-989-758-398-8; ISSN: 2184-4305
Copyright
c
2022 by SCITEPRESS – Science and Technology Publications, Lda. All r ights reserved
295

consultations with an oncologist. Several data mining
algorithms are used to compare and select the
technique, or an ensemble thereof, for best results.
2 RELATED WORK
The existing predictive models have used data mining
techniques such as artificial neural networks, decision
trees and statistical methods to predict cancer
survival. Two data mining techniques, artificial
neural networks and decision trees (C5), and one
statistical technique, logistic regression, were
compared using the SEER public-use database
(SEER, n.d.) for the period 1973-2000 (Delen,
Walker, & Kadam, 2005). The cleansed,
preprocessed dataset consisted of 202,932 records.
Only 17 out of 72 variables were selected; these
comprised of 1 dependent variable and 16 predictor
variables including race, age, grade, marital status,
primary site code, histology, behavior, extension of
disease, lymph node involvement, radiation, stage of
cancer and tumor size. The comparative performance
was evaluated by accuracy, sensitivity, specificity
and k-fold cross-validation. The results showed that
decision tree (C5) was the best predictor with the
highest accuracy of 93%; followed by artificial neural
networks with an accuracy of 91.2%, and logistic
regression with an accuracy of 89.2%. The study is
based on the assumption that all patients died due to
breast cancer, which may not be the case (Riihimäki,
Thomsen, Brandt, Sundquist, & Hemminki, 2012).
Several spin-offs of this work followed through the
years. Bellaachia and Guven (Bellaachia & Guven,
2006) added VSR and COD variables to their study.
A new dependent variable Survivability was derived
using Survival Time Recode (STR) and VSR.
Accuracy, precision, and recall performance
measures are used to evaluate the data mining
techniques. The experimentation ranked Naïve Bayes
technique as best followed by neural networks and
C4.5 algorithms. One limitation of this study, as
stated by the authors, is the exclusion of records with
missing data (Extent of Disease and Site Specific
Surgery). Endo et al. (Endo, Takeo, & Tanaka, 2008)
compared seven algorithms to predict breast cancer
survival. Among these methods, Logistic Regression
showed the highest accuracy (85%), Decision tree
(J48) showed the highest sensitivity and ANN
displayed the highest specificity. A study by Wang et
al. (Wang, Bunjira, Wu, & Lin, 2013) predicts 5-year
breast cancer patient survivability by using two data
mining techniques: logistic regression and decision
tree, with conclusion that logistic regression is
comparatively superior. A few studies have focused
on developing models to predict presence of cancer in
addition to performing a comparison of the data
mining techniques (Chaurasia & Pal, 2017) (Senturk
& Kara, 2014).
A hybrid scheme based on fuzzy decision trees as
an alternative to breast cancer prognosis was
investigated (Khan, Choi, Shin, & Kim, 2008). The
final dataset of 162,500 records with 16 variables and
a binary target variable was used for experimentation.
It was concluded that hybrid fuzzy decision tree
classification technique (accuracy 85%) is more
powerful and fair than independently applied decision
tree classification technique (accuracy 82%). Three
different models for cancer prognosis were examined:
Bayesian Network (BN) model, Artificial Neural
Network (ANN) model and hybrid BN/ANN model
(Choi, Han, & Park, 2009). The SEER public-use
database (SEER, n.d.) for the period 1973-2003 with
294,275 records and 9 input variables was used. For
a threshold of 60 months, the proposed hybrid BN
model and ANN model performed better than the
Bayesian network. The results also showed that ANN
mostly contributed to the better performance of the
hybrid BN model.
Ensembles combine prediction outcomes of
individual classification techniques in order to
achieve better accuracy (Alpaydin, 2004). Common
ensemble techniques include bagging, boosting,
voting and stacking (IBM Knowledge Centre, n.d.).
Ensembles modeling techniques only combine
classification techniques, unlike hybrid modeling
technique which can combine classification and
clustering, or clustering and association techniques.
Agrawal et al. (Agrawal, Misra, Narayanan,
Polepeddi, & Choudhary, 2012) used an ensemble of
several data mining algorithms to develop an online
lung cancer outcome calculator. The predictive model
was built with 64 variables and the online calculator
was built by selecting 13 of these variables selected
on the basis of predictive power. Overall, the
Ensemble voting classification technique performed
best with the highest prediction accuracy (91.4%) and
AUC (94%). This was later extended to develop a
Breast Cancer Outcome (BOSOM) calculator
(Meren, 2014) for online survival measurement using
data mining and predictive modeling on the SEER
public-use database (SEER, n.d.) (1973-2010). The
study concluded with average accuracies of the
calculator (which uses a subset of variables) and
complete dataset at 88.27% and 90.71%, respectively.
HEALTHINF 2020 - 13th International Conference on Health Informatics
296

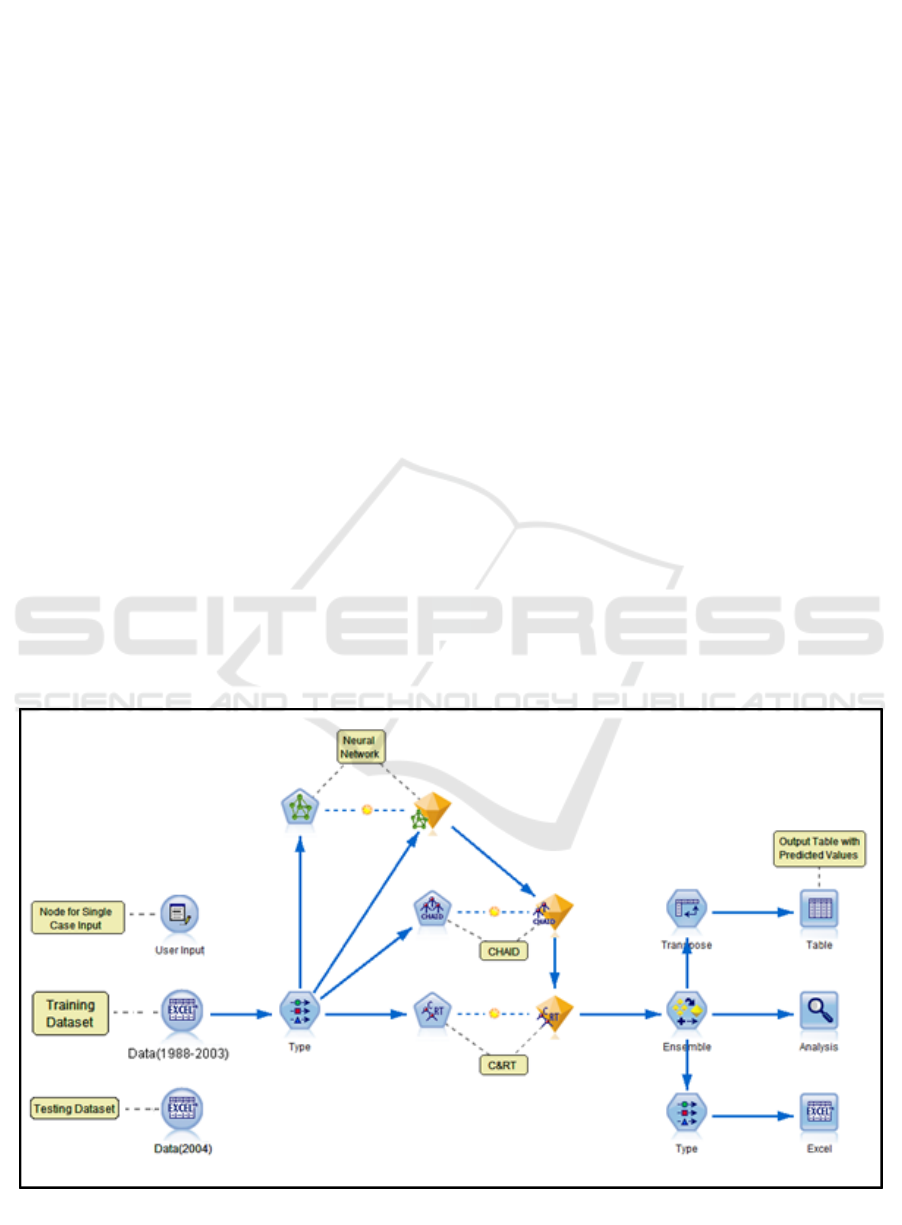
Figure 1: Methodology.
3 METHODOLOGY
Figure 1 gives an overview of the method used for our
study. It is primarily divided into three tasks: data
extraction (from raw data), data pre-processing, and
predictive modeling.
3.1 Data Extraction
The “SEER limited-use” data is defined by
demographics, treatment (e.g. surgery, radiation
therapy), diagnosis (e.g. primary site, tumor size), and
an outcome characteristic (e.g. survival time, cause of
death), which makes SEER an excellent source for
outcome analysis and prediction studies. The SEER
dataset used for this research is a collection of data
from 18 registries. We used SEER*stat statistical
software (NCI Surveillance, Epidermiology, and End
Results Program (SEER), n.d.) to extract raw data
from the SEER database. This software allows
viewing of patient record and production of different
sessions such as Frequency, Rate, Survival, and Case
Listing. After consultation with a radiation
oncologist, 30 variables were selected (from a total of
134 variables in SEER) to prepare the relevant
dataset.
3.2 Data Preprocessing
Data preprocessing was performed on extracted raw
records to produce a relevant subset. This is done at
two levels:
• SEER-related preprocessing: This includes
normalization of data, such as converting text
values to numeric representation. The derived data
is then cleansed for eliminating redundant content.
Male breast cancer cases are also eliminated.
• Problem-specific preprocessing: This includes
selecting data records for a specific time period of
significance and eliminating attributes which do
not hold any considerable predictive power.
Records which represent deaths due to a reason
other than breast cancer are also removed.
The SEER data used for this research spanned the
period 1973-2013. For training the model, 1988-2003
dataset was selected. The range of the number of
years to predict survivability is arbitrarily set at 0-10
years. Since the follow-up cut-off date for selected
SEER data is December 31, 2013, the cases registered
in 2003 or earlier are included in the training dataset.
3.3 Predictive Modeling
The first step in predictive modeling primarily
involves shortlisting of relevant variables which have
predictive power. The initial screening of narrowing
down to 30 relevant variables played an instrumental
role in this process. The target or outcome/dependent
variable is ‘survival months’. The remaining 29
variables are independent variables which are
checked if they have a relationship with the
dependent variable. A Feature Selection algorithm
was used to identify and rank the variables which are
most likely to have the highest impact. Nine of the
selected variables were marked as unimportant. The
list of remaining variables is given in Table 1.
Table 1: List of Short-listed Variables.
Input variables:
Marital Status, Race/ethnicity, Age recode,
Laterality, Histologic Type ICD-O-3, Behavior
code ICD-O-3, Regional nodes positive, Regional
nodes examined, Reason no cancer-directed
surgery, Radiation, Radiation sequence with
surgery, Surgery of Primary Site, Vital Status
recode, ER Status Recode, PR Status Recode, T
value, N value, M value, Year/Month of diagnosis
Target variable:
Survival months
Record ID (unique identifier):
Patient ID
The SPSS Modeler (IBM, n.d.), contains three classes
of modeling technique, namely, Classification,
Association and Segmentation. Since our target
variable is of continuous data type, the selection of
modeling techniques is based on the models which
allow continuous numeric range target. The relevant
classification techniques thus included Neural
Network, C&R Tree, CHAID, Linear Regression,
Generalized Linear Regression and Support Vector
Advanced Analytics to Predict Survivability of Breast Cancer Patients
297
Machines. Of these, the first three, along with their
Ensemble, were selected due to an acceptable
execution time and high correlation of variables. By
combining the predictions from multiple models in an
Ensemble, limitations of individual models can be
avoided and thereby result in high overall accuracy.
The model is trained with 15 years (1988-2003) of
data and tested on the remaining 10 years (2004-
2013). The evaluation experiments are performed on
2004 dataset which is outside of training range, but
still provides validation of survivability range from 1
to >10 years.
Figure 2 shows a screenshot of the developed
model generated using the IBM SPSS Modeler. In
this model, the Data (1988-2003) node is an Excel
source node which allows customized import from
Excel workbook(s). The Type node defines the
measurement level for each variable such as Nominal,
Ordinal, Continuous, Categorical, Flag or Typeless.
This node also defines the role of each input field such
as Input, Target, Both (Input & Target), None,
Partition, Split, Frequency, and Record ID. Input
fields are the predictors and Target is the field that the
model is expected to predict. Finally, the Modeling
nodes are classification models which use one or
more predictors to predict the target. Each modeling
node has a field option where variables are specified
as input and target. The nuggets contain complete
information of the model (rules and equations
developed) and accuracy of the independent model
formulated by the Modeler. The model summary can
be viewed by double-clicking the generated nuggets.
These nuggets are connected to the Ensemble node
which provides options to select the target field, filter
out the fields generated by ensemble models and
calculates standard error. The training and actual
outcomes are analyzed for the individual models as
well as the Ensemble in the Analysis node. The
statistical measure used to compare is mean,
minimum, maximum, mean absolute error and
standard deviation. For testing the model, the Excel
sheet in source node is replaced with the testing
dataset (Data 2004). Upon execution, the Excel
output node generates predicted outcomes for each
record. These are compared with actual values to
validate the accuracy of the predictive model.
4 EXPERIMENT AND RESULTS
The vital status statistics of actual and predictive
model’s output (i.e. measured) are compared in
Figure 3. For cases diagnosed in 2004, 83.4% of cases
are tagged ‘Alive’ and 16.6% are tagged ‘Dead’ at the
cut-off date. Our proposed model predicted these
numbers to be 82.8% and 17.2% thereby
demonstrating an accuracy of 99.3% and 96.5%,
respectively.
Figure 2: Predictive Model.
HEALTHINF 2020 - 13th International Conference on Health Informatics
298
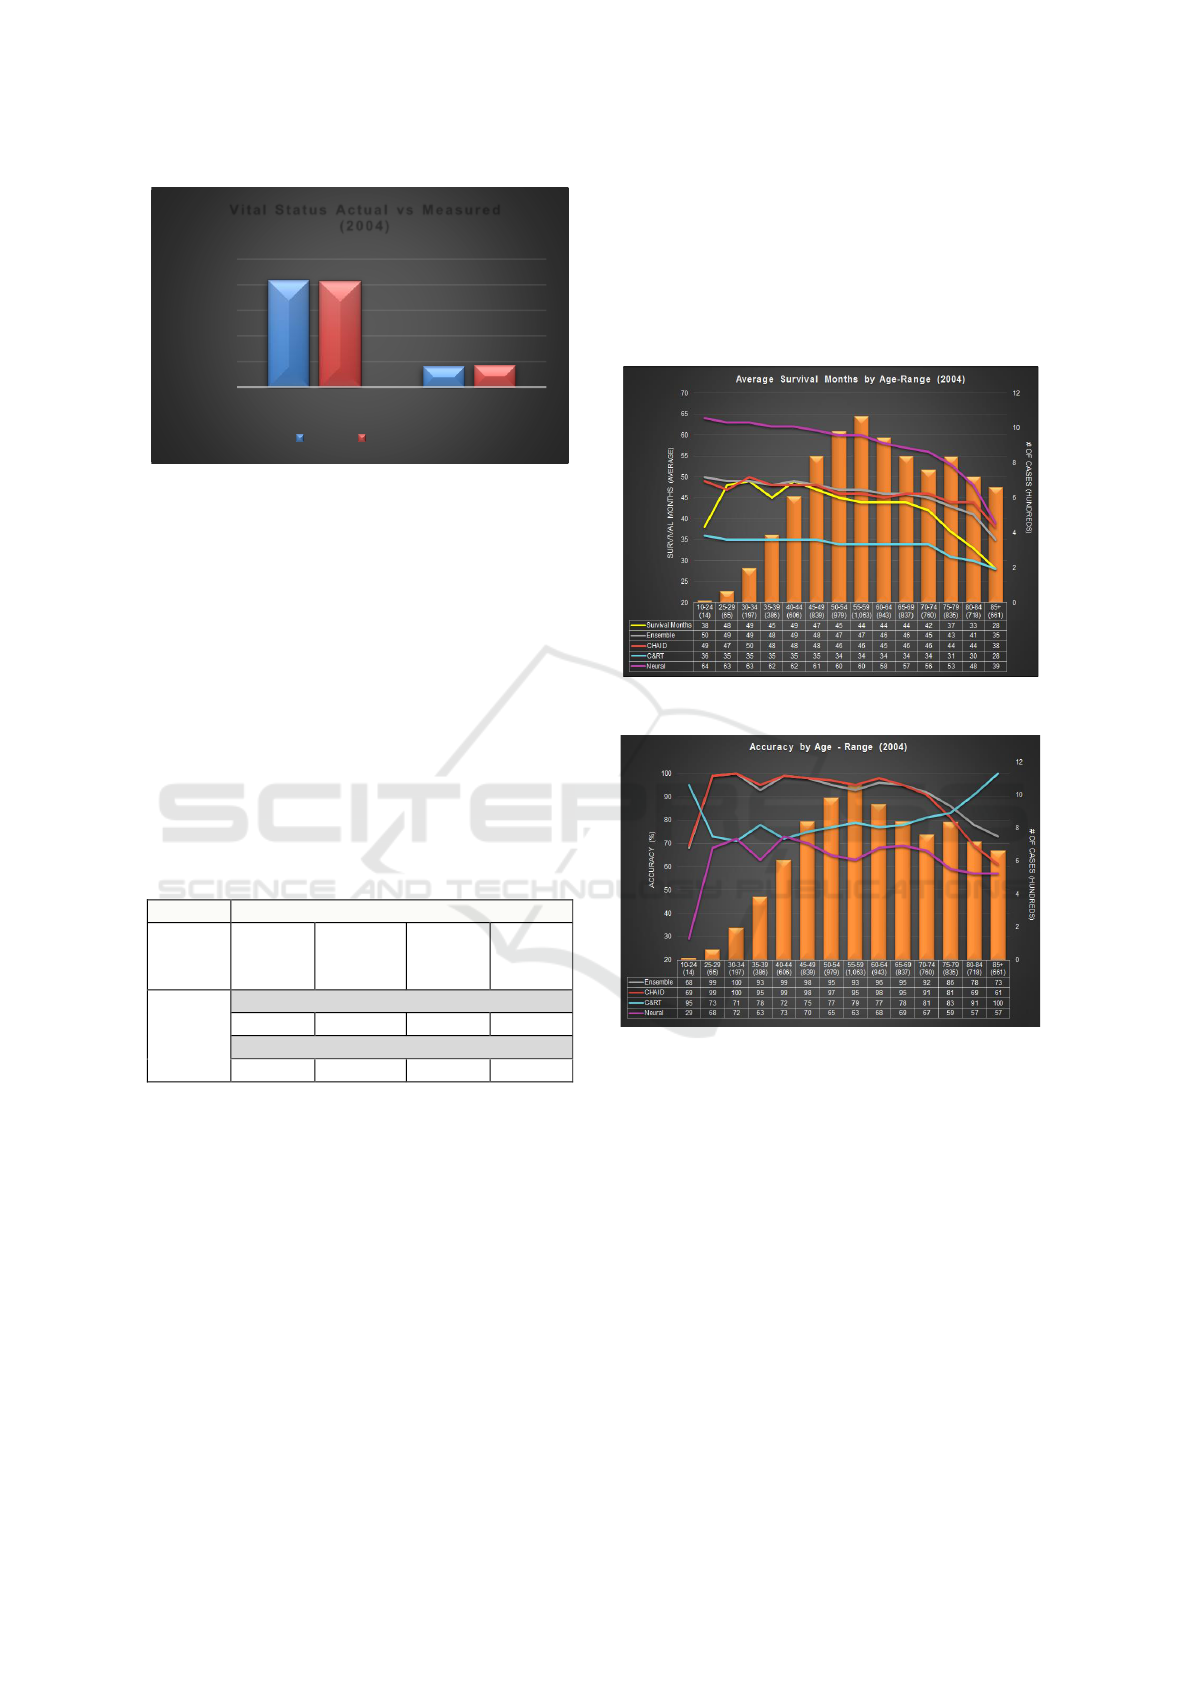
Figure 3: Vital Status comparison.
The measured (predicted) survival months for the
selected modeling techniques and their Ensemble are
shown in (Table 2). Actual survival months (average)
of cases registered in 2004 and tagged ‘Dead’ at cut-
off date is 42 months. Both Ensemble and CHAID
measured survival months (average) as 45 months
which is closest to actual survival months. C&RT and
Neural Network predicts average survival months of
33 and 56, respectively. This translates into Ensemble
yielding the highest accuracy of 93% followed by
CHAID and C&RT with 92% and 80%, respectively.
Neural Network has the lowest accuracy at 66%
which can be attributed to missing data, specifically
the TNM variables, after 2004.
Table 2: Accuracy of Modeling Techniques.
Accuracy of Modeling Techniques
Actual
Survival
Months
Ensemble
CHAID
C&RT
Neural
Network
42
T,N,M included
45 (93%)
>45 (92%)
33 (80%)
56 (66%)
T,N,M excluded
50 (81%)
53 (74%)
53 (74%)
44 (95%)
4.1 Comparison by Age-range
The bars in Figure 4 display the number of cases for
each age range. Approximately 43% of cases tagged
‘Dead’ at cut-off date fall under the 45-64 age range.
Cases with age 85 and above have lowest survival
months i.e. 28 months. The graph shows both
Ensemble and CHAID performing closest to the
actual survival months and also overlap at few data
points. Ensemble performs better than C&RT for age
70 and onwards. C&RT, on the other hand, performs
best for lowest and highest age range categories.
Neural Network predicts high survival month as
compared to actual, for all age-ranges.
In terms of accuracy (Figure 5), CHAID and
Ensemble yield the highest accuracy overall until age
75. C&RT model on other hand has the highest
accuracy of 95%, 91% and 100% for the age range
10-24, 80-84 and 85+, respectively. Neural Network
prediction ranges are the lowest at 29-79%. Ensemble
outperforms CHAID for some age-ranges.
Figure 4: Average Survival Months by Age-Range.
Figure 5: Accuracy by Age-Range.
4.2 Comparison by Marital Status
Figure 6 shows that about 45% of tagged cases are
married, 22% cases are widowed and 11% are
divorced, at time of diagnosis. The widowed cases
show the lowest value (35) for survival months. The
graph shows both, Ensemble and CHAID predict
closest to the actual survival months. The trend lines
overlap for divorced cases. C&RT predicts low
survival months as compared to other techniques
whereas Neural Network predicts in range of 45-60
months when actual survival months ranges from 35-
46. Overall, CHAID and Ensemble perform closely.
Figure 7 shows Ensemble and CHAID have the
highest accuracy for married cases. CHAID has the
83,39%
16,11%
82,78%
17,22%
0%
20%
40%
60%
80%
100%
Alive Dead
# OF CASES (%)
Vital Status Actual vs Measured
(2004)
Actual Measured
Advanced Analytics to Predict Survivability of Breast Cancer Patients
299
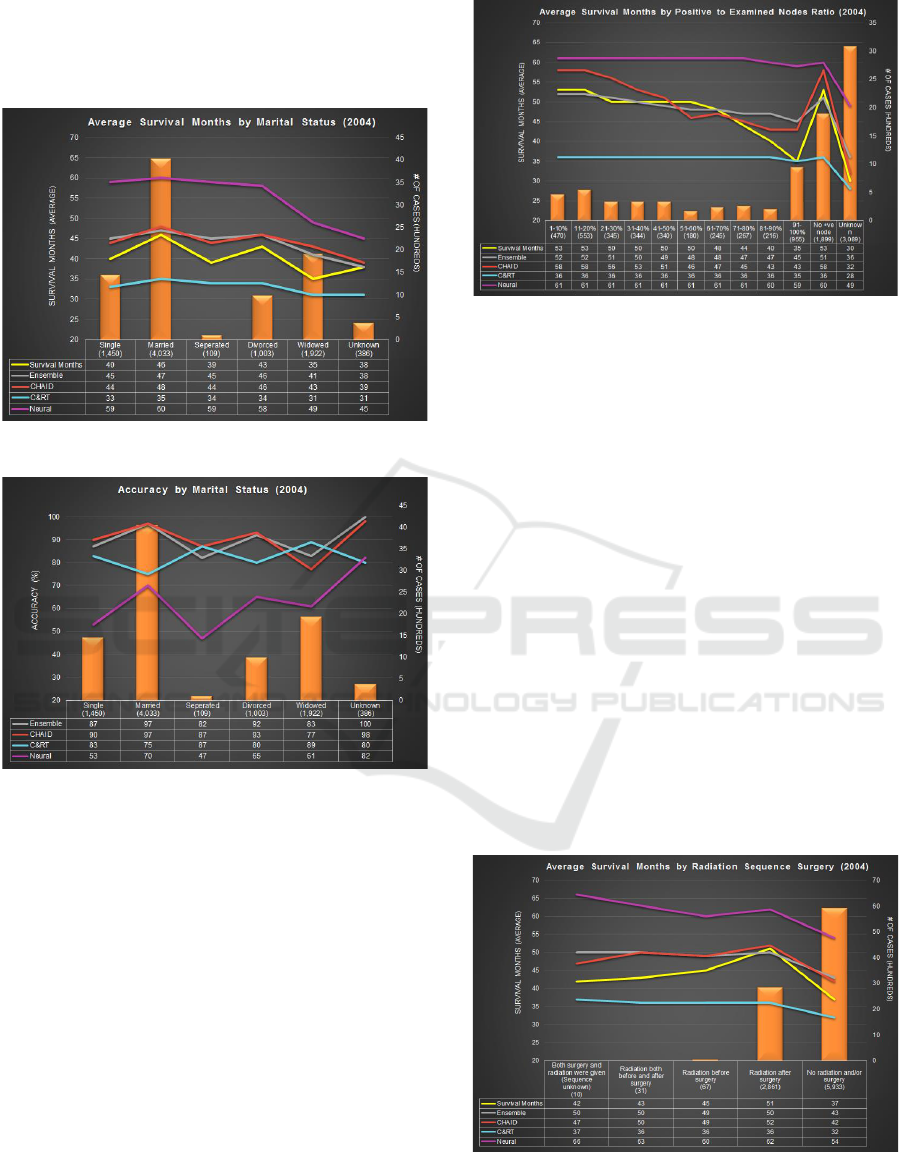
highest prediction accuracy of divorced cases i.e.
93%. C&RT has the highest prediction accuracy for
widowed cases. Neural Network tends to have low
prediction accuracy ranging from 47-82%.
Figure 6: Average Survival Months by Marital Status.
Figure 7: Accuracy by Marital Status.
4.3 Comparison by Lymph Node
Involvement
For this experiment, the ratio of positive to examined
lymph node is calculated. Higher the ratio, higher is
the degree of lymph node involvement. Amongst the
cases with examined nodes, 67% were found to have
lymph node involvement. Figure 8 shows the number
of cases in each category. The actual and measured
survival months are plotted as lines. The actual
survival months is lowest for cases with unknown
nodes examined i.e. 30. Ensemble performs better
than other modeling techniques for cases with ratio
less than 70% and cases having no positive node at
all. CHAID performs better for cases having 81-90%
and unknown ratios. Neural Network predicts
survival months in the range of 49-61 months when
actual survival months ranges from 30-53.
Figure 8: Avg SM with Lymph Node Involvement.
4.4 Comparison by Radiation and
Surgery Sequence
Figure 9 shows the distribution of cases by radiation
and surgery sequence performed. The actual survival
months are lowest for cases who died without taking
radiation or surgery i.e. 37 months. Both CHAID and
Ensemble predict 42 and 43 months for such cases,
respectively. Next, for cases which had radiation after
surgery have highest survival months (51). Ensemble
and CHAID predict 50 and 52 survival months,
respectively. C&RT and Neural Network predicted
survival months are significantly off ranging between
32-37 and 54-60 months, respectively. Similar to
other experiments, Ensemble and CHAID gave the
highest accuracies ranging from 81-98% and 83-99%,
respectively. Neural Network once again delivered
the lowest accuracy overall, except for cases
categorized as radiation after surgery. C&RT
consistently performed poorly with lowest accuracy
across all cases.
Figure 9: Avg SM by Radiation and Surgery Sequence.
HEALTHINF 2020 - 13th International Conference on Health Informatics
300
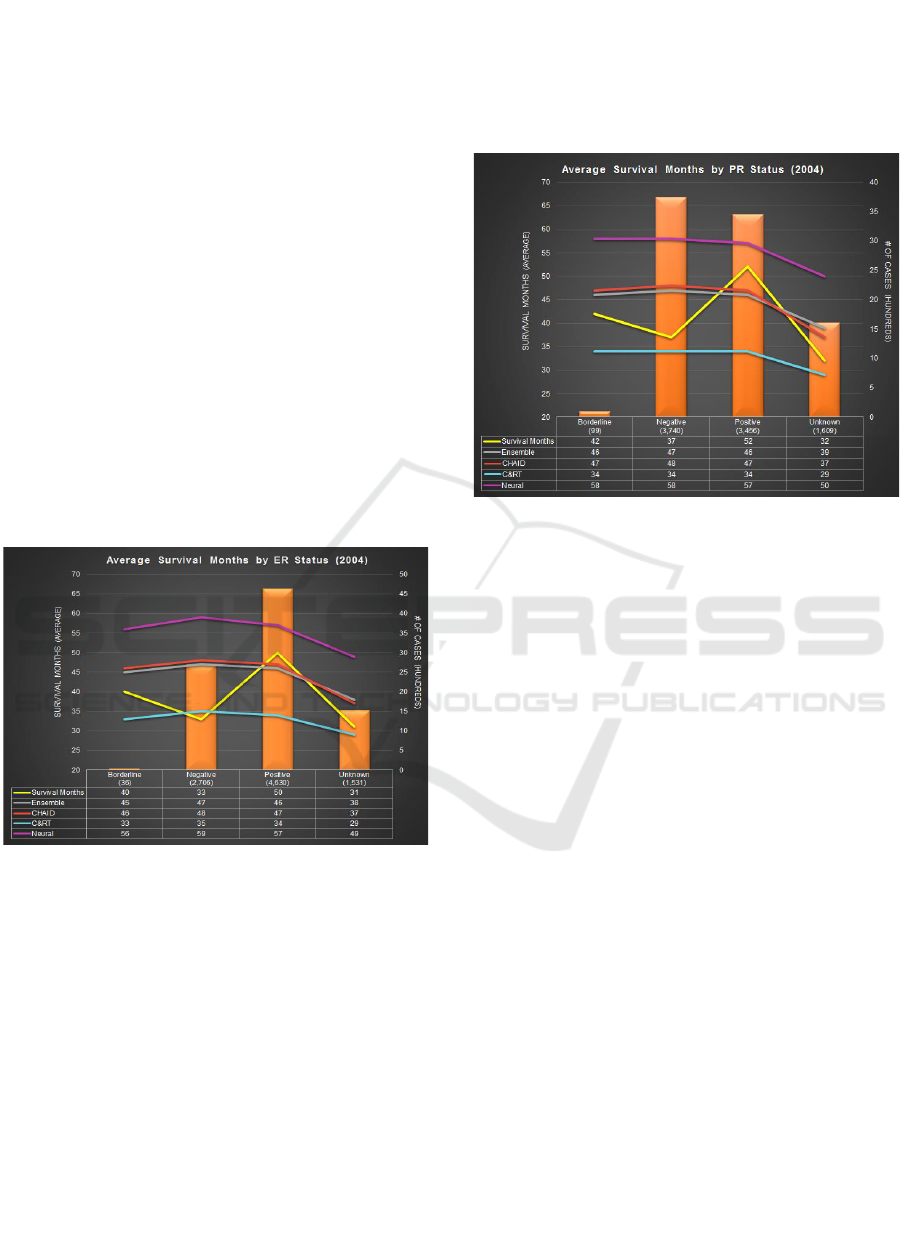
4.5 Comparison by ER Status
The Estrogen Receptor (ER) status is recorded as
positive, negative, borderline and unknown. 52% of
cases who died have positive ER status and 30% cases
have negative ER status (Figure 10). The actual
recorded survival months varies from 32-50. Cases
with unknown and negative ER status have the lowest
survival months i.e. 31 and 33 months, respectively.
Cases with positive ER status have the highest
survival months i.e. 50 months. CHAID (47 months)
performs better than Ensemble (46 months) and other
models for such case. For cases having negative ER
status, C&RT predicts 35 months compared to actual
survival months (33 months). Neural Network
predicts survival months ranging from 49-56 months
for patients with either of the ER status. For cases
with positive ER status, CHAID has the highest
accuracy at 93% closely followed by Ensemble with
91%. C&RT has the lowest accuracy for such cases
though it performs the best for cases having negative
ER status. Neural Network’s overall accuracy
remains the lowest.
Figure 10: Avg SM by ER Status.
4.6 Comparison by PR Status
The Progesterone Receptor (PR) status is recorded as
positive, negative, borderline and unknown. 42% of
cases tagged ‘Dead’ have negative PR status and 38%
of cases have a positive PR status. The actual survival
months recorded varies from 33-52 months (Figure
11). Cases with unknown and negative PR status have
the lowest survival months i.e. 32 and 37 months,
respectively. The maximum number of cases
(negative PR status), C&RT performs best with 34
survival months as compared to 37 actual survival
months. The highest survival months recorded is 52
months. CHAID and Neural Network perform best
with 47 and 57 survival months, respectively.
In terms of accuracy, C&RT has highest accuracy
for cases with negative PR status and unknown PR
status. But, CHAID has the highest accuracy for cases
with positive PR status. On the other hand, Neural
Network and Ensemble have second highest accuracy
i.e. 89% for cases with positive PR status.
Figure 11: Average Survival Months by PR Status.
4.7 Predictive Model as Calculator
The developed predictive model can predict survival
months for a large number of cases together.
However, if the user wants to predict survival months
for a specific case, the predictive model can be used
as a calculator for individual cases. To do this, the
source node is replaced by a User Input Node which
allows the user to enter values of all variables for one
patient. After entering values for each variable, the
table output node is executed (Figure 2). This
generates the range of survival months as predicted
by each modeling technique including the Ensemble.
The calculator renders results instantly.
5 CONCLUSION
In this paper, we have presented an end-to-end
process to extract and pre-process breast cancer data
to develop a predictive model. CHAID, C&RT,
Neural Networks modeling techniques along with
their Ensemble are used. It is observed that Ensemble
outperforms all other techniques by yielding an
accuracy of 93% on average. A close second is
CHAID with 92% accuracy, followed by C&RT
(80%) and Neural Networks (66%).
The model is trained with historical records of
breast cancer patients as stored in NHI’s SEER
database for the period 1988-2003 and tested with
Advanced Analytics to Predict Survivability of Breast Cancer Patients
301

dataset outside the training range (2004-2013). The
aggregated results are analyzed across different KPIs
such as age-range, marital status, lymph node
involvement, radiation and surgery sequence, ER
status, PR status, and behavior type.
The predictive model can also be used as a
calculator to predict survival months of individual
patients. The purpose is to help physicians design a
custom treatment plan for each patient by taking the
predicted survival months into consideration. Further,
an accurate survivability prediction can help patients
in deciding to opt for aggressive treatments or
palliative care, as may be deemed necessary.
REFERENCES
Agrawal, A., Misra, S., Narayanan, R., Polepeddi, L., &
Choudhary, A. (2012, August). Lung cancer survival
prediction using ensemble data mining on SEER data.
Scientific Programming - Biological Knowledge
Discovery and Data Mining, 20(1), 29-42.
Alpaydin, E. (2004). Introduction to Machine Learning
Second Edition. MIT Press.
Bellaachia, A., & Guven, E. (2006). Predicting Breast
Cancer Survivability Using Data Mining Techniques.
Age, 58(13), 10-110.
Canadian Cancer Society. (n.d.). What is Cancer?
Retrieved from http://www.cancer.ca/en/cancer-
information/cancer-101/cancer-statistics-at-a-
glance/?region=on#
CBCF. (n.d.). Breast Cancer in Canada, 2015. (Canadian
Breast Cancer Foundation) Retrieved from
http://www.cbcf.org/ontario/AboutBreastCancerMain/
FactsStats/Pages/Breast-Cancer-Canada.aspx
Chaurasia, V., & Pal, S. (2017). A Novel Approach for
Breast Cancer Detection Using Data Mining
Techniques. International Journal of Innovative
Research in Computer and Communication
Engineering, 2(1).
Choi, J. P., Han, T. H., & Park, R. W. (2009). A Hybrid
Bayesian Network Model for Predicting Breast Cancer
Prognosis. Journal of Korean Society of Medical
Informatics, 15(1), 49-57.
Delen, D., Walker, G., & Kadam, A. (2005). Predicting
breast cancer survivability: a comparison of three data
mining methods. Artificial Intelligence in Medicine,
34(2), 113-127.
Endo, A., Takeo, S., & Tanaka, H. (2008). Comparison of
Seven Algorithms to Predict Breast Cancer Survival.
Biomedical Soft Computing and Human Sciences,
13(2), 11-16.
GLOBOCAN. (2018). Cancer Today. (World Health
Organization) Retrieved from https://gco.iarc.fr/
IBM. (n.d.). IBM SPSS Modeler. Retrieved from
http://www-
01.ibm.com/support/docview.wss?uid=swg27050406
IBM Knowledge Centre. (n.d.). Decision Tree Nodes -
Ensembles. (IBM ) Retrieved from
https://www.ibm.com/support/knowledgecenter/en/SS
3RA7_15.0.0/com.ibm.spss.modeler.help/trees_cart_e
nsembles.htm
Khan, M. U., Choi, J. P., Shin, H., & Kim, M. (2008).
Predicting Breast Cancer Survivability Using Fuzzy
Decision Trees for Personalized Healthcare. 30th
Annual International IEEE EMBS Conference (pp.
5148-5151). Vancouver, British Columbia: IEEE.
Komen, G. S. (2011). Breast Cancer Facts. Retrieved from
https://ww5.komen.org/BreastCancer/FactsandStatistic
s.html
Meren, G. P. (2014, April). BOSOM Calculator: A Breast
Cancer Outcome- Survival Online Measurement
Calculator using Data Mining and Predictive Modeling
on SEER data. University of the Philippines.
NCI Surveillance, Epidermiology, and End Results
Program (SEER). (n.d.). SEER*Stat Software.
(National Cancer Institute) Retrieved 2017, from
https://seer.cancer.gov/seerstat/
Ravdin, P. M., Clark, G. M., Hilsenbeck, S. G., Owens, M.
A., Vendely, P., Pandian, M. R., & McGuire, W. L.
(1992). A demonstration that breast cancer recurrence
can be predicted by Neural Network analysis. Breast
Cancer Research and Treatment, 21(1), 44-53.
Riihimäki, M., Thomsen, H., Brandt, A., Sundquist, J., &
Hemminki, K. (2012). Death causes in breast cancer
patients. Annals of Oncology, 23(3), 604-610.
SEER. (n.d.). Data & Software for Researchers. (National
Cancer Institute) Retrieved from
seer.cancer.gov/resources/
Senturk, Z. K., & Kara, R. (2014). Breast Cancer Diagnosis
via Data Mining: Performance Analysis of Seven
Different Algorithms. Computer Science &
Engineering: An International Journal (CSEIJ), 4(1),
35.
Wang, K.-M., Bunjira, M., Wu, W.-L., & Lin, Y. (2013).
Optimal Data Mining Method or Predicting Breast
Cancer Survivability. International Journal of
Innovative Management, Information and Production
(ISME International), 3(2), 28-33.
WHO. (n.d.). Cancer. Retrieved from http://www.who.int/
cancer/en/
HEALTHINF 2020 - 13th International Conference on Health Informatics
302
