
Exploring the Merit of Collaboration in Classification and
Compression of Epilepsy EEG Signal
Rushda Basir Ahmad and Nadeem Ahmad Khan
Department of Electrical Engineering, Lahore University of Management Sciences, Lahore, Pakistan
Keywords: Compression, Binary Encoding, Epilepsy, EEG.
Abstract: Ambulatory electroencephalogram (EEG), allows collection of patients data over extended periods of time.
However, as a small recording requires large memory for storage, and this makes EEG data storage an arduous
task. Moreover, classification of EEG for extraction of relevant information is relatively challenging, and
selective data retrieval depends on task at hand. Consequently, EEG data storage and classification need to be
computationally efficient. This paper presents a combined scheme, for the simultaneous compression and
classification of EEG data, which not only decreases the overall computational effort, but also allows selective
archiving and retrieval of data. Huffman and Arithmetic coding techniques are employed on CHB-MIT scalp
EEG database and the results are presented in form of compression ratio (CR) and percentage root mean
square distortion (PDR). For classification, Intelligent Neurologist Support System (INSS), has been used.
The classifier output apart from being stored as data, is also used for intelligent data reduction, when only
specific information is required, resulting in increased CR and decreased PDR, which is desired. Hence, the
results show intelligent compression and reduction of data results in efficient management of EEG data. The
signal undergoes state-of-the-art compression such that on reconstruction it almost maintains the same
classification accuracy as the original one.
1 INTRODUCTION
Epilepsy is a common neurological disorder that
affects approximately 1% of the world’s population,
characterized by spontaneous seizures (Neligan,
2001). Electroencephalogram (EEG), is extensively
used for diagnosis of epilepsy, as it can detect
aberrant neuronal activity including seizures. Modern
neurologist support systems include facility for
automatic marking of seizure EEG as aid to
neurologists. In present ambulatory systems,
wearable and implantable EEG devices are being
researched at or available in market for diagnosis,
prediction of the occurrence of seizures and also
stimulation in effected part for suppression of
seizures. The data is transmittable wirelessly from
portable or implantable devices to a central unit and
allows for the regular monitoring of the patient or
storage.
With increasing availability of EEG data with the
neurologist, efficient ways of classification of EEG
and its intelligent reduction and compression are
becoming important. Efficiency in storage and energy
required for transmission of EEG can be maximized
if the data is reduced and compressed such that most
important events are preserved and no significant
artifacts are introduced by compression in EEG that
can change the actual nature of the events. Separate
approaches have been extensively reported in
literature for reduction and compression; but utilizing
them separately for these tasks does not ensure energy
efficiency and avoidance of compression artifacts at
increasing compression. This can create ambiguity
about the event identities. A synergy in the two
approaches is therefore desirable. One such approach
is presented in this paper and is shown to be efficient
for both tasks at the same time: Classification and
compression (along with reduction).
This paper presents a joint intelligent compression
and data reduction methodology by extending the
Intelligent Neurologist Support System (INSS)
designed earlier in the same group. (Anas, 2015)
Introduced a tool for classification of epilepsy EEG
into epileptic and non-epileptic epochs whereas the
present study combines the task of classification of
epileptic epochs with reduction and compression of
EEG signal to handle large amount of ambulatory
data. Earlier the approaches presented in (Casson,
2009) and (Chiang, 2013) focused on using very
Ahmad, R. and Khan, N.
Exploring the Merit of Collaboration in Classification and Compression of Epilepsy EEG Signal.
DOI: 10.5220/0008853700230029
In Proceedings of the 13th International Joint Conference on Biomedical Engineering Systems and Technologies (BIOSTEC 2020) - Volume 4: BIOSIGNALS, pages 23-29
ISBN: 978-989-758-398-8; ISSN: 2184-4305
Copyright
c
2022 by SCITEPRESS – Science and Technology Publications, Lda. All rights reserved
23
simple methods of classification and compression
respectively whose efficiency was limited. We have
exploited wavelet transform and show its efficacy
simultaneously for both tasks.
The rest of the paper is organized as follows.
Section 2 discusses the proposed approach; Section 3
describes the processing scheme used, Section 4
presents the test cases for the experimentation and the
results obtained. Section 5 concludes the paper.
2 PROPOSED APPROACH
This paper presents the methodology for efficient
storage or transmission of labelled EEG data in
compressed
form after automatic labelling of
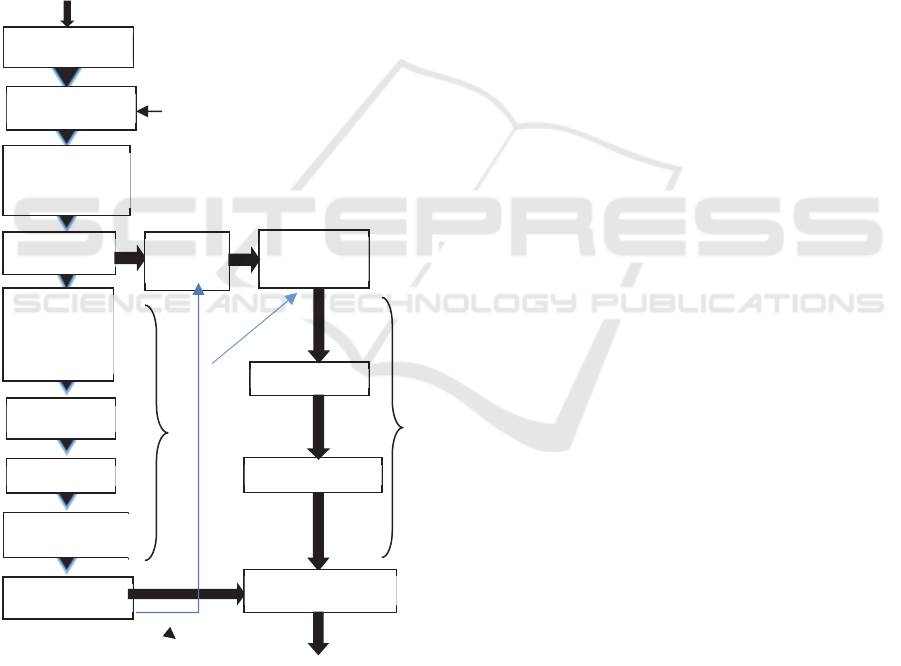
Figure 1: Block diagram for EEG classification and
compression.
epileptic and non-epileptic epochs by the classifier of
the INSS system explained in (Anas, 2015).The
compressed EEG signals, depending on neurologist’s
requirement, may consist of either all or selected
signal intervals at desired quantization levels using
the labels provided by INSS classifier. Thus, the
system also allows archiving of EEG data containing
just the events of epileptic seizures, which are the one
that are of actual interest to neurologist. Non-epileptic
epochs may be either left out or included at a coarser
resolution as per neurologist’s requirements based on
INSS classification.
The novelty of our proposed method is that it
stores the classification information output from the
SVM classifier along with the compression of EEG
data. It is brought about by the use of transform &
binary encoding techniques, which works on the same
pre-processed wavelet data as used by the classifier.
In this work we have shown how using the similar
techniques for classification and compression
provides the advantage. This advantage can be seen
in terms of reduction of overall computational effort
and better-structured storage of data as required by
the neurologists. This is coupled with almost no
impact of loss during compression on classification
performance. Loss in compression generally
compromises accurate classification. Furthermore,
we have demonstrated that the achieved compression
performance is still equivalent to the state-of-the art
methods.
3 PROCESSING SCHEME
The block diagram of the complete extended scheme
is given in Fig. 1. Each channel of a file is processed
separately. The scheme shows both the classification
and compression branches and their co-operation in
joint processing. DWT coefficients calculated for
epochs extracted from each channel are fed in to
compression and classification branches. Classifier
provides the classification labels for epileptic and
non-epileptic epochs, which are both used for storing,
selective retrieval as well as in compression of the
data.
The general steps of the processing scheme are
explained in detail as follows:
3.1 Epoch Size
Epoch is a small chunk of a signal with respect to
time. In our scheme we have extracted epochs of one
second in length, as proposed in (Anas, 2015).The
epochs extracted are non-overlapping, contiguous in
nature.
C
O
M
P
R
E
S
S
I
O
N
Full Compressed
file with labels
User I/P
SVM
ii
Select EEG file
Select
Extracting
epochs of 1 sec
DWT
Mean, Power,
Standard
Deviation
PCA
Z-score
SVM Classifier
Adaptive
Thresholding
Quantization
Binary Encoding
Data
Selection
Label
C
L
A
S
S
I
F
I
C
A
T
I
Full Syntax Signal
User
BIOSIGNALS 2020 - 13th International Conference on Bio-inspired Systems and Signal Processing
24

3.2 Discrete Wavelet Transform
Discrete Wavelet transform (DWT), is an extensively
employed feature extraction technique, which
involves signal segmentation in to orthogonal sets of
wavelets. In our method, multi-level DWT is applied
on each epoch with Daubechies-4 (db4) as mother
wavelet. The detailed coefficients levels of the DWT
are determined with respect to sampling frequency.
The detailed levels are adjusted on the run according
to the sampling frequency such as that we may get if
not exact then at least the closest separate frequency
bands i.e. Delta(δ: 0.4 – 4 Hz), Theta (θ:4-8 Hz),
Alpha (α:8-12 Hz) and Beta (β:12-30 Hz) component
of the signal. Any detailed coefficients that does not
contain frequency component from a frequency range
of 0-30 Hz were discarded.
3.3 Classification Branch
3.3.1 Statistical Features
Instead of using all of the detailed coefficients we
took the mean, standard deviation and power of each
epoch’s selected DWT coefficients as suggested by
(Subasi, 2010). Z-score standardization is then
applied on these 21 statistical features (Khan, 2013).
3.3.2 Principal Component Analysis
Principal Component Analysis is an effective
dimensionality reduction technique, maintaining data
which presents maximum variance. PCA is applied
using built in Matlab function, on obtained features
from the last stage to reduce them in order to avoid
redundant or noisy data. Those components which
projected 93 % of the total variance were used. This
resulted in reduction of statistical features from 21 to
9.
3.4 Classifier
The performance of a classifier is affected by a
number of parameters which include the number of
features, weight of features and time for performing
classification. Support Vector Machine (SVM) gives
good performance in the above constraints. It is a
supervised learning algorithm that constructs a
hyperplane with the largest distance to the nearest
training-data point of any class to minimize the
generalization error (
Mahmood, 2017). SVM is widely
used for different purposes in EEG signal processing
including identification of epileptic seizures.
In our approach, reduced features obtained
through PCA, were fed to the SVM classifier. These
features perform the initial training of the classifier.
We found linear to be the best performing kernel with
box constraint set as 50.
3.5 Compression Branch
3.5.1 Data Selection
Here the same DWT coefficients of each epoch which
were used for classification are selected on the basis
of the results of classification (labels) classified in to
epileptic or non-epileptic labels. These are used in
different test cases discussed in detail in section 4.
3.5.2 Quantization and Thresholding
The selected DWT coefficients are thresholded
adaptively. Values below a certain threshold are set to
zero. The greater the number of coefficients with the
same value, Huffman and arithmetic coder can more
efficiently encode them. This helps in achieving a
greater compression ratio (CR). By varying the level
of threshold to be set, we can increase or decrease the
number of wavelet coefficients being discarded and
consequently can control the accuracy of the
reconstructed signal. The classification labels are
utilized to make this step adaptive. For example, in
our third test case epileptic epochs and non-epileptic
epochs obtained through classification are
thresholded separately. Epileptic epochs are
thresholded on a lower threshold i.e. 0 wheras non-
epileptic epochs are thresholded at a higher threshold
i.e. 4. The thresholded coefficients are then quantized
for binary encoding.
Figure 2: Raw EEG compression Scheme.
3.5.3 Binary Encoding
In this step the selected epochs as per the test case i.e
epileptic, non-epileptic or both, are fed to the binary
encoder which then compresses, resulting in selective
storage of the data. We are using Huffman and
Arithmetic encoder separately in this step. The binary
coding is done using predefined functions of Matlab
library.
Exploring the Merit of Collaboration in Classification and Compression of Epilepsy EEG Signal
25
4 RESULTS AND DISCUSSIONS
4.1 Experimental Paradigm and Data
Acquisition
In this paper, the data from Children's Hospital
Boston database (CHB-MIT database) is used. The
database comprises of EEG recordings from
paediatric subjects with unmanageable seizures.
These recordings of 23 cases were gathered from 22
subjects (5 males, ages 3-22; and 17 females, ages 15-
19). The recording were sampled at 256 Hz. The
International 10-20 electrode placement was used for
recording EEG using 23 channels.
4.2 Classification Results
As reported in (Anas, 2015) iNSS, SVM classifier
was trained using 10-Fold cross validation method.
The results for classification were computed on
complete CHB-MIT data. 60% of the data was used
as training data while the rest 40 % was used for
classification. For CHB-MIT database, iNSS was
able achieve an average accuracy of 96.3 %, an
average specificity of 97.4% and average sensitivity
of 93.5%. As discussed in (Anas, 2015) the
classification performance of iNSS is state-of-the-art.
An accuracy of 97.98% accounts for best case
classification result. The classification results
reported for thresholded decompressed data in terms
of average accuracy, average sensitivity and average
specificity computed across all seizure files was
found comparable to the classification results
obtained for raw EEG. The similarity index between
the raw EEG classification labels and decompressed
thresholded EEG labels is reported in Table 4 and
approaches 100%.
This indicates that the artifacts and noise in the
reconstructed signal does not significantly deteriorate
the signal quality, it retains useful information even
after the compression. Similarity index between
original and reconstructed EEG is determined by
dividing the number of classification labels of
reconstructed signal similar to labels determined for
original data by total number of classification labels
given by (1)
SI= 𝑁𝑢𝑚𝑏𝑒𝑟 𝑜𝑓 𝑠𝑖𝑚𝑖𝑙𝑎𝑟 𝑙𝑎𝑏𝑒𝑙𝑠 (1)
𝑇𝑜𝑡𝑎𝑙 𝑛𝑢𝑚𝑏𝑒𝑟 𝑜𝑓 𝑙𝑎𝑏𝑒𝑙𝑠
4.3 Performance Metrics for
Compression
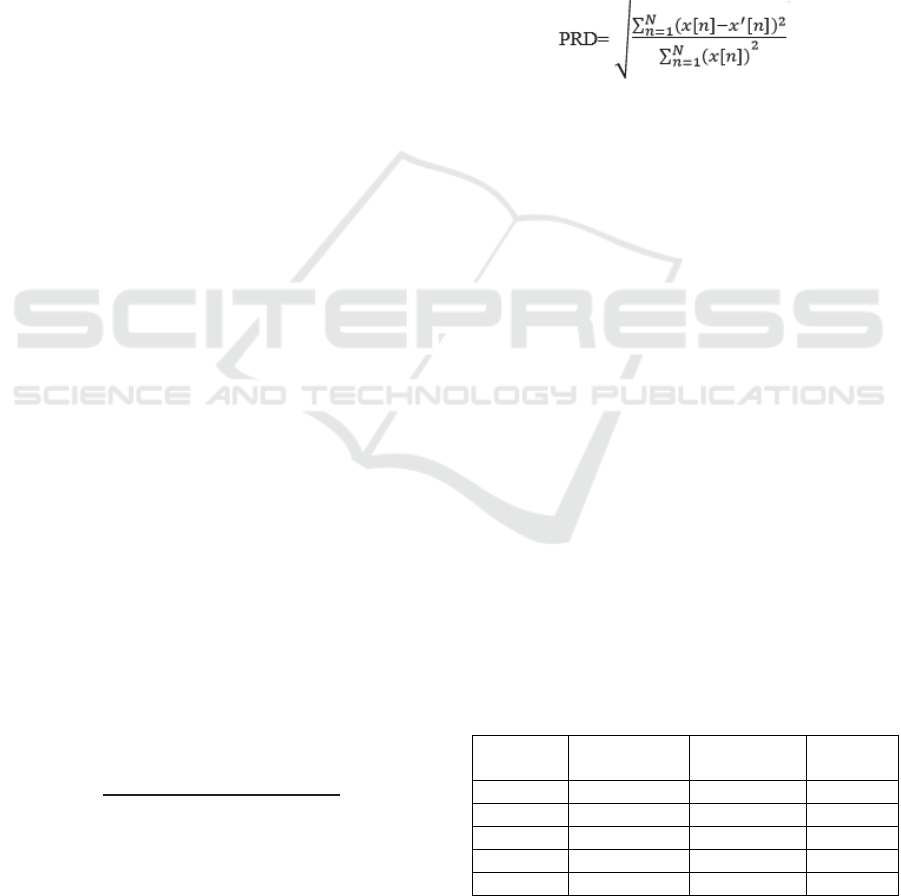
The Performance measures used are Compression
Ratio (CR) and Percentage Root Mean Square
Distortion (PRD). CR is defined as the ratio of the
size of original data to that of the compressed data.
CR=LO/LC (2)
where LO and LC denotes the EEG signal size in
bytes before compression and after compression,
respectively.
PRD is the standard measure to
determine distortion between two signals
(3)
Here x[n] represents the original EEG signal; x’[n]
represents the compressed signal and N represents the
numbers of samples.
4.4 Test Cases Regarding Compression
and Data Reduction
The co-operation of classification with compressions
opens door for different possible ways of
compressing the EEG as per Neurologists
requirement. The results discussed in this section
have been computed on seizure files only. The
compression metrics used are CR and PRD values.
Some of the cases are discussed as follows:
4.4.1 Raw EEG Compression
In this case we are applying our proposed scheme
mentioned in Figure 2 and reporting the results
obtained. Level 8 DWT coefficients are calculated
prior to thresholding. Following tables show the
average CR and average PRD obtained through
Huffman and Arithmetic coding applied on CHB-
MIT dataset, along with the average classification
accuracy for decompressed data thresholded at
different levels respectively.
Table 1: Huffman results.
Serial No
Threshold
Level
Average
CR
Average
PRD (%)
1 0 3.5864 5.5457
2 1 3.9593 7.2480
3 2 4.3395 8.8164
4 3 4.7095 10.2214
5 4 5.0553 11.4991
BIOSIGNALS 2020 - 13th International Conference on Bio-inspired Systems and Signal Processing
26
Table 2: Arithmetic results.
Serial No
Threshold
Level
Average
CR
Average
PRD (%)
1 0 3.7086 5.5460
2 1 4.1101 7.2484
3 2 4.5304 8.8164
4 3 4.9119 10.2214
5 4 5.2794 11.4991
Table 1 and 2, shows the compression ratio and
PRD for both the Huffman and Arithmetic encoding.
As expected Arithmetic coded results have higher
compression ratio than Huffman. Table 3 shows the
results of prior works on compressions along with
their used techniques on the same CHB-MIT
database. It can be noted that our results are
comparable to previous results, which indicates that
the compression is also not compromised. Fig. 3
presents the signal waveform of original EEG signal
and its reconstructed EEG. Both are also very close
visually. The EEG is of channel FP1 of file chb01_03
of CHBMIT database, with a signal representation of
original and 0 thresholded waveform for a time
interval of 0.0625 second.
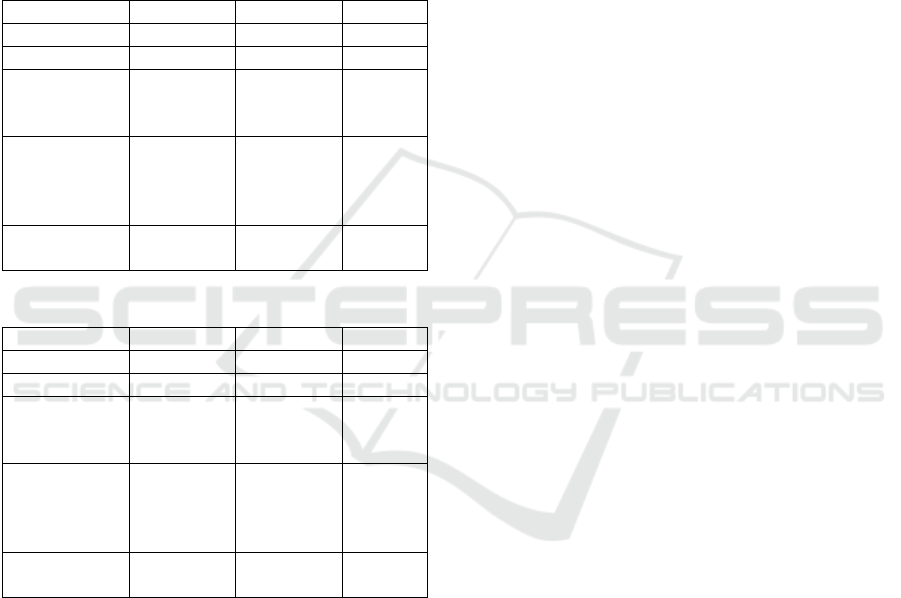
Table 3: Comparison results.
Ref Technique CR
PRD
(%)
[1] JPEG 2000 5 10
[2]
JPEG2000; arithmetic
code
5 7
[3]
Biorthogonal 4.4 DWT;
SPIHT
5 7
[4] SPIHT 6 7
[5]
Biorthogonal 4.4 DWT;
SPIHT
7 10
[6] CDF 9/7 DWT 8 10
Table 4: Similarity index.
No Threshold
Average
Similarity %
Max Similarity
%
1 0 99.54 99.94
2 1 99.50 99.92
3 2 99.46 99.91
4 3 99.41 99.88
5 4 99.19 99.85
4.4.2 Summarization and Compression
In this case we are summarizing the epileptic events
by discarding non epileptic epoch and compressing
only those epochs which are epileptic. This is helpful
in those cases where the neurologist only wants to see
the epileptic data and wants to discard the non-
epileptic data. In this case Data Reduction (DR) is
measured by (4) given as follows:
DR= 𝑁𝑢𝑚𝑏𝑒𝑟 𝑜𝑓 𝑜𝑟𝑖𝑔𝑖𝑛𝑎𝑙 𝑒𝑝𝑜𝑐ℎ𝑠 (4)
𝑁𝑢𝑚𝑏𝑒𝑟 𝑜𝑓 𝑟𝑒𝑚𝑎𝑖𝑛𝑖𝑛𝑔 𝑒𝑝𝑜𝑐ℎ𝑠
Table 5: Data reduction ratio.
Serial No DR
1 6.2
2 6.5
3 7.1
4 7.6
Data obtained after discarding non- epileptic
epochs can then be compressed, and the CR and PRD
values obtained are similar to values given in Table 1
and Table 2. Compression after selective data
reduction effectively reduces the overall file size as
compared to the raw EEG compression file.
Moreover, re-classification of decompressed data
generate singular classification labels which are
indicate all epileptic epochs, hence compression does
not affect signal quality.
Figure 3: Signal waveform of original and reconstructed
EEG of channel Fp1 of chb01_03.
4.4.3 Adaptive Compression of EEG on
Prepared Summary
In this case we compress different intervals of the
EEG signal selectively. Multiple options can be
considered. Here we will discuss one example for
conciseness. The INSS branch classifies the epochs
as epileptic or non-epileptic. The epileptic epochs are
compressed at a lowest threshold of 0 to maintain
highest quality while the non-epileptic epochs are
compressed at a threshold of 4 corresponding to
highest CR. The idea is keep quality adaptive to the
importance of the signal to suit the requirement of the
neurologists. Following tables show the results for
0 0.1 0.2 0.3 0.4 0.5 0.6 0.7
0
10
20
30
Raw EEG
Tim e (s)
0 0.1 0.2 0.3 0.4 0.5 0.6 0.7
Voltag e (uV )
0
10
20
30
Decompressed EEG
Exploring the Merit of Collaboration in Classification and Compression of Epilepsy EEG Signal
27
Huffman and Arithmetic coding as applied across all
seizure files of CHBMIT database. While the overall
average compression ratio is on the higher side when
compared to Table 2 and Table 3 results, the epileptic
epochs are still maintained at an acceptable PRD
which minimizes any adverse effect on the
neurologists’ decision. Training the classifier such
that no positive case of epileptic event is missed is
recommendable because false positives can be
eliminated by the Neurologists himself and storing it
at good quality does not incur much cost.
Table 6: Huffman results for adaptive compression.
Mean Max Min
CR 5.042 5.842 3.953
PRD (%) 10.72 19.92 6.256
PRD epileptic
epochs only
(%)
5.6054 7.8447 3.4437
PRD
non-epileptic
epochs only
(%)
11.3604 19.2689 6.7594
Classification
Accuracy (%)
90.295 90.566 87.130
Table 7: Arithmetic results for adaptive compression.
Mean Max Min
CR 5.208 6.123 4.072
PRD (%) 10.77 19.93 6.256
PRD epileptic
epochs only
(%)
5.6319 7.8447 3.4437
PRD
non-epileptic
epochs only
(%)
11.3323 19.2689 94.697
Classification
Accuracy (%)
90.346 94.697 86.928
Here it can be seen that that classification results
obtained for the reconstructed signals, reported in
Table 6 and 7 are similar to that of raw EEG
classification. This clearly indicates, that while
adaptive thresholding and compression does not
deteriorate signal quality to a significant extent and
retains useful information, it is more efficient as
compared to simple compression. This is evident
from the statistics presented in Table 6 and 7,
showing an increase in CR and decrease in the value
of PRD in comparison to results in Table 1 and 2.
5 CONCLUSION
This paper explores the synergy between
classification and compression of epileptic EEG data.
It successfully eliminates the need of taking DWT
twice on the same data as would be required for
separate compression and classification task. The
INSS incorporated in our framework performed dual
task. Firstly, it helped in intelligent compression of
data by providing classification labels for epileptic
and non-epileptic data. We used Arithmetic and
Huffman for encoding purpose. It was found that by
using the labels for classification from INSS we can
improve our compression results. For example, when
we used the labels for epochs and compressed the
epileptic epochs at low and non-epileptic epochs at
high threshold, we observed an increase in CR along
with a decrease in PRD, which is desired. The
improvement in PRD indicates that reconstructed
signal after compression, still retained useful
information. This reinforces that we can efficiently
use the classification result to reduce and compress
the data. Secondly, it provides us with classified data
that allows selective data storage, as deemed
significant by the user. Moreover, classification
performed on decompressed signals yield nearly
same results as of the classification of raw EEG
signals. This implies that artifacts produced in the
signal due to compression do not affect signal quality.
The novel unification scheme employed; in which
classification and compression of EEG data
simultaneously takes place, results in decrease in
computational complexity and increase in efficacy of
the system. Comparing the results obtained using the
two distinct encoding schemes, it is observed that
Arithmetic coding outperforms Huffman.
REFERENCES
G. Higgins, S. Faul, R. P. McEvoy, B. McGinley, M.
Glavin, W. P. Marnane, et al., "EEG compression using
JPEG2000: How much loss is too much?," in
Engineering in Medicine and Biology Society (EMBC),
2010 Annual International Conference of the IEEE,
2010, pp. 614-617.
G. Higgins, B. McGinley, E. Jones, and M. Glavin,
"Efficient EEG compression using JPEG2000 with
coefficient thresholding," in Signals and Systems
Conference (ISSC 2010), IET Irish, 2010, pp. 59-64.
H. Daou and F. Labeau, "Pre-Processing of multi-channel
EEG for improved compression performance using
SPIHT," in Engineering in Medicine and Biology
Society (EMBC), 2012 Annual International
Conference of the IEEE, 2012, pp. 2232-2235.
BIOSIGNALS 2020 - 13th International Conference on Bio-inspired Systems and Signal Processing
28

G. H. Higgins, B. McGinley, E. Jones, and M. Glavin, "An
evaluation of the effects of wavelet coefficient
quantisation in transform based EEG compression,"
Computers in Biology and Medicine, vol. 43, p. 661, Jul
2013.
D. Hoda and F. Labeau, "Dynamic dictionary for combined
EEG compression and seizure detection," IEEE Journal
of Biomedical and Health Informatics, vol. 18, pp. 247-
256, 2014.
G. Higgins, B. McGinley, M. Glavin, and E. Jones, "Low
power compression of EEG signals using JPEG2000,"
in PervasiveHealth'10, 2010, pp. 1-4.
Malik Anas Ahmad, Yasar Ayaz, Mohsin Jamil, Syed Omer
Gillani, Muhammad Babar Rasheed, Muhammad
Imran, Nadeem Ahmed Khan, Waqas Majeed
and Nadeem Javaid, “Comparative Analysis of
Classifiers for Developing an Adaptive Computer-
Assisted EEG Analysis System for Diagnosing
Epilepsy”, BioMed Research International, Volume
2015 (2015), Article ID 638036, 14 pages, Jan 2015.
A. Subasi and M. I. Gursoy, "EEG signal classification
using PCA, ICA, LDA and support vector machines,"
Expert Systems with Applications, vol. 37, no. 12, p.
86598666, December 2010.
Z. A. Khan, S. b. Mansoor, M. A. Ahmad and M. M. Malik,
"Input devices for virtual surgical simulations: A
comparative study," in Proceedings of the 16th
International Multi Topic Conference (INMIC),
Lahore, 2013.
A. Neligan and L. Sander, The incidence and prevalence of
epilepsy, January 2001
Goldberger AL, Amaral LAN, Glass L, Hausdorff JM,
Ivanov PCh, Mark RG, Mietus JE, Moody GB, Peng C-
K, Stanley HE. PhysioBank, PhysioToolkit, and
PhysioNet: Components of a New Research Resource
for Complex Physiologic Signals. Circulation
101(23):e215-e220 [Circulation Electronic
Pages; http://circ.ahajournals.org/cgi/content/full/101/
23/e215
Mahmood A, Zainab R, Ahmad RA, Saeed M, Kamboh
AM. “Classification of multi-class motor imagery EEG
using four band common spatial pattern”, in
Engineering in Medicine and Biology Society (EMBC),
39th Annual International Conference of the IEEE,
2017, pp. 1034- 1037.
Casson AJ, Villegas ER, “ Toward Online Data Reduction
for Portable Electroencephalography Systems in
Epilepsy” in IEEE Transactions on Biomedical
Engineering vol. 56. no. 12, December 2009.
Chiang J, Ward R, “ Data Reduction for Wireless Seizure
Detection Systems” in 6th Annual International IEEE
EMBS Conferece on Nueral Engineering, San Deigo,
California, 6-8 November, 2013.
Exploring the Merit of Collaboration in Classification and Compression of Epilepsy EEG Signal
29
