
What Reviews in Local Online Labour Markets Reveal
about the Performance of Multi-service Providers
Joschka Kersting and Michaela Geierhos
Semantic Information Processing Group, Paderborn University, Warburger Str. 100, Paderborn, Germany
Keywords:
Customer Reviews, Sentiment Analysis, Online Labour Markets.
Abstract:
This paper deals with online customer reviews of local multi-service providers. While many studies investigate
product reviews and online labour markets with service providers delivering intangible products “over the
wire”, we focus on websites where providers offer multiple distinct services that can be booked, paid and
reviewed online but are performed locally offline. This type of service providers has so far been neglected
in the literature. This paper analyses reviews and applies sentiment analysis. It aims to gain new insights
into local multi-service providers’ performance. There is a broad literature range presented with regard to the
topics addressed. The results show, among other things, that providers with good ratings continue to perform
well over time. We find that many positive reviews seem to encourage sales. On average, quantitative star
ratings and qualitative ratings in the form of review texts match. Further results are also achieved in this study.
1 INTRODUCTION
This paper deals with the analysis of online cus-
tomer reviews. Namely, the subject of interest are re-
views from the English-speaking, American version
of Amazon in the category of Home & Business Ser-
vices
1
(AHS). Here, customers can buy and rate ser-
vices that are fulfilled by service providers. Examples
are “TV Wall Mounting”, “Desk Assembly”, “House
Cleaning” and outdoor services such as “Tree Trim-
ming” (Amazon, 2017).
User-generated, for anyone accessible reviews in-
herit an important role in e-commerce (Kokkodis and
Ipeirotis, 2016). They are part of online feedback
mechanisms (Dellarocas, 2003) that can be described
as word-of-mouth networks. These refer to the in-
formative communication between consumers about
opinions and experiences with goods or services and
their providers (Hu et al., 2006; Esch, 2017).
Providers without reviews are less likely booked
than those with many positive reviews (Lin et al.,
2016). Furthermore, studies show that positive re-
views, especially positive average ratings (Anderson
and Magruder, 2012; Luca, 2016; Chevalier and May-
zlin, 2006) and a high number of reviews are posi-
tively associated with sales (Duan et al., 2008). Other
1
The category Home & Business Services can be found
at https://www.amazon.com/Amazon-Home-Services/b?
ie=UTF8&node=10192820011/.
research partly supports or challenges these findings
or takes another point of view when it comes to
customer reviews and sales (Chevalier and Mayzlin,
2006; Hu et al., 2006; Godes and Mayzlin, 2004).
Generally, scholars show that customer reviews on av-
erage are either very positive or negative (Hu et al.,
2006), while being generally important to purchase
decisions (Park et al., 2007).
Apart from the named uniform products and ser-
vices, there are so-called “online labour markets”
(OLM(s)), where providers offer tailor-made solu-
tions to their customers. Such solutions include the
production of designs, software and so forth (Lin
et al., 2016; Kokkodis and Ipeirotis, 2016). OLMs
deliver experience goods. For consumers, it is not
possible to foresee work quality and satisfaction, be-
cause reviews cover past transactions only (Kokkodis
and Ipeirotis, 2016). The sold goods are tailor-made
for the customers while being produced after closing
a contract, not prior to that (Lin et al., 2016). Most
providers in OLMs use multi-tasking even though this
is in general said to be harmful to success in business
(Goes et al., 2018).
While scholars investigated OLMs such as Up-
work (Horton and Golden, 2015; Kokkodis and
Ipeirotis, 2016; Lin et al., 2016; Agrawal et al.,
2015; Lehdonvirta et al., 2014; Berinsky et al., 2012),
OLMs with multi-service categories such as AHS are
yet not researched. The difference is that the first
Kersting, J. and Geierhos, M.
What Reviews in Local Online Labour Markets Reveal about the Performance of Multi-service Providers.
DOI: 10.5220/0008787702630272
In Proceedings of the 9th International Conference on Pattern Recognition Applications and Methods (ICPRAM 2020), pages 263-272
ISBN: 978-989-758-397-1; ISSN: 2184-4313
Copyright
c
2022 by SCITEPRESS – Science and Technology Publications, Lda. All rights reserved
263

mainly deliver intangible products that often are used
as input for business processes and include a bidding
process (Lin et al., 2016) while the second offers man-
ual services, often done at a person’s house or apart-
ment (Amazon, 2017) without bidding. Here, the
appropriate term is multi-service categories, as there
are categories where many different services belong.
For example, “TV wall mounting” means that hun-
dreds of different TVs may be installed in utterly dif-
ferent apartments according to the customer’s needs
(more dimensions are possible like different room/
wall types, attachments). Users review providers ac-
cording to their corresponding services. The reviews
cannot be found at a specific article such as a smart-
phone but at providers with their different possible
services. Apart from the general inspection of such
cases, there are further open questions.
It is unclear which services a particular provider
executes while one can assume providers perform dif-
ferently well in varying areas. It’s critical for con-
sumers to know in which areas a provider excels.
Apart from difficulties, there are numerous questions
to be answered. Firstly, as reviews correspond to past
transactions only, do providers with positive reviews
in a certain time span continue to perform well and
receive positive reviews in the next time span? To
answer this question, I compare the best rated cate-
gories of providers with the other categories over time
[Q1]. Secondly, do many reviews and many positive
reviews enhance a provider’s sales? Here, to develop
an answer, it is investigated how the average rating
of the most rated category per provider compares to
the average rating of the other categories per provider
over time spans [Q2]. Thirdly, do positive and nega-
tive About Me texts
2
promote or hinder the compari-
son of the best rated categories? Here, average quan-
titative ratings of providers with positive and nega-
tive About Me texts are confronted [Q3]. Fourthly,
do quantitative and qualitative ratings match together?
That is, do quantitatively well rated providers re-
ceive reviews with on average good sentiments [Q4]?
Fifthly, exists an association of the number of offered
services by a provider with customer satisfaction and
therefore reviews? As an example, it can be seen that
a provider with just one service may satisfy his cus-
tomers more on average than a provider with ten dif-
ferent services. Thus, this paper investigates how the
average star ratings of providers with few rated cate-
gories compare to those with many [Q5].
The structure of this paper is as follows: The
second Section deals with related literature. The
third Section presents technical details and informa-
2
A text on AHS where a provider describes himself, his
company and offered services.
tion about the method. Section number four analyses
the data and Section five concludes.
2 SYSTEMATIC LITERATURE
OVERVIEW
2.1 Dimensions Used in the Literature
In the following, a systematic overview of the related
literature will be given. Here, research gaps will be
identified. For systematization, we aimed at finding
dimensions that are covered by previous studies. The
following table will present studies and dimensions
accordingly.
Time spans represent the first dimension, i.e.
whether scholars have separated their data according
to different periods and surveyed changes. The sec-
ond dimension, category specific, refers to the ques-
tion whether researchers investigated (and compared)
categories (of products, services) within their data.
Average rating asks whether one or more average rat-
ings were calculated.
The fourth dimension asks for sentiment analysis
scores. The next dimension asks for a comparison of
qualitative contents, i.e. text, and quantitative el-
ements, i.e. grades. This can be performed by cal-
culating quantitative scores from texts and bringing
them together with the quantitative scores. Dimen-
sion number six, the number of services, refers to
the question whether the studies take into considera-
tion that one provider may offer several things such
as different services at once. Quality is a dimension
that assures whether the paper deals with quality as a
subject or whether the main subject is related to qual-
ity in terms of customer reviews. The last dimension
asks whether prices were an object of consideration.
2.2 Presentation of Related Studies
The first presented paper (Kokkodis and Ipeirotis,
2016) investigates category specific reputation in an
OLM (Upwork) with intangible products. The paper
focusses on the design of reputation systems rather
than on the gathered data and observations based on
them. It neither considers a sentiment analysis, nor
a comparison of qualitative and quantitative elements
of reviews. The study touches some of the dimen-
sions from Table 1, which this paper uses, but there
are great differences in the realisation and questions
answered. At any rate, this study is the only one that
takes the number of offered services into considera-
tion.
ICPRAM 2020 - 9th International Conference on Pattern Recognition Applications and Methods
264

Table 1: Research Areas Touched by Selected Literature.
Time Category Average Sentiment Qual. & Quant. Number Quality Prices
Studies Spans Specific Rating Analysis Comparison Services
Kokkodis & Ipeirotis, 2016 x x x x x
Lin et al., 2016 x (x)
Horton & Golden, 2015 x x x (x) x (x)
Berinsky et al., 2012 x x x
Chevalier & Mayzlin, 2006 x x (x) (x) x
Ghose & Ipeirotis, 2006 x x x x x x
Hu & Liu. 2004 x
Our Study x x x x x x (x)
x = matches completely, (x) = matches partially, empty field = matches not
The second considered study (Lin et al., 2016)
deals with the effectiveness of reputation in OLMs. It
uses transaction data from a large OLM such as Up-
work (the used market place’s name is deliberately not
mentioned). As can be seen in Table 1, the study does
not consider several dimensions that are used in this
paper. The scholars do not use time spans in their
investigation, but average ratings. There is neither
a sentiment analysis, nor comparison of quantitative
and qualitative ratings, nor a usage of prices. The au-
thors see it as the theoretical core of their paper that
reputation is a measure for quality, therefore the di-
mension of quality is included (Lin et al., 2016).
Study number three (Horton and Golden, 2015)
deals with reputation inflation. That is, the study uses
transaction data from the OLM Upwork (and an affil-
iate) to investigate the phenomenon of increasing av-
erage ratings for providers. Here, the authors suggest
that negative feedback is more expensive than positive
feedback and that this cost can lead to a state where
only positive feedback is given.
When it comes to the dimensions from Table 1,
there are several points fully or partially matched. The
paper uses time spans for the observations. Besides
that, it considers different categories, as well as av-
erage ratings. The study constructs some kind of a
sentiment score based on the appearance of certain
terms in reviews. The approach does not consider
a weighting of terms, e.g. giving domain-specific
words a stronger impact than others (Horton and
Golden, 2015). However, the featured paper brings
together quantitative and qualitative ratings, i.e. sen-
timent scores. Here, they mainly use this feature to
connect public and private feedback rather than check
whether quantitative and qualitative scores on aver-
age fit together or fit to other information. To put
it short, even this dimension is used differently than
in the present paper. Neither the number of services
per provider nor the prices of services are used. As
in other studies, ratings are regarded as a measure of
quality here (Horton and Golden, 2015).
The authors of the fourth presented study (Berin-
sky et al., 2012) perform an evaluation of OLMs. The
study investigates the general applicability of OLMs
to research experiments. Therefore, it is an interest-
ing study for a basic understanding of OLMs. Again,
here a market is used that provides intangible prod-
ucts over large distances. The study tackles very few
dimensions used in this paper, but does entirely dif-
ferent work and answers entirely different questions.
Study number five (Chevalier and Mayzlin, 2006)
investigates effects of customer reviews on sales. The
data consist of review and sales data of books gath-
ered from Amazon and another major book seller
from the USA. Including the dimensions from Table
1, the featured study uses time spans in their data, but
no categories. The conducted experiments use aver-
age ratings, but not sentiment analysis. The study uses
the number of reviews per book as a variable. Nat-
urally, there was no number of services considered.
The scholars make not only different points, but also
have an entirely different subject of investigation.
The sixth study (Ghose and Ipeirotis, 2006) and
deals with the design of ranking systems, especially
the impact of subjectivity in reviews on sales and re-
views quality. The authors use product data and re-
view for conducting a study that does not tackle the
research questions proposed by this paper. The con-
sidered objects are different. This comes from the fact
that products such as audio players and DVD films
were used. Apart from that, the authors neither use
the polarity in the sentiment analysis, nor compare
the sentiment with the seller’s About Me texts, nor
compare the sentiment with the quantitative average
rating.
The seventh and last study that is being examined
was written by (Hu and Liu, 2004). Even though
the authors have a different focus, this study should
be considered here because it focusses on sentiment
analysis and reviews. To put it short, it can be said
that the sentiment analysis is the only dimension used
from Table 1. The authors perform a totally different
study which aims at using natural language process-
What Reviews in Local Online Labour Markets Reveal about the Performance of Multi-service Providers
265

ing and data mining techniques to face the high num-
ber of customer reviews. The authors of the study fo-
cussed on their mining and summary techniques and
not on other findings that could be made from re-
views.
2.3 Categorisation of this Study
As indicated in the last row of Table 1, the present pa-
per matches almost all categories except for one and
another one partially. That is, this study uses differ-
ent time spans for the data. This paper further pays
respect to the fact that there are different service cate-
gories offered and views them one at a time. Average
ratings for quantitative and qualitative elements of re-
views play an important role in the data set and anal-
ysis of this paper. A comparison of quantitative and
qualitative elements are important, too. Thus, a sen-
timent analysis is performed as well. The number of
services per provider, a dimension that is poorly cov-
ered in the related literature, is also taken into consid-
eration in this paper. Quality is not a directly observed
dimension here. As other authors have stated, good
reviews are an indicator of quality (Lin et al., 2016;
Horton and Golden, 2015).
However, all five of the research questions from
Section 1 are unique so far. Scholars have neither an-
swered, nor asked the same questions as this paper
does. Especially, none of the researchers has taken
into consideration a local OLM with multi-service
providers. This encourages a practical software im-
plementation in order to answer the research ques-
tions.
3 METHOD
For acquiring data, a sophisticated application that
collects unstructured data from the dynamic webpage
of AHS and saves them in a structured manner to
a database needed to be written. This is called a
crawler (Abhyankar et al., 2014). For further tasks
such as processing natural language, other libraries
were used. The acquired data were saved to four
database-tables: “categories”, “reviews”, “sellers
3
”
and “sell analysis.” The analysis table (sell analysis)
is filled in with per provider every category where he
has received reviews. Further information like the av-
erage sentiment score are added, too. Data fields are,
among other things, the IDs of sellers and articles.
Both serve to connect the tables with each other.
3
Even though the sellers on AHS are providers, Ama-
zon refers to them as sellers. Both words are used synony-
mously.
Having investigated existing solutions for senti-
ment analysis, several of such algorithms were imple-
mented in order to choose the most appropriate one.
We have further investigated a systematic overview of
such algorithms and consequently chose an adequate
one. Among others, a self-developed algorithm us-
ing SentiWordNet (Esuli and Sebastiani, 2007) was
tested. The self-developed method assigns polarity
values to each word. Then, an overall score for the
whole document is calculated (Esuli and Sebastiani,
2007). The sentiment scores lie between 0 and 1.0.
The higher value determines whether a review is pos-
itive or negative, i.e. a value of > 50%. Further, rules
are used such as adverbs that modify the following ad-
jectives (Singh et al., 2013). The self-developed algo-
rithm was chosen due to its adequate performance on
multi-service provider reviews. The other methods,
however, performed poor, e.g. by assigning a nega-
tive sentiment score to a review that clearly was very
positive both in language and quantitative star rating.
The line graphs in the analysis Section 4 are con-
stituted by taking the first-best, second-best etc. and
first-most rated, second-most rated categoriy per ev-
ery provider. Then, consequently, the quantitative star
ratings were averaged along all first-best, second-best
categories etc. Here, relative time intervals were used
in order to draw a course of lines over the time. The
same procedure was used for sentiment scores. Fur-
ther remarks on the method of graph creation can be
found along with answering Q1 in Section 4.2.
4 ANALYSIS
This Section provides the analyses of this paper. It
starts with a descriptive analysis and continues with
the research questions. However, the method is ex-
plained along with Q1.
4.1 Descriptive Statistics
Having collected the data, all in all, 348
4
categories
are eligible for the investigation. Of 559 qualified
categories at first
5
, 211 with no reviews were de-
ducted. Data collection took place between August
and September 2017.
The categories contain 32, 965 customer reviews
and 4, 631 sellers. The first review was posted in July
2014, the last collected in September 2017. The dis-
tribution of the reviews over the years is as follows:
4
All numbers in this Section were taken at the end of the
period considered in this paper.
5
Categories for which Amazon did not display all re-
views were excluded.
ICPRAM 2020 - 9th International Conference on Pattern Recognition Applications and Methods
266

In 2014, there were only 20 reviews, while 3, 931
reviews were posted in 2015, 11, 709 in 2016 and
17, 305 in 2017 (up to the end of September). That
is, AHS experienced a high user growth.
A category has on average 94.73 reviews and a
provider has 7.11 reviews on average. Providers sell
on average in 3.52 categories, while categories have
on average 13.31 providers having received reviews.
Categories have up to 1, 338 reviews. Providers serve
up to 78 categories.
When it comes to the star ratings on AHS, it can
be said that they are overwhelmingly positive, hav-
ing on average 4.76 stars. This is interesting as it is
consistent with a study finding that quantitative rat-
ings are on average positive (Chevalier and Mayzlin,
2006). In general, the distribution of star ratings is un-
equal. The absolute majority of reviews is rated with
five stars: 29, 305. Four stars were given to 1, 813 re-
views, three to 665, two to 411 and one star was given
to 771 reviews in total.
When taking into consideration the data from the
analysis table, there are findings to be made. The data
consist of the combinations of every provider and ev-
ery category he has received reviews in. That is, for
example, a provider with reviews in ten different cat-
egories would appear in ten data rows. Such com-
binations are from now on called provider-category
combinations.
There are 16, 306 provider-category combinations
in total. Further, there are 11, 307 combinations with
one review, 2, 718 with two reviews and 2, 551 with
three or more reviews. Thus, there are many providers
having served and received reviews in several cate-
gories only once. There are 2.02 reviews on average
per combination.
For research question five, it is interesting to know
how many providers serve in one, two etc. cate-
gories. While the average lies at 3.52 categories per
provider, taking all provider-category combinations
even with less than three reviews into consideration,
2, 262 providers have just one category, 814 have two
and 407 have three categories. The number drops fur-
ther, e.g. there are only 43 providers with ten cate-
gories. The number quickly becomes single-digit.
Regarding the time at which reviews were given,
between the first and last review of the provider-
category combinations are on average 242 days, i.e.
8 months
6
. While there is a combination which re-
ceived all three reviews on the same day, the maxi-
mal distance between the first and last review is 1, 019
days, i.e. 2 years and 10 months.
When it comes to the sentiment scores, there are
different interesting information to be found: On av-
6
To simplify the calculation, the months have 30 days.
erage, the About Me texts and reviews are ca. two
thirds positive. That is, About Me texts are about
69.6% positive and 30.4% negative. Similar values
can be found concerning the average sentiment scores
or reviews. They are 22.2% negative and 77.8% pos-
itive.
The next Sections answer the research questions.
4.2 Q1: Performance of the Best Rated
Categories over Time
This Section develops answers to Q1. For dealing
with the research questions of this paper, the acquired
and aggregated data were further processed. Then,
line diagrams were developed. The first research
question asks for a comparison of the best rated cat-
egories of providers with the other categories over
time. Thus, there is a comparison of the best with
the next three best categories per every provider.
The best and most rated categories of this Section
are those who overall, at the end of the period con-
sidered, have the best and most ratings overall (aver-
age/total number of all ratings regardless of the time
point).
The data of this paper, as Figure 1 demonstrates,
are separated into ten relative time intervals which
represent ten percent each (x-axis). Further, this paper
uses average star ratings (y-axis). That is, the diagram
provides an overview of the best rated categories in
the form of their average ratings over time.
Every review was assigned to a relative time point.
Thus, these show at which time the review was given
relative to the other reviews of a provider in the
corresponding category. An example is a provider
who received three reviews in the category “Row-
ing Machine Assembly” on the following dates: 10th
Febuary 2017, 21st Feburary 2017 and 30th February
2017. Here, one time interval (a tenth) is two days
long. The first date would mark the beginning of the
time (zero in the diagram), the second date is close to
the middle (60), while the third review marks the last
possible time point (100). As the second review falls
into the interval between two time points (50 and 60),
it is categorized as the latter, i.e. 60.
In the end, all best, second-best etc. categories’
ratings are averaged for every time point. This way of
building the diagram is used for all other figures in the
following Sections of this Section. Of course, it was
adapted according to the current necessities. When
there were two best rated categories with the same star
rating, one was randomly chosen, as a combination
of those delivered an unsatisfying picture. All above
remarks apply to the most rated categories, too.
What Reviews in Local Online Labour Markets Reveal about the Performance of Multi-service Providers
267
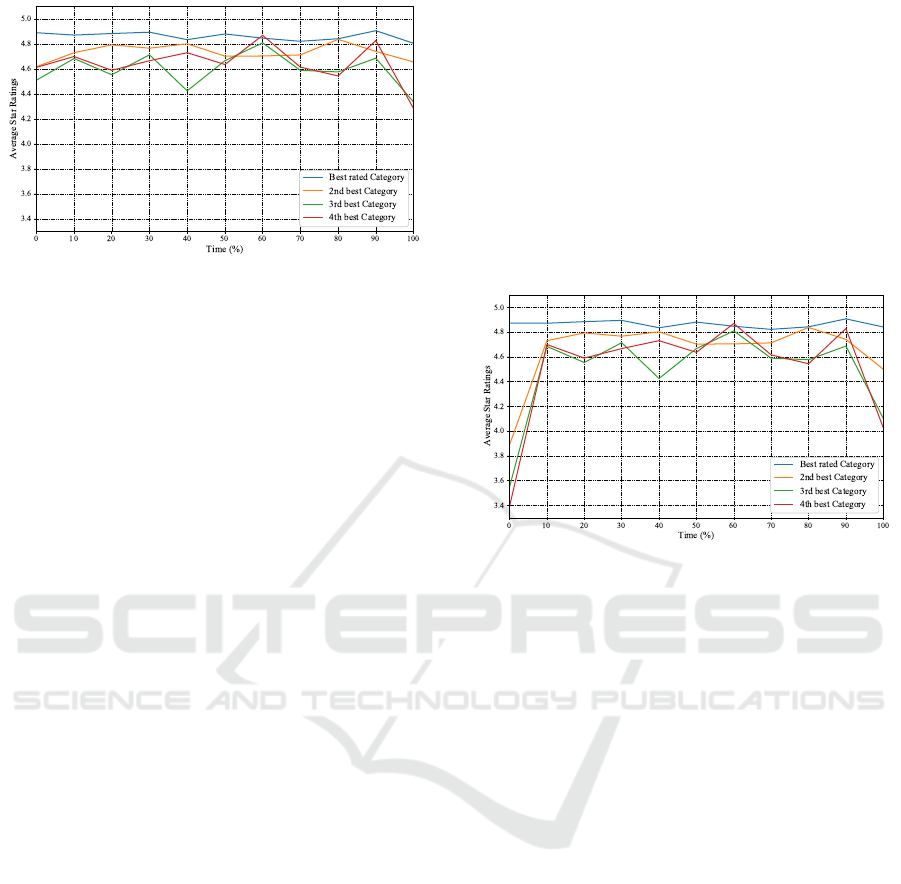
Figure 1: Average Star Ratings over Time for the Best Rated
Provider-Category Combinations with at Least Three Re-
views.
In the diagram in Figure 1, it can be seen that
the best rated categories (blue line) have a consid-
erably better start than the other categories. The
second-, third- and fourth-best rated categories, how-
ever, mostly improve their ratings in the following pe-
riods. The second-best rated categories in form of the
orange line reach star ratings close to the blue line and
stay there, even touching the blue line at point 80. At
the end, the second-best categories get poorer ratings
again.
The third- and fourth-best rated categories raise
and fall several times, especially at the end. For some
reason, the ratings of the third-best categories (green)
go from close to 4.5 stars at the beginning, to 4.8 stars
after the middle, to less than 4.4 stars at the end. The
fourth-best categories reach at some time points bet-
ter average ratings than the third-best. Of course, the
fourth-best rated categories consist of an average that
combines every provider’s fourth-best rated category.
Though, as indicated in Section 4.1, most providers
do not have that many categories (3.52 on average).
When there is a provider with four or more categories
where the third-best rated has a rating of 4.4 stars
and the fourth 4.2 stars while the next provider has
3.8 stars for his third-best rated category and there is
no fourth category at all, the average rating of all the
fourth-best rated categories is higher (4.2) than that of
the third (4.1).
To conclude, the best rated category of every
provider continues to perform well over time, while
being stable, but performs slightly poorer than at the
start. The distance between the best rated category
and the rest is in general rather decreased than in-
creased. These findings suggest that a provider has
one or two best categories where he performs steadily
well. While he here generally performs well, he has
more unsteady ratings in the next best rated categories
(third and fourth best). In general, the current Figure
1 shows that a provider seems to continue perform-
ing well over time spans in categories where he has
received positive reviews before. One possible expla-
nation for this is that a provider has several areas in
which he excels, not only one.
Figure 1 was plotted for provider-category com-
binations with at least three reviews. It was assumed
that these exclude such combinations that are less rep-
resentative due to them having received a rating just
once or twice. In order to provide a completer picture
and possibly suggest further findings, there is an addi-
tional diagram for all combinations, even those with
less than three reviews. It can be found in figure 2.
Figure 2: Average Star Ratings over Time for the Best Rated
Provider-Category Combinations.
Figure 2 shows comparable line courses to Figure 1.
A considerable contrast between the two Figures 1
and 2 is that the second-, third- and fourth-best cat-
egories, here as orange green and red lines, are more
volatile. The beginning shows that they start much
lower and increase their ratings to time point ten. In
fact, they start partly as low as 3.4 stars on average,
which is slightly over a neutral rating of circa 3.0
stars.
Figure 1 here answers Q1 equally as Figure 2
does, but further demonstrates that the number of
ratings per provider-category combination can reveal
important findings as well, because Figure 2 has got
4, 663 reviews in the best rated category at time point
zero, where 1 has over 500 reviews. The next research
question deals with the most rated instead of the best
rated categories.
4.3 Q2: Performance of the Most Rated
Categories over Time
Q2 asks for an investigation of the most rated cate-
gories and their ratings over time. This is performed
as it is not known whether many reviews and many
positive reviews improve a provider’s sales. Figure 3
provides an overview of the data for this question.
Interestingly, all four lines in Figure 3 are close to
each other. Furthermore, they seem to rotate around
ICPRAM 2020 - 9th International Conference on Pattern Recognition Applications and Methods
268
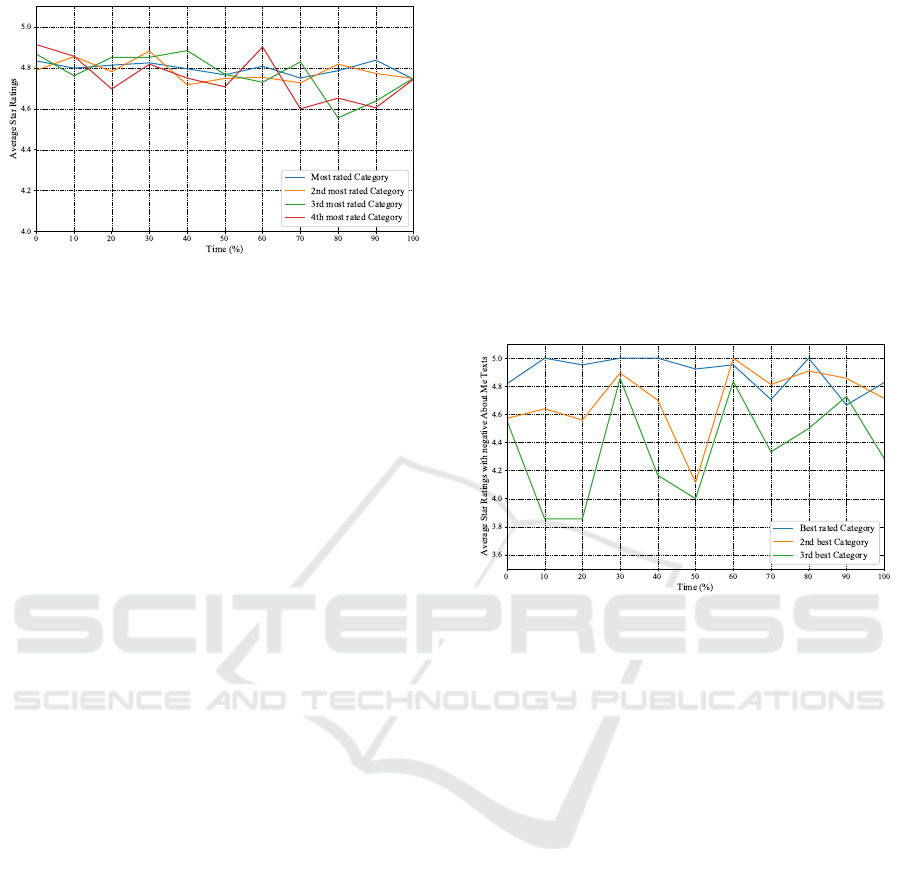
Figure 3: Average Star Ratings over Time for the Most
Rated Provider-Category Combinations with at Least Three
Reviews.
each other, as their average star ratings are volatile.
The first finding to be made is that the most rated cat-
egories all have high average ratings.
This finding can especially be seen when compar-
ing the lines in Figure 3 to the two Figures 1 and 2
from the previous Section. Even though the previous
Section deals with the best rated categories, the most
rated ones achieve in part better star ratings or at least
comparable values.
That is, taking the data of this paper in consideration,
Figure 3 demonstrates that most reviews, especially
the most rated categories per provider, are strongly
positive. At any rate, the picture in Figure 3 does not
show a clear picture like other diagrams. The most
rated categories, here in blue, do not outperform the
others. Other categories such as the third-most rated
even outperforms the most rated for several time in-
tervals in a row, here between time points 20 and 40.
All in all, the most rated categories have volatile rat-
ings that may fluctuate around 0.3 stars maximum.
The fluctuations seem to be stronger after half of the
time, i.e. after time point 50. Overall, the average
star ratings seem to decrease slightly over all time
points. Generally, it can be stated that the most rated
categories perform well over time spans. A possible
explanation is that many reviews and many positive
reviews enhance providers sales. Even scholars sug-
gest that providers with many good reviews often can
make more follow-up sales (Lin et al., 2016).
4.4 Q3: The Association of Best Rated
Categories with About Me Texts
Q3 deals with the average star ratings of the best
rated categories over time from the previous Section
4.2 in combination with the sentiment scores of the
providers’ About Me texts. That is, this Section aims
at finding out how providers’ best rated categories
perform when viewing only those with positive or
negative sentiment scores of the providers’ About Me
texts.
Figure 4 shows the best rated categories over time
with at least three reviews and negative About Me
texts. Again, the best rated categories seem rather
stable compared to the others. At any rate, the val-
ues here are much more volatile.
In this Section, the fourth-best rated categories
were excluded due to too few values. The most rated
categories showed comparable values to the best rated
regarding the current topic and thus were excluded. If
the sentiment Score of the About Me text is 0.5 posi-
tive or higher, it will be categorised as a positive text,
otherwise as negative.
Figure 4: Average Star Ratings over Time for the Best Rated
Provider-Category Combinations with at Least Three Re-
views and Negative About Me Texts.
The values vary from about 3.8 stars on average to
5.0 stars. The best rated categories show with their
blue line many high rated reviews reaching as high as
5.0 stars on average. The data set of the best rated
categories was split into those with negative About
Me texts and with positive texts, which can be found
in Figure 5. Interestingly, the values here are still
volatile, but not as much as in Figure 4. This fig-
ure does not differ too much in its appearance from
Figure 1 in Section 4.2. Figure 5 has e.g. over 400
values at time point zero, while Figure 4 has slightly
over 100.
When it comes to the best rated categories and
the About Me texts’ sentiment scores, the following
general observation can be drawn: Those provider-
category combinations whose provider has an About
Me text with a negative sentiment have highly volatile
average ratings. This high volatility partially comes
from a low number of reviews. Even though all rat-
ings are positive, some of them are comparatively low
positive even reaching close to the neutral area of
about 3.8 stars on average.
What Reviews in Local Online Labour Markets Reveal about the Performance of Multi-service Providers
269
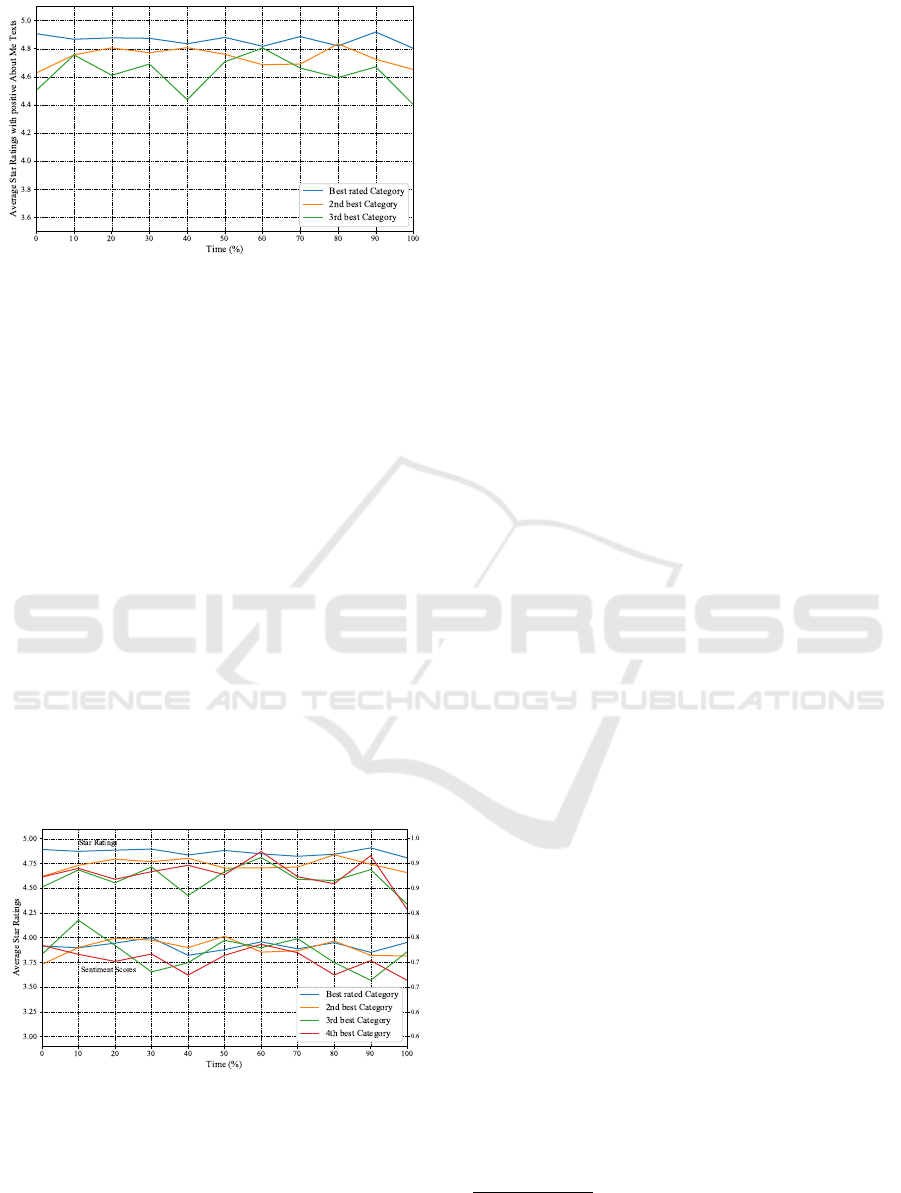
Figure 5: Average Star Ratings over Time for the Best Rated
Provider-Category Combinations with at Least Three Re-
views and Positive About Me Texts.
4.5 Q4: Quantitative Average Ratings
and Average Sentiment Scores in
Comparison
Q4 deals with a comparison of quantitative and qual-
itative ratings. In the introduction in Section 1, it
was questioned whether average star ratings match
the sentiment of the corresponding textual reviews. A
possible scenario is a review that has five stars but
where the reviews only addresses weaknesses of the
provider’s performance in the text. However, this Sec-
tion will answer the question of whether quantitative
and qualitative ratings match.
Figure 6 presents a diagram with two y-axis.
While the left y-axis presents the average star ratings
of the best rated categories, the right y-axis presents
the average sentiment score of the corresponding re-
views. Only the positive sentiment scores are shown.
Figure 6: Average Star Ratings and Positive Sentiment
Scores over Time for the Best Rated Provider-Category
Combinations with at Least Three Reviews.
The lines in the upper part are known from Figure
1 (Q1). Underneath, there are the corresponding sen-
timent scores for which the y-axis is on the right with
its measurement units.
It is the aim of this Section to generally clear
whether well rated categories have review texts with
positive sentiments. However, in general, one can see
in Figure 6 that all well rated categories have compar-
atively good sentiment scores. With sentiment scores
way over 70% and as high as 80%
7
, the best rated
categories have very positively written review texts.
When taking a closer look at the lines’ courses in
Figure 6, it is visible that the courses in the lower part
are not the exact same but close to those in the up-
per part. For example, the blue lines are quite stable
and do not show volatile values, though the lower blue
line is fluctuating more than the upper one. At any
rate, the sentiment lines are comparably high like the
star lines in the upper half and therefore, Q4 can be
answered positively. That is, quantitatively well rated
providers receive reviews with good sentiments on av-
erage. This can possibly be explained by the idea that
customers who rate very positively also write good
comments just supporting the star rating.
4.6 Q5: Indications of the Number of
Offered Services per Provider
This Section answers Q5. It is not known whether
a provider’s number of offered services is associated
with customer satisfaction and therefore reviews. It
would be an interesting finding whether providers
with few categories (specialization), for example,
have very good ratings while those with several cat-
egories have less good ratings. However, to answer
this research question, it is further worth taking a look
at indications of the number of reviews per provider-
category combination.
Figure 7 shows the average star ratings (y-axis)
of providers who offer services in one, two etc. cate-
gories (x-axis) and who have received at least three re-
views there. The axis labels in this figure show gaps,
as there were e.g no providers having 26 − 38 cate-
gories, but one with 39 categories. Providers have on
average 3.52 categories only.
As can be seen in Figure 7, the average star ratings
of providers with different numbers of categories are
volatile. No clear trend is discernible. At any rate,
they are generally as high as 4.8 stars, a highly pos-
itive value. It is not observable that a provider with
less categories has better ratings. This can possibly
be explained by the fact that there seems to be no as-
sociation between the number of offered services and
customer satisfaction.
7
However, such values are very high as many positive
words have, according to SentiWordNet, even a certain neg-
ative score percentage.
ICPRAM 2020 - 9th International Conference on Pattern Recognition Applications and Methods
270
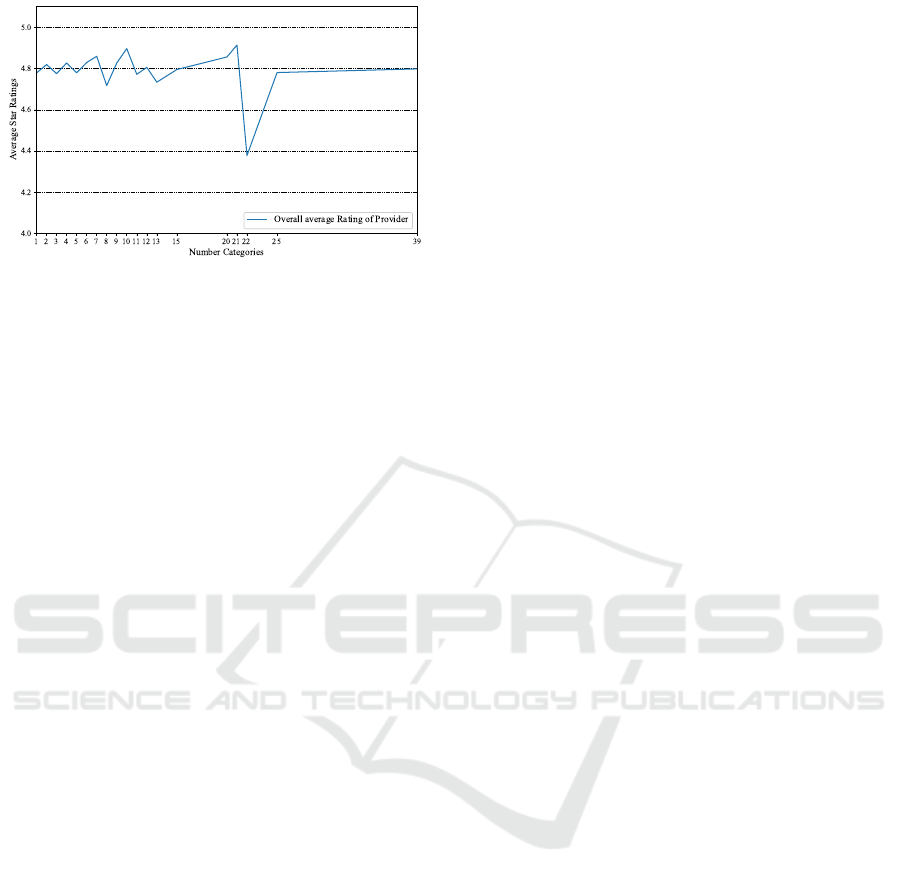
Figure 7: Average Star Ratings and Number of Categories
per Provider with at Least Three Reviews.
5 CONCLUSION
This Section draws a conclusion about the present pa-
per.
All aims of this paper have been reached as the
five research questions were answered. Additionally,
in order to ensure adequate results, different means of
looking at the data like excluding categories with less
than three reviews have been used. Further, several
other ideas have been tested before deciding how and
which data to use in this paper.
Amazon did not display all reviews of several cat-
egories with many ratings. Therefore, some cate-
gories were excluded from the investigation, which I
regard as a limitation. Furthermore, the total number
of reviews available on AHS, a few ten thousands of
reviews, is generally quite low so far. After all, the
presented foundations and related literature are satis-
fying in their scope and findings. As research so far
has neglected local multi-service providers, this pa-
per closes an important research gap whose findings
can help develop a completer picture in areas such
as customer review research, OLMs and online ser-
vice providers. It is a surprising finding that even
non-local service providers with multiple service cat-
egories have been studied little so far. It is further no-
ticeable that local multi-service providers with good
ratings perform, though the nature of their services
is intangible and hardly comparable, almost equally
well over time [Q1] (even though their ratings drop
slightly). This can be caused by the fact that Amazon
selects sellers eligible for selling on AHS and they
may exclude poorly performers after some time.
Apart from the best rated categories, the most
rated perform almost equally well over time [Q2].
A possible explanation is that many reviews and
many positive reviews stimulate sales. Another is
that many positive reviews encourage customers to
float with the crowd and give rather positive reviews.
When taking a look at the introduction, this behaviour
seems likely (reviews are either very positive or neg-
ative). However, providers with a negative sentiment
in their About Me texts are not only scarcer but have
highly volatile ratings compared to those with nega-
tive About Me texts [Q4]. Possibly, those provider
who control their self-description and are engaged
to provide a positive image are not only careful and
quality-conscious with their self-description, but also
with their work in general. Further, the qualitative
and quantitative ratings match [Q4] and thus, the re-
view texts match the star ratings. Interestingly, though
multi-tasking is harmful as stated in the introduction,
a higher number of offered services does not come
with a poorer provider performance [Q5]. That is in-
teresting as one might expect better ratings due to spe-
cialization in few categories.
What is more, is a self-developed sentiment analy-
sis method was chosen as it performs well on reviews
for multi-service providers. However, when dealing
with a comparison of sentiment scores and quantita-
tive star ratings, it arises a new question of an ade-
quate matching between both scales.
In general, the data, analyses and findings pre-
sented here not only are satisfying but can also be fur-
ther used for future research. Platform operators can
benefit from the findings in this paper. They can gain
an insight in how their platform compares to AHS and
local multi-service providers. For research, another
small part for the big picture is added.
ACKNOWLEDGEMENTS
This work was partially supported by the German
Research Foundation (DFG) within the Collaborative
Research Centre On-The-Fly Computing (SFB 901).
REFERENCES
Abhyankar, S., Demner-Fushman, D., Callaghan, F. M., and
McDonald, C. J. (2014). Combining structured and
unstructured data to identify a cohort of icu patients
who received dialysis. 21(5):801–807.
Agrawal, A., Horton, J., Lacetera, N., and Lyons, E. (2015).
Digitization and the contract labor market: A re-
search agenda. In Goldfarb, A., Greenstein, S. M.,
and Tucker, C. E., editors, Economic Analysis of the
Digital Economy, pages 219–250. The University of
Chicago Press, 1 edition.
Amazon (2017). Amazon.com: Home & business services.
https://www.amazon.com/Amazon-Home-Services/
b?ie=UTF8&node=10192820011. Accessed 2017-
10-03.
What Reviews in Local Online Labour Markets Reveal about the Performance of Multi-service Providers
271

Anderson, M. and Magruder, J. (2012). Learning from the
crowd: Regression discontinuity estimates of the ef-
fects of an online review database. 122(563):957–989.
Berinsky, A. J., Huber, G. A., and Lenz, G. S. (2012). Eval-
uating online labor markets for experimental research:
Amazon. com’s mechanical turk. 20(3):351–368.
Chevalier, J. A. and Mayzlin, D. (2006). The effect of word
of mouth on sales: Online book reviews. 43(3):345–
354.
Dellarocas, C. (2003). The digitization of word of mouth:
Promise and challenges of online feedback mecha-
nisms. 49(10):1407–1424.
Duan, W., Gu, B., and Whinston, A. B. (2008). Do online
reviews matter? – an empirical investigation of panel
data. 45(4):1007–1016.
Esch, F.-R. (2017). Gabler wirtschaftslexikon, stich-
wort: Word-of-mouth. http://wirtschaftslexikon.
gabler.de/Archiv/81078/word-of-mouth-v6.html. Ac-
cessed 2017-11-14.
Esuli, A. and Sebastiani, F. (2007). Sentiwordnet: A high-
coverage lexical resource for opinion mining. Techni-
cal report, Istituto di Scienza e Tecnologie dellInfor-
mazione Consiglio Nazionale delle Ricerche. Techni-
cal Report 2007-TR-02.
Ghose, A. and Ipeirotis, P. G. (2006). Designing ranking
systems for consumer reviews: The impact of review
subjectivity on product sales and review quality. In
Proceedings of the 16th WITS, pages 303–310. AIS.
Godes, D. and Mayzlin, D. (2004). Using online con-
versations to study word-of-mouth communication.
23(4):545–560.
Goes, P., Ilk, N., Lin, M., and Zhao, J. L. (2018). When
more is less: Field evidence on unintended conse-
quences of multitasking. 64(7):3033–3054.
Horton, J. and Golden, J. (2015). Reputation inflation: Ev-
idence from an online labor market. Technical report,
New York University. Working Paper.
Hu, M. and Liu, B. (2004). Mining and summariz-
ing customer reviews. In Proceedings of the 10th
ACM SIGKDD International Conference on Knowl-
edge Discovery and Data Mining, pages 168–177.
ACM.
Hu, N., Pavlou, P. A., and Zhang, J. (2006). Can online re-
views reveal a product’s true quality?: Empirical find-
ings and analytical modeling of online word-of-mouth
communication. In Proceedings of the 7th ACM
Conference on Electronic Commerce, pages 324–330,
New York, NY, USA. ACM, ACM.
Kokkodis, M. and Ipeirotis, P. G. (2016). Reputation trans-
ferability in online labor markets. 62(6):1687–1706.
Lehdonvirta, V., Barnard, H., Graham, M., and Hjorth, I.
(2014). Online labour markets-levelling the playing
field for international service markets? In Proceed-
ings of Crowdsourcing for Politics and Policy. ECPR.
Lin, M., Liu, Y., and Viswanathan, S. (2016). Effective-
ness of reputation in contracting for customized pro-
duction: Evidence from online labor markets. page
Articles in Advance.
Luca, M. (2016). Reviews, reputation, and revenue: The
case of yelp.com. Technical report, Harvard Business
School. Working Paper No. 12-016.
Park, D.-H., Lee, J., and Han, I. (2007). The effect of on-
line consumer reviews on consumer purchasing inten-
tion: The moderating role of involvement. 11(4):125–
148.
Singh, V., Piryani, R., Uddin, A., and Waila, P. (2013).
Sentiment analysis of movie reviews: A new feature-
based heuristic for aspect-level sentiment classifica-
tion. In Proceedings of the 2013 international Multi-
Conference on Automation, Computing, Communica-
tion, Control and Compressed Sensing, pages 712–
717. IEEE.
ICPRAM 2020 - 9th International Conference on Pattern Recognition Applications and Methods
272
