
Innovative Methods of Information Visualization in Transport Logistics
and Training Organization
Olena M. Mikhailutsa
1 a
, Tatiana O. Melikhova
1 b
, Andriy V. Pozhuyev
1 c
and
Hennadiy M. Kravtsov
2 d
1
Zaporizhzhia National University, 66 Zhukovskoho Str., Zaporizhzhiam 69600, Ukraine
2
Kherson State University, 27 Universytetska Str., Kherson, 73003, Ukraine
Keywords:
Visualization System, Interactive Teaching Method, Ant Colony Method.
Abstract:
The paper analyzes the benefits of using interactive teaching methods for students of technical and economic
specialties using visualization as an example. In the analysis of existing innovative educational methods, at-
tention is focused on the use of information technology in the formation of competencies of future specialists.
In the process of building a software product, a comparative analysis of platforms for developing graphic
applications as the main means of visualization on the Internet was carried out. To solve logistic problems
that are of practical importance for both economic and technical areas, a visualization of the ant colony op-
timization algorithm is implemented. It includes building a graph, simulating dynamic network visualization
the movement of a large number of ants, saving and loading the graph, providing the user with the ability
to remove visible layers. To test the effectiveness of this approach, a multistage experiment was conducted,
the results of which allowed us to draw a number of positive findings. In addition, the comparative survey
of students from the experimental and control groups made it possible to find out the students’ needs in the
process of dual learning, which provided an opportunity to increase students’ satisfaction with the quality of
teaching disciplines.
1 INTRODUCTION
Freight and road haulage by region is part of the trans-
port system of the Ukrainian economy, which every
year increases its turnover for the carriage of goods
and passengers, as well as overcoming a greater dis-
tance of transport. At this time, it is important for
enterprises not only to release products and provide
transportation services, but also to have their own
markets for products. Passengers also prefer to travel
by passenger vehicles, which allows them to quickly
resolve work issues, sign contracts without being tied
to purchased tickets for railway transport. This al-
lows you to quickly resolve business issues, since you
do not have to waste time waiting for the departure
time of the transport. Road transport provides mobil-
ity, which is very important for business. Carrying
out cargo transportation, it is necessary to fulfill the
a
https://orcid.org/0000-0003-2935-7997
b
https://orcid.org/0000-0002-9934-8722
c
https://orcid.org/0000-0002-4083-5139
d
https://orcid.org/0000-0003-3680-2286
conditions of the signed contracts, deliver products to
the warehouses of buyers, drive through the branches
of the enterprise with an inspection, personally visit
the counterparties-consumers of products. For the
purpose of marketing products, large enterprises have
sales or delivery departments, and small enterprises
or entrepreneurs turn to transport enterprises, since
they do not have their own fleet of all types of trans-
port. Recently, due to the rise in fuel prices, a topical
issue is the construction of an optimal route for the
delivery of goods. A very important aspect in deliv-
ery is its cost, which depends on building a logisti-
cally correct route. This allows you to significantly
reduce shipping costs for delivery. At the enterprise,
the logistician builds a route in such a way as to fill
the car with cargo as much as possible, consistently
distribute the cargo to delivery points depending on
the chosen direction of movement. The logistician
selects the brand of the car corresponding to the re-
quirements and volume of the cargo. The existing car
park at the enterprise should not be idle, therefore, if
there is a shortage of cars, it is necessary to contact
transport companies, and if the cars are underutilized,
360
Mikhailutsa, O., Melikhova, T., Pozhuyev, A. and Kravtsov, H.
Innovative Methods of Information Visualization in Transport Logistics and Training Organization.
DOI: 10.5220/0010931800003364
In Proceedings of the 1st Symposium on Advances in Educational Technology (AET 2020) - Volume 2, pages 360-371
ISBN: 978-989-758-558-6
Copyright
c
2022 by SCITEPRESS – Science and Technology Publications, Lda. All rights reserved

offer delivery services. Before delivering the goods, it
is economically feasible for an economist to calculate
the cost of delivery of the goods in order to correctly
form the price of the service for acceptance.
At enterprises there is a shortage of qualified per-
sonnel of the younger generation, therefore, an im-
portant issue in teaching students is to consider prac-
tical problems, work with computer programs that are
found at the enterprise. Now enterprises turn to the
university with practical cases to attract students and
interest the best of them for further work at the en-
terprise. For example, Metinvest holds a case cham-
pionship with students to get a new perspective on
their existing problems, as graduate students have
new knowledge and skills to work in modern pro-
grams.
At the current stage of development of higher ed-
ucation, approaches to accreditation of higher edu-
cation institutions in Ukraine have been harmonized
with those that are used in European practice. Train-
ing of Ukrainian National Accreditation experts of ed-
ucational programs is carried out by the British Coun-
cil Ukraine company. The “Regulation on the ac-
creditation of educational programs for the prepara-
tion of applicants for higher education”, which de-
fines the criteria for assessing the quality of each ed-
ucational program, was approved. According to the
criterion “Learning and teaching in the educational
program”, it is determined that the forms and meth-
ods of learning and teaching should contribute to the
achievement of the programmed outcomes stated in
the educational program. According to the “Stan-
dards and guidelines for quality assurance in the Eu-
ropean Higher Education Area (ESG)”, the quality
of higher education should be improved by develop-
ing the capacity of teachers at Ukrainian universities
to implement a student-centered approach in the pro-
jecting and implementation of educational programs.
Student-centered learning includes teaching methods
that shift the focus of education from the teacher to
the student, and among the principles of which are re-
search, discussions and project works.
According to available statistics from the Head-
hunter International Personnel Portal about staffing
with engineers, designers and technologists, there is
an acute shortage of qualified specialists at all stages
of the industrial product life cycle reproduction. This
situation is caused, on the one hand, by the fact that
the average age of highly qualified specialists is 40–
45 years and above, and on the other, by the gap that
has arisen between the requirements of employers for
staff competencies and educational standards. Thus,
the technological modernization of our country is not
feasible without the development and improvement of
engineering and economic education, which should
be based on the best traditions of the national scien-
tific school with the involvement of modern European
developments.
The ongoing changes in the economy and educa-
tion make new demands on the training of specialists
in the field of logistics, adjusting curricula and train-
ing courses. In logistics, there is a dynamic transi-
tion from a theoretical understanding of the content,
as the management of the transportation of goods and
people, to an emphasis on the information and tech-
nical aspects of practical work. Currently, the study
of special computer packages is being introduced into
the training program for both economists who plan to
work in logistics and programmers who need to be
able to complete the technical modules necessary for
managers to improve the efficiency of the enterprise.
Analyzing the above-mentioned, it can be claimed
that there is an urgent need to form creative think-
ing among students thus increasing their creative po-
tential. One of the ways to stimulate creativity and
self-development is to elaborate innovative methods
thereby increasing the motivation of students to mas-
ter subjects in both engineering and economic spe-
cialties, as well as improve the quality of higher ed-
ucation specialists in general. Personnel trained in
modern techniques will work in sales and logistics
departments at industrial and transport enterprises to
improve the efficiency of work and improve the trans-
port system of the Ukrainian economy as a whole.
2 LITERATURE REVIEW
The list of key tasks and a description of the global
problem considered in this paper are based on a re-
view and analysis of publications. Speaking of visu-
alization in general, its application for strategic plan-
ning by studying the use of interactive visual repre-
sentations in real time in business strategy process,
and the role of visualization in assessing and trans-
ferring risks are analyzed in Eppler and Aeschimann;
Eppler and Platts (Eppler and Aeschimann, 2009; Ep-
pler and Platts, 2009). Ivanova et al. (Ivanova et al.,
2020), Kiv et al. (Kiv et al., 2020), Mazorchuk et al.
(Mazorchuk et al., 2020), Osinska and Osinski (Os-
inska and Osinski, 2018), Soloviev et al. (Soloviev
et al., 2020), Vasylenko et al. (Vasylenko et al., 2019)
studied the use of information visualization in the so-
cial and human sciences, while covering a wide range
of topics, including analysis of social networks, com-
plex systems, as well as issues of visualization aes-
thetics.
The research experience gives a real opportunity
Innovative Methods of Information Visualization in Transport Logistics and Training Organization
361

to generalize and systematize ideas about teaching
methods and technologies. In (Fırat and Laramee,
2018) visualizations of pedagogical research work
are analyzed and classified, determining the direc-
tions of open research subjects in an interactive visual
representation for education, which demonstrate the
impact of visualization methods on advanced train-
ing. The demonstration of visualization possibilities
in computer science and mathematics (Klerkx et al.,
2014) emphasizes the effectiveness of its use to im-
prove various types of activities in the educational
process.
Emphasizing the fact that modern educational
space consists of two types of pedagogical pro-
cesses – innovative and traditional, Panina (Panina,
2014) identified the differences between traditional
and innovative schools at the level of educational
technology. Attention is paid to the description and
systematization of the most popular and frequently
used innovative educational methods of teaching in
higher education. According to (Kazhan et al., 2020;
Malchenko et al., 2020; Mukhametzhanova et al.,
2016; Okopna et al., 2020) the effective use of inter-
active teaching methods will allow the preparation of
qualified, competitive, educated and intellectually de-
veloped specialists. In the presented classification of
interactive methods, the case-study method is sepa-
rately highlighted; it allows students to take the initia-
tive in mastering theoretical positions and mastering
practical skills.
Focusing on the process of developing educational
visualization, Hauswirth (Hauswirth, 2012) promotes
the development of pedagogical methods and tools
that allow students to learn while creating visualiza-
tions on their own. It is well known that socioeco-
nomic changes and information development of the
entire world community require the use of informa-
tion technology in the formation of the competencies
of future specialists. By putting more emphasis on the
development of algorithmic thinking, the didactic po-
tential for the use of algorithms visualization systems
in the process of teaching programming was consid-
ered by Moglan (Moglan, 2019). The methods of us-
ing the created instrumental environment, that is the
algorithms of visualizer within the educational pro-
cess are proposed. However, it should be noted that
the implemented visualizers allow you to interactively
demonstrate the operation of the algorithms only for
processing static structures. The proposed approach
can’t be applied for the presentation of more complex
data structures. The created visualization system is a
catalog of implemented visualizations for a fixed al-
gorithm suite without the possibility of adding a new
algorithm to a catalog by a third party user.
Analyzing the techniques of visualization of al-
gorithms in order to create an electronic encyclope-
dia of graphs algorithms, Gordeev (Gordeev, 2018)
considered examples of systems for visualizing them.
The advantages of an event-oriented approach and a
data-oriented approach and their change are analyzed.
The given examples of existing visual techniques for
describing the graph algorithm behaviour are con-
sidered from the standpoint of having the ability to
specify parameter graphs by the user, the ability to
specify parameter algorithms, and the ability to adjust
the visual part of the image. A comparative descrip-
tion of existing software products for graph analysis
is presented in detail in (Kolomeychenko and Chep-
ovskiy, 2014). The authors presented a software pack-
age for the analysis and visualization of large graphs.
The cross-platform nature of the used implementation
tools and the ability of the developed software com-
plex to function in various operating systems allows it
to be used in the tasks of sociological and marketing
analysis.
The popularity of effective “swarm intelligence”
methods explains the constant appearance of a mod-
ification of the ant colony method to solve various
applied problems. Panteleyev and Alyoshina (Pan-
teleyev and Alyoshina, 2008) proposed an algorithm
for solving the shortest path search problem on an ori-
ented graph using the ant colony method. The corre-
sponding software is presented, the performance of
which is demonstrated by a specific example. How-
ever, the authors have not sufficiently studied the
question of the convergence of the method, in partic-
ular, the speed of its convergence.
The analysis of these works allows us to conclude
that for most visualization systems the introduction
of a new algorithm requires the development of the
whole visualization system from scratch. In light of
the fact that the use of automated systems in the trans-
port logistics branch is one of the ways to save re-
sources, even with a large number of ant algorithms
already implemented, it is necessary to further imple-
ment and improve these algorithms to find the best
results.
Many works are devoted to the transport logis-
tics issues (Pavlenko et al., 2020; Aulin et al., 2020).
Thus, Bowersox et al. (Bowersox et al., 2019) de-
scribes the role and content of logistics in modern
business, as well as examines in detail two fundamen-
tal tasks facing managers: developing an appropriate
logistics structure and overall management of logis-
tics activities. Stock and Lambert (Stock and Lam-
bert, 2001) focuses on the marketing orientation, and
subject matter is reviewed in terms of customer satis-
faction. Emphasizing the marketing aspects of logis-
AET 2020 - Symposium on Advances in Educational Technology
362

tics, the authors combine all functional business areas,
and also include logistics in supply chain manage-
ment. The compendium (Zijm et al., 2015) presents
the latest developments in logistics theory in various
fields, as well as case studies. It contains a collection
of theoretical topics, practical cases, case studies and
project reports. The emphasis is made on knowledge
transfer from research to business practices in logis-
tics.
The relevance of the work presented is attributable
to the fact that the proposed software product has mul-
tidisciplinary scientific and applied aspects: from its
research-oriented nature to practical implementation
both in the educational process and in the practical
activities of industrial and commercial enterprises.
3 MATERIALS AND METHODS
Nowadays higher education institutions are unique
in that economists are taught engineering specialties,
and future engineers can choose any economic dis-
cipline. Some students seek to obtain knowledge of
both economic and technical areas at the same time,
and while studying in two specialties in parallel, they
also use the right to choose their individual learn-
ing path. In an engineering institute of Zaporizhzhia
National University, teachers and students of differ-
ent technical and economic specialties work together
on the same scientific or educational issue, which al-
lows them to expand their horizons, exchange teach-
ing methods and introduce modern ways in teach-
ing their disciplines. This enriches the knowledge of
students of both specialties and improves the quality
of education, which subsequently provides them with
the opportunity to receive a prestigious profession.
The issue of teaching methods is essentially a
question of how to make close contact between the
student and the teacher. It is effective to use visualiza-
tion with various teaching methods as a means of tran-
sition from a passive perception of educational mate-
rial to an active and conscious acquiring of knowl-
edge. In this way, it is easier to comprehend the
essence of the technical problem under considera-
tion and the importance of the technical activity per-
formed, as well as to evaluate the optimality and rea-
sonability of the technical solution.
The daily use of algorithms allows humanity to
make life easier due to the speed and optimization
of tasks. In the 21st century, during the scientific
and technological revolution, the use of various al-
gorithms increases almost exponentially, optimizing
most production processes. In most cases, it is enough
to slightly modify the existing algorithm and apply it
in another area in order to significantly increase the
benefits of its application. If to highlight the visual-
ization of the ant algorithm (Dorigo, 1992), it would
like to emphasize its alternative way in explaining
the decision-making theory to engineering students;
it also allows economists involved in transport logis-
tics issues to better understand the material.
3.1 Survey of Visualization
Technologies
The global network is increasingly becoming the
main platform for data reproducing (visualization).
This applies in particular to interactive data visual-
ization, which allows users to manipulate their data
and graphics in real time. Although this move into
the Internet opens up many opportunities for global
visualization, it is also accompanied by its own set
of problems. For example, how to reproduce large
amounts of data in a web browser? To understand the
problems of visualization, several types of web ani-
mation development were analyzed. The most widely
used technologies in this direction are SVG, HTML,
Canvas and WebGL (Frain, 2020). The term SVG
means “Scalable Vector Graphics”. It is an XML-
based format for drawing vector images. SVG offers
certain benefits as a data visualization tool, in partic-
ular ease of comprehension, since it consists of stan-
dard primitives such as rectangles, circles and lines.
Due to the simplicity of its use and integration with
HTML standards, this format is the most common op-
tion for graphics on the Internet. However, despite
this, SVG has one major drawback – scaling the num-
ber of nodes.
The main advantage of Canvas technology is that
since it creates bitmaps, it does not have a trace of
memory that SVG has with its nodes. Thanks to this,
we can easily draw thousands of data points using
Canvas. On the other hand, Canvas is like a black
box, because after it has been displayed on the screen,
all we have is an image. Separately, it is worth men-
tioning the fact that the usage of interactivity requires
much more complex solutions, however, it can pro-
cess data animation much more efficiently than SVG.
Canvas is a good option when you create a visual-
ization that provides more data points than the SVG
could handle.
The advantage of WebGL is its productivity, in
which 3D graphics, millions of data and animations
can be displayed smoothly (Cantor and Jones, 2012).
The downside is complexity because WebGL is the
hardest of the work options, mainly due to the low
work level (Shepiliev et al., 2020). Most of the visu-
alizations you crave to do on the Internet can be done
Innovative Methods of Information Visualization in Transport Logistics and Training Organization
363

without the power of WebGL. However, if you are
trying to visually represent hundreds of thousands of
points, quickly animate thousands of points, or create
complex graphics that include 3D perspective com-
puting, WebGL will be almost indispensable.
3.2 Ant Approach to Solving Problems
The ant algorithm models a multi-agent system whose
agents are called ants (Blum, 2005). The ant approach
is based on three components: a list of nodes passed,
called the ant memory (tabu list); visibility, the value
reciprocal of the distance between points; and the vir-
tual pheromone trail on the rib. The implementation
of this algorithm is based on an approach in which the
probability of an ant choosing a specific route at each
step is determined by the relation (Shtovba, 2005):
P
ij
(t) =
F
ij
(t)
a
∗ N
β
ij
∑
(F
ik
(t)
a
∗ N
)
ik
β
(1)
where F
ij
(t) is the number of pheromones on this
route, N
ij
(t) is the length of the i j-th route, α and β
are two adjustable parameters that specify the weight
of the pheromone trail and visibility when choosing a
route. When α = 0, the nearest city will be selected,
which corresponds to the greedy algorithm in the clas-
sical theory of optimization. If β = 0, then only
pheromone amplification works, which entails the
rapid degeneration of routes to one suboptimal solu-
tion. The new pheromone value pheromone F(t + 1)
on the path i j is calculated through the old F(t) taking
into account the pheromone evaporation coefficient
b (Hauswirth, 2012): F
ij
(t + 1) = b ∗ F
ij
(t) + ∆F
ij
(t),
∆F
ij
(t) =
Q
K
n
, where Q is an adjustable parameter, the
value of which is chosen of the same order with the
length of the optimal route (pheromone value), and
K
n
is the length of the path between the start and end
points.
3.3 Software Design
The developed software design consists of: a config-
uration file in which all application parameters are
set (dimensions, grid colors, etc.); controllers work-
ing with the Main-Class(Grid, AntCanvas); systems;
auxiliary scripts; the basic Main file working with
HTML.
The visualization process works on a large number
of ants (agents) and has the ability to change the num-
ber of these agents. Moreover, the system supports a
frequency of 60 frames per second for a large (over
2 thousand) number of agents. The presented soft-
ware product provides the user with functions that are
accessible from the user interface, such as: building
routes on the grid; storage / loading of routes; launch
of ant colony optimization (ACO) algorithm and some
of its modifications to the search on the grid; compar-
ison of the results of various modifications of the al-
gorithm in time and processor load; storage of reports
and screenshots of algorithm.
In view of the fact that the main practical appli-
cation of the presented method (application) is to find
the shortest way for transporting or delivering an In-
ternet package on the network, the user should be
given the opportunity to reflect the algorithm on the
graph. Since the graph is a combination of arcs and
vertices, the basis for the graph is a fixed grid of ver-
tices, and the user, to simplify the work with the ap-
plication, will be able to build any graph by connect-
ing these vertices arbitrarily. Limiting the user with a
fixed grid, we lose the ability to make the graph flex-
ible, but it provides an opportunity to make a visual
analysis of the path length without software process-
ing all possible connection options, since it will be
more convenient for the user to determine the distance
in a fixed grid.
Considering the analysis of all the possibilities of
implementing animations in web applications and the
fact that the grid is limited by the user’s screen, SVG
was chosen as the optimal technology. The applica-
tion is resistant to actions that are not foreseen by the
main functionality, and informs the user of a found er-
ror in a particular place and in a particular modifica-
tion. The application architecture is as flexible as pos-
sible, which in the future gives developers the oppor-
tunity to create modifications to already implemented
algorithms without wasting time on visualization.
3.4 Capacity Assessment of the
Developed System
The designed application corresponds to the proto-
types in design and functionality. The ability to con-
trol other parameters of the algorithm was addition-
ally added. They are: the number of pheromones,
evaporation, alpha and beta values (1), as well as the
ability to hide the visual parts of the algorithm, if they
are not needed. This can significantly speed up the
program, especially if the user hides the drawing layer
of ants. An example of the interface of the constructed
program is shown in figure 1.
The constructed graph is designed so that the task
for the ACO algorithm is not trivial. Figure 2 shows
the optimal and two suboptimal solutions to the prob-
lem. Based on the approach proposed by Dorigo and
St
¨
utzle (Dorigo and St
¨
utzle, 2004), a modification of
the obtained ACO algorithm is implemented. The re-
AET 2020 - Symposium on Advances in Educational Technology
364
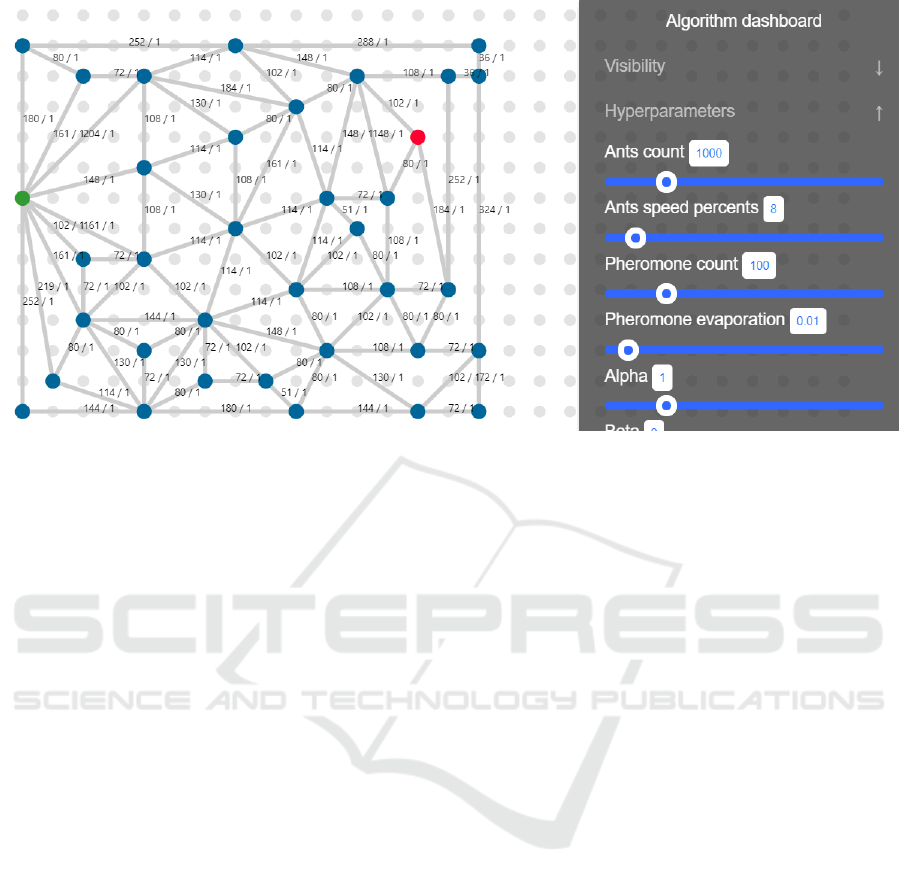
Figure 1: Example of routing task.
sults obtained make it possible to judge the optimal
choice of parameters when solving the traveling sales-
man problem with various initial data.
In figure 3 presents the process of finding the opti-
mal solution to the logistic problem. The created web
application helps users better understand the ant algo-
rithm.
Under the present study, a comparative analysis of
the application operation and analogue program Sim-
ple ACO JavaFx was carried out. To optimize the
developed application, passive evaporation was re-
placed by active one. Such a solution changes the
evaporation system from linear to exponential, and
pheromone values do not accumulate very quickly, as
in a similar program. The results obtained showed
that active evaporation is really more effective than
passive evaporation; however, in this case, ants be-
gan to choose the lower (blue) route more often. It
is worth noting that this route has one anomaly –
it has the shortest arcs to the start and end points.
Thus, it becomes clear that on this short route, ants re-
lease more pheromones, which makes the lower route
more attractive. To address this problem, a dual strat-
egy was applied to the determination of pheromones.
Other than providing a local value, an ant will now
remember the total distance covered, and on return-
ing to the starting point, additional pheromone values
will be determined by this distance. A comparative
analysis of the above solutions is presented in the ta-
ble 1. The resulting solution is effective in the use of
large-scale graphs. The analysis was performed with
the same value of ants (1000) and their speed. The
comparative analysis of algorithms by value of the re-
sources used in Windows Task Manager is presented
in figure 4. The built application consumes 85% at the
beginning and then 42% of CPU load, but a similar
one consumes 100% at the beginning, and loses a lot
in FPS value, and then 51%. Also, a similar program
is much worse than the new one in terms of graph-
ics resources: 18% vs 47%. Therefore, the developed
solution is optimal from the viewpoint of system re-
sources use and correctness of classical ant algorithms
work.
4 RESULTS
The logistics system of an enterprise can be viewed
from two sides. Its first important element is the effi-
ciency of the interconnection of the transport system
for the delivery of products built at the enterprise. On
the other hand, a software product is of particular im-
portance, using which you can train personnel both
at the enterprise and implement it in the educational
process.
The course “Transport logistics” is an integral part
of the training of highly qualified specialists, both
technical and economic specialties. Previously, this
subject was taught according to the standard curricu-
lum.Today, there are rapid changes in the existing
operating conditions of transport companies, so en-
terprises need specialists who meet the existing high
requirements. For this, it is necessary to introduce
new practical methods into the teaching methodol-
ogy of this discipline, which will strengthen theo-
retical knowledge with practical experience. Since
Innovative Methods of Information Visualization in Transport Logistics and Training Organization
365
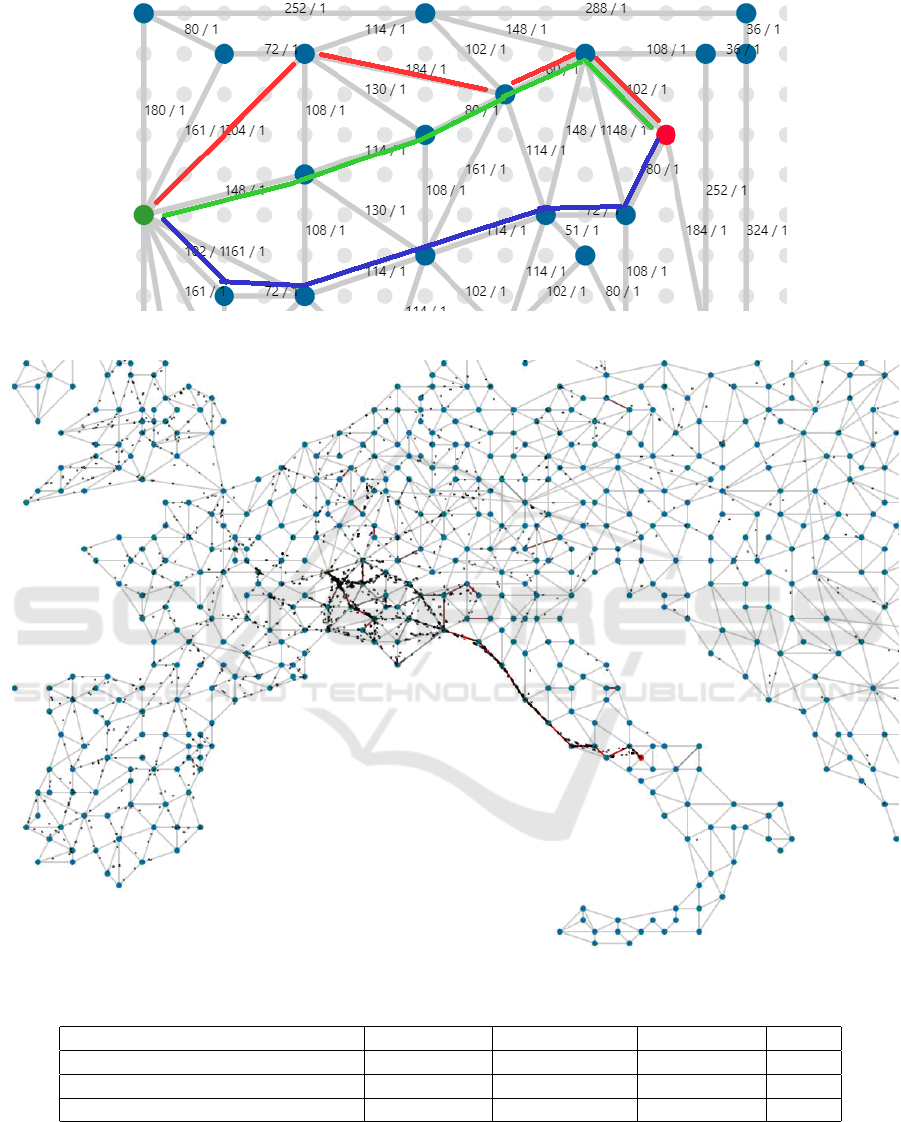
Figure 2: Solution of the routing problem. Red and blue are suboptimal solutions, green is an optimal solution.
Figure 3: Visualization of the solution of a logistic problem.
Table 1: Relative amount of route selection by different programs based on 100 iterations.
Upper route Optimal route Lower route Other
Built application 7% 71% 18% 4%
Built application after modification 7% 80% 9% 4%
Simple ACO JavaFx 11% 61% 13% 15%
in our time computerization covers all areas, it be-
comes necessary to strengthen practical training with
the help of modern computer programs.Cooperation
with employers in mastering the competencies of to-
day’s students ensures, with the help of our profes-
sionals, an increase in the efficiency of the enterprises
of the Ukrainian economy as a whole.
AET 2020 - Symposium on Advances in Educational Technology
366
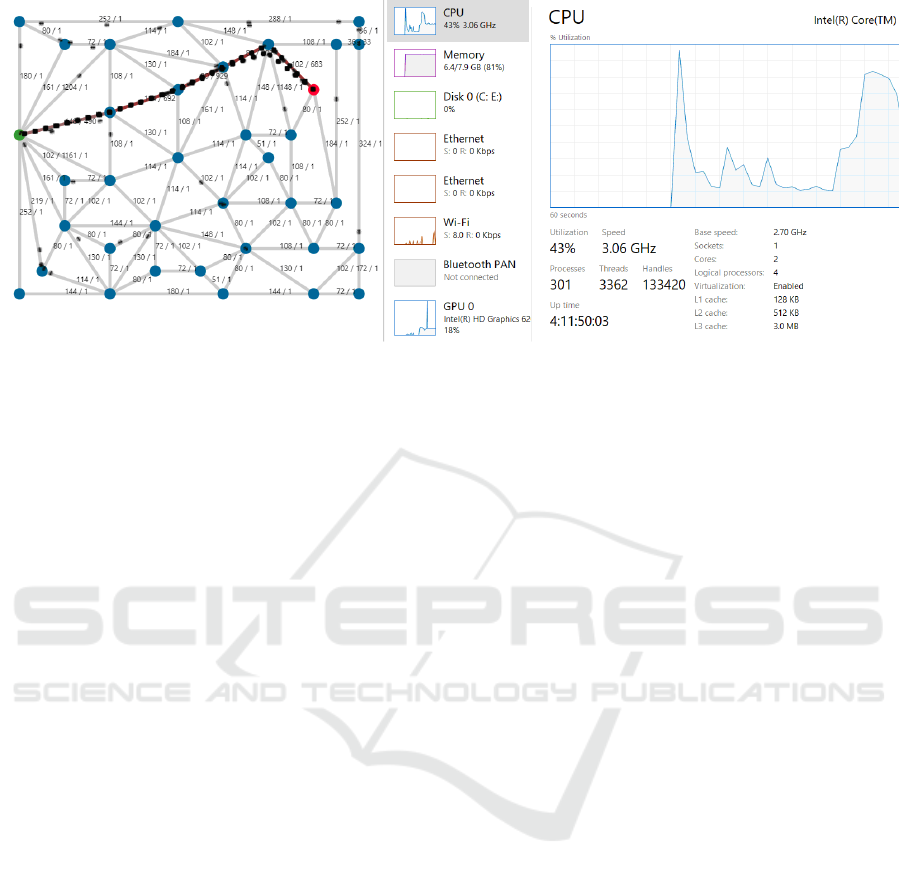
Figure 4: Use of computer resources for the built application.
4.1 Methodical Experiment
A methodical experiment, conducted even under ar-
tificially created conditions, is always a training one.
The experimental work was carried out on the basis of
the engineering institute of the Zaporizhzhia National
University. The students of the technical (software
engineering) and economic (accounting and taxation)
specialties participated in the experiment. At the be-
ginning, the testing was used to study and obtain feed-
back from stakeholders. Using special survey forms
for testing, the desired changes of definite courses in
the educational program in order to improve the qual-
ity of education were determined.
The survey highlights the need for taking into ac-
count the wishes of both employers and students, and
also indicates the interest of all participants of the
educational process in obtaining relevant competen-
cies, a high level of knowledge and skills based on
the learning outcomes. The analysis of survey forms
showed that a free choice of disciplines is provided
for building an individual educational trajectory for
100% of students. However, a survey of students
revealed their desire to change the work program,
namely: 30% of students feel the need to increase the
number of practical examples, 50% of students want
to solve specific tasks, that employers face, in prac-
tical classes, 20% of students want to try more other
teaching methods in the lessons, 40% of students be-
lieve that the material will be better comprehended if
during the lessons visualization of teaching methods
is used.
After studying the first module by students of the
indicated specialties of the corresponding educational
programs in the framework of the studied disciplines,
namely, “Mathematical Methods of Operations Re-
search” and “Economic and mathematical modeling”,
the results of a student survey were taken into account
and changes were made to the structure of the disci-
pline and its teaching methods.
For the reliability and purity of the experiment,
the students were divided into two groups – the con-
trol and the experimental. At the second stage, a for-
mative experiment was conducted. It made it possi-
ble to identify the pedagogical conditions for the bet-
ter possibility of solving creative tasks that integrate
the knowledge of various disciplines. In the control
group, classes in the developed elective course were
not conducted and students’ desire to solve creative
tasks was formed spontaneously. In the experimental
group, teaching of the orientation elective course was
carried out to form a willingness to solve specific cre-
ative tasks arising from employers. Within the frame-
work of the created complex of didactic support for
disciplines, students of the experimental group were
introduced to modern methods of presenting theoreti-
cal and practical material. For a better understanding
and information comprehension, the application for
visualization of the ant colony optimization algorithm
was used as an example in the relevant topics.
At the third stage of work (the ascertaining stage
of the experiment), a survey of the participants in the
experiment was conducted. The research results of
the quality of education, obtained on the basis of the
developed survey forms, are presented in table 2. At
the end of the study of relevant topics, students of both
the experimental and control groups were tested in or-
der to identify the level of assimilation of knowledge
and skills for their integration in the study of various
academic disciplines, as well as the ability to solve
creative tasks.
After the second module, it was noted that in those
Innovative Methods of Information Visualization in Transport Logistics and Training Organization
367
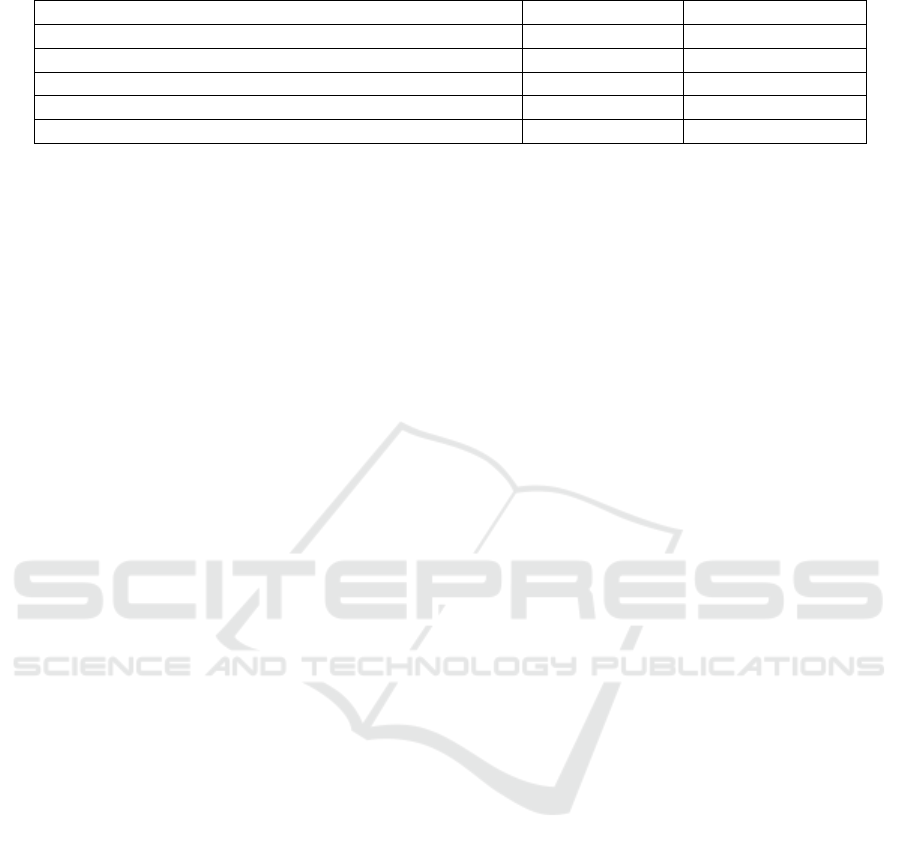
Table 2: The results of a students survey of the experimental group regarding the quality of training in the educational program.
Survey of respondents interests after first module after second module
Providing interesting discipline teaching 80% 95%
The need for visualization teaching methods 60% 100%
Willingness to solve creative problems 70% 100%
Sufficiency of solving specific tasks arising from employers 50% 97%
Satisfaction with the quality of teaching the discipline 80% 100%
groups where laboratory and practical exercises were
conducted with the help of a visualizer, the knowl-
edge, skills and ability to solve creative tasks were
found to be 40–50% higher (for various parameters).
The satisfaction of students with the sufficiency of the
quantity of specific tasks set by employers was almost
50% higher in the experimental group. All students
of the experimental groups were ready to solve cre-
ative tasks, at the same time, the number of such stu-
dents in the control groups was about 70%. Thus,
a change in the curriculum after clarifying the real
needs of students made it possible to increase student
satisfaction with the quality of teaching the discipline
by more than 20%. In modern conditions, a survey
of stakeholders showed how taking into account the
opinions of students affects the quality of teaching the
discipline and increases the level of students’ learn-
ing. The results of the experiment emphasized the
fact that the teacher conducting a regular survey of
students, studying their opinions and, based on their
needs, making changes to both their curriculum and
the plan for conducting their classes, may create an
integrated approach for maximizing the principle of
student centrism. Only the orientation on students’
interests and needs, provided by a timely survey, al-
lowed us to improve the quality of education of both
individual specialties and the educational system at
Zaporizhzhia National University as a whole.
4.2 Analysis of the Efficiency of the
Logistics System of Enterprises
Based on the information provided by the State Statis-
tics Service in annual statistical collections, we will
analyze the transportation of goods by road and
freight turnover of road transport in the regions of
Ukraine for 2010–2019 (figure 5, 6).
By regions of Ukraine, road freight transport in-
creased from 938.9 million tons in 2000 to 1147.0
million tons in 2019. The analysis of cargo trans-
portation by road in 2019 showed a high demand for
it in the regions of Ukraine, namely: Kyiv 51.5 mil-
lion tons, Cherkasy 34.6 million tons, Kharkov 29.6
million tons, Odessa 28.8 million tons, Lviv 24.4 mil-
lion tons, etc. However, the forecast of statistics on
road freight transport may decrease in the future, due
to the introduction of quarantine and periodic restric-
tions on trade in manufactured goods in stores and the
operation of markets, which will reduce the purchase
of goods by trade and entrepreneurs.
Meanwhile, in general, we see that the transporta-
tion of goods by road is in demand in all regions of
Ukraine.
By regions, the freight turnover of road transport
increased from 19281.6 million tons per km (tkm)
in 2000 to 64952.9 million tkm in 2019. In 2019,
the analysis of road transport turnover by regions
of Ukraine showed the following activity, namely:
Lviv 5150.1 million tkm, Kyiv 4253.8 million tkm,
Kharkov 3783.4 million tkm, Odessa 3693.5 mil-
lion tkm, Cherkasy 2270.9 million tkm, etc. During
all periods, there was an increase in the turnover of
road transport, except for a slight decrease in 2019
compared to 2018. The structure of road transport
turnover shows the following share by regions (direc-
tions of movement) of Ukraine, namely: western –
22%, northern – 16%, central – 16%, southern – 11%.
Thus, as we see, the freight turnover of road transport
has a significant impact on the economy of Ukraine,
so an important issue is to build an efficient logistics
system in the regions of Ukraine.
Profitability of operating activities as an integral
indicator of the efficiency of the logistics system is
calculated as follows: Po = (Op/Gc+Ac+Sc+Oe)∗
100%, where Po – profitability of operating activi-
ties; Op – profit from operating activities; Gc – cost
of goods sold (works, services); Ac – administrative
costs; Sc – sales costs; Oe – other operating expenses.
Based on the annual data on income, expenses and
profit of the enterprise, which are given in the State-
ment of financial results (Statement of comprehensive
income), we will calculate the integrated efficiency of
the logistics system of Transport Company LLC (ta-
ble 3).
Analysis of the integrated efficiency indicator of
the logistics system of Transport Company LLC for
2010–2019 showed that its indicator decreased from
15.4% to 13.6% every year. Therefore, in 2020,
the program presented in the work was introduced,
which increased the efficiency of the logistics sys-
AET 2020 - Symposium on Advances in Educational Technology
368
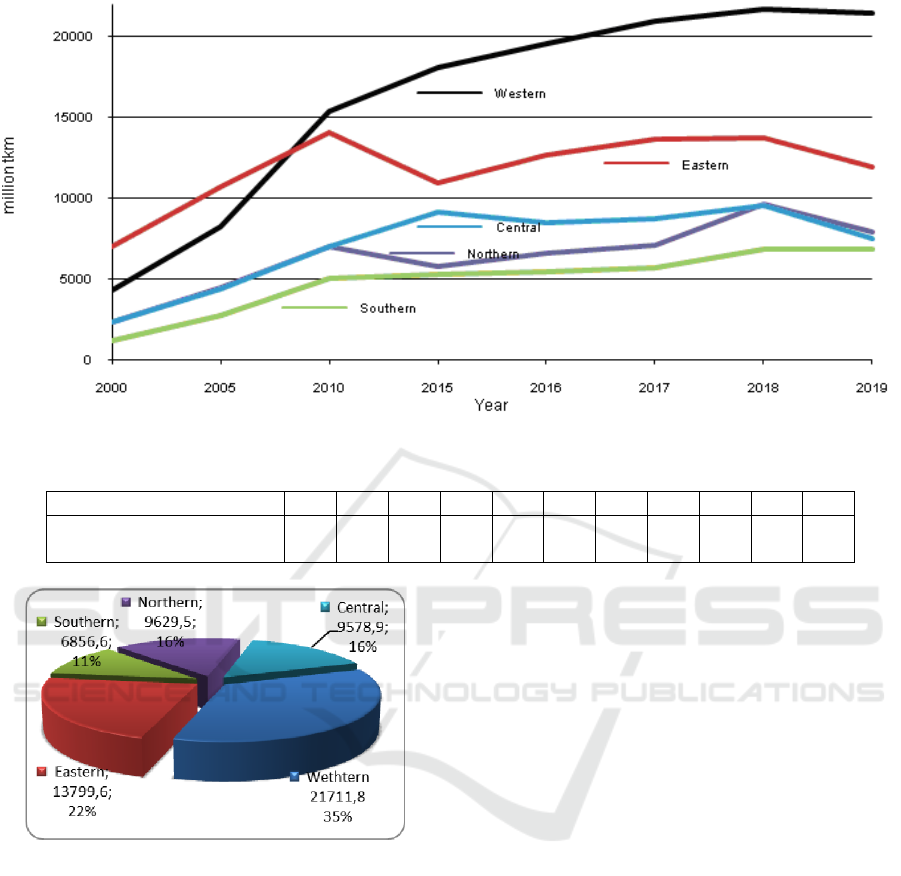
Figure 5: Freight turnover of road transport by regions.
Table 3: Calculation of the integrated indicator of the efficiency of the logistics system.
Indicator 2010 2011 2012 2013 2014 2015 2016 2017 2018 2019 2020
Integrated efficiency index
of the logistics system, %
15.4 15.2 15.0 14.8 14.6 14.4 14.2 14.0 13.8 13.6 23.1
Figure 6: Freight turnover structure of road transport by
region in 2018.
tem of Transport Company LLC by 1.5 times. Effi-
cient construction of transport routes significantly re-
duced the cost of delivery of goods, which increased
the efficiency of the logistics system and the company
“Transport Company” in general. The developed pro-
gram is universal, so its implementation is possible at
transport enterprises, as well as at private enterprises
and state institutions in the regions of Ukraine, which
will increase their economic efficiency.
An assessment of the economic efficiency of lo-
gistics services can be made by calculating the indi-
cator of the same name, reflecting the amount of lo-
gistics costs that are necessary to ensure 1% of the
quality of service: Le = Lc/Qs, where Lc – logistics
costs associated with the execution of a service order
in the logistics system, UAH; Qs – the quality of lo-
gistics services, assessed by the degree of satisfaction
of consumers’ requests, %.
The assessment of the economic efficiency of lo-
gistics services of Transport Company LLC for 2020
showed an increase in its efficiency indicator by re-
ducing logistics costs and improving the quality of
service in the logistics system.
5 CONCLUSIONS
This article analyzes the ways of developing forms
and methods of teaching and learning with the aim to
form students’ creative thinking that helps to increase
creative potential. A visualization of the ant colony
optimization algorithm is proposed as a means of in-
teractive teaching of students of various specialties
in logistical tasks. Full visualization of the ant algo-
rithm, including: graph construction, simulation of a
dynamic network (adding and deleting a graph while
running an algorithm), visualizing the movement of a
large number of ants, saving and loading a graph, giv-
ing the user the ability to clean visible layers during
algorithm operation for visualization simplification,
has been implemented. The conducted comparative
analysis proved that with the correct algorithm con-
Innovative Methods of Information Visualization in Transport Logistics and Training Organization
369

struction it is possible to achieve strong performance
in choosing the optimal routes.
During the experiment to verify the effectiveness
of the use of visualization in achieving academic com-
petencies, it was noted that about 40% of students
consider it necessary to change the curriculum in the
direction of using visualization of teaching methods.
After classes, a comparison of the results of the ex-
perimental and control groups showed that skills and
abilities to solve creative problems were higher by
40–50%. Students’ satisfaction with the quality of
teaching and the number of solved practical problems
also increased by 20–30%, which indicates the pos-
itive impact of this interactive method on the edu-
cational process. So, to conclude, we can say that
the symbiosis of collective work on the study of sci-
entific problems and the introduction of development
results into the educational process of the specialties
“Accounting and Taxation” and “Software Engineer-
ing” made it possible to improve the quality of teach-
ing disciplines. Thus, the use of active and interac-
tive methods in the process of teaching engineering
and economic specialties helps to optimize the edu-
cational process, increases the informative capacity
of the material studied, as well as improves the ef-
ficiency of learning.
REFERENCES
Aulin, V., Hrynkiv, A., Lyashuk, O., Vovk, Y., Lysenko, S.,
Holub, D., Zamota, T., Pankov, A., Sokol, M., Ratyn-
skyi, V., and Lavrentieva, O. (2020). Increasing the
functioning efficiency of the working warehouse of
the “UVK Ukraine” company transport and logistics
center. Communications - Scientific Letters of the Uni-
versity of Zilina, 22(2):3–14.
Blum, C. (2005). Ant colony optimization: Introduction and
recent trends. Physics of Life Reviews, 2(4):353–373.
Bowersox, D., Kloss, D., and B., C. M. (2019). Supply
Chain Logistics Management. McGraw-Hill Higher
Education, 5th edition.
Cantor, D. and Jones, B. (2012). WebGL Beginner’s Guide.
Packt Publishing.
Dorigo, M. (1992). Optimization, Learning, and Natural
Algorithms. PhD thesis, Politecnico di Milano.
Dorigo, M. and St
¨
utzle, T. (2004). Ant Colony Optimiza-
tion. The MIT Press.
Eppler, M. J. and Aeschimann, M. (2009). A systematic
framework for risk visualization in risk management
and communication. Risk Management, 11(2):67–89.
Eppler, M. J. and Platts, K. W. (2009). Visual strategizing:
the systematic use of visualization in the strategic-
planning process. Long Range Planning, 42(1):42–
74.
Fırat, E. E. and Laramee, R. S. (2018). Towards
a survey of interactive visualization for education.
In Tam, G. and Vidal, F., editors, Proc. EG UK
Computer Graphics & Visual Computing, pages
91–101. https://cs.swan.ac.uk/
∼
csbob/research/star/
education/firat18towards.pdf.
Frain, B. (2020). Responsive Web Design with HTML5 and
CSS3: Develop future-proof responsive websites us-
ing the latest HTML5 and CSS techniques. PACKT
publishing, third edition.
Gordeev, D. S. (2018). A survey of visualization tech-
niques of algorithms on graphs. Scientific Visualiza-
tion, 10(1):18–48.
Hauswirth, M. (2012). Moving from visualization for teach-
ing to visualization for learning. In Workshop on Vi-
sualization in University Level Computer Science Ed-
ucation @ CSERC’12.
Ivanova, H. I., Lavrentieva, O. O., Eivas, L. F., Zenkovych,
I. O., and Uchitel, A. D. (2020). The students’ brain-
work intensification via the computer visualization
of study materials. CEUR Workshop Proceedings,
2643:185–209.
Kazhan, Y. M., Hamaniuk, V. A., Amelina, S. M.,
Tarasenko, R. O., and Tolmachev, S. T. (2020). The
use of mobile applications and Web 2.0 interactive
tools for students’ german-language lexical compe-
tence improvement. CEUR Workshop Proceedings,
2643:392–415.
Kiv, A., Soloviev, V., Tarasova, E., Koycheva, T., and
Kolesnykova, K. (2020). Semantic knowledge net-
works in education. E3S Web of Conferences,
166:10022.
Klerkx, J., Verbert, K., and Duval, E. (2014). Enhancing
learning with visualization techniques. In Spector,
J. M., Merrill, M. D., Elen, J., and Bishop, M. J., ed-
itors, Handbook of Research on Educational Commu-
nications and Technology, pages 791–807. Springer
New York, New York, NY.
Kolomeychenko, M. and Chepovskiy, A. (2014). Huge
graph visualization and analysis. Business Informat-
ics, (4 (30)):7–16. https://bijournal.hse.ru/en/2014–4
(30)/143005206.html.
Malchenko, S. L., Mykoliuk, D., and Kiv, A. E. (2020). Us-
ing interactive technologies to study the evolution of
stars in astronomy classes. CEUR Workshop Proceed-
ings, 2547:145–155.
Mazorchuk, M. S., Vakulenko, T. S., Bychko, A. O.,
Kuzminska, O. H., and Prokhorov, O. V. (2020).
Cloud technologies and learning analytics: Web ap-
plication for PISA results analysis and visualization.
CEUR Workshop Proceedings, 2879:484–494.
Moglan, V. D. (2019). Didactic potential of using systems
for visualization of algorithms in the process of teach-
ing programming. Open Education, 23(2):31–41.
Mukhametzhanova, A. O., Aydarbekova, K. A., and
Mukhametzhanova, B. O. (2016). Interaktivnye
metody obucheniya v vuze (interactive teaching meth-
ods in high school). Mezhdunarodnyy zhurnal prik-
ladnykh i fundamental’nykh issledovaniy, (2-1):84–
88.
Okopna, Y., Morska, N., Stakhova, O., Voinalovych, L.,
Protas, O., and Kravchenko, O. (2020). Analogy of
AET 2020 - Symposium on Advances in Educational Technology
370

tasks of traditional and interactive approaches to stu-
dents’ education in higher education institutions. Sys-
tematic Reviews in Pharmacy, 11(8):287–289.
Osinska, V. and Osinski, G. (2018). Information visualiza-
tion techniques in the social sciences and humanities.
IGI Global.
Panina, V. (2014). Vestnik Kazan. tekhnol. un-ta, (16):316.
Panteleyev, A. V. and Alyoshina, E. A. (2008). Al-
gorithmic and program support elaboration of ant
colony method. Nauchnyi vestnik Moskovskogo gosu-
darstvennogo tekhnicheskogo universiteta grazhdan-
skoi aviatcii, (132).
Pavlenko, O., Velykodnyi, D., Lavrentieva, O., and Fila-
tov, S. (2020). The procedures of logistic transport
systems simulation into the Petri nets environment.
CEUR Workshop Proceedings, 2732:854–868.
Shepiliev, D. S., Modlo, Y. O., Yechkalo, Y. V., Tkachuk,
V. V., Mintii, M. M., Mintii, I. S., Markova, O. M., Se-
livanova, T. V., Drashko, O. M., Kalinichenko, O. O.,
Vakaliuk, T. A., Osadchyi, V. V., and Semerikov, S. O.
(2020). WebAR development tools: An overview.
CEUR Workshop Proceedings, 2832:84–93.
Shtovba, S. D. (2005). Ant algorithms: Theory and ap-
plications. Programming and Computer Software,
31(4):167–178.
Soloviev, V., Moiseienko, N., and Tarasova, O. (2020).
Complexity theory and dynamic characteristics of
cognitive processes. Communications in Computer
and Information Science, 1175 CCIS:231–253.
Stock, R. and Lambert, D. (2001). Strategic Logistics Man-
agement. McGraw-Hill, Irwin.
Vasylenko, Y., Shmyger, G., and Verbovetskyi, D. (2019).
Some aspects of designing of the structural semantics
visualization system. CEUR Workshop Proceedings,
2546:235–248.
Zijm, H., Klumpp, M., Clausen, U., and ten Hompel, M.,
editors (2015). Logistics and Supply Chain Innova-
tion. Lecture Notes in Logistics. Springer, Cham.
Innovative Methods of Information Visualization in Transport Logistics and Training Organization
371
