
Training Teachers-to-Be to Create Infographics and Its Expert
Evaluation
Nadiia V. Olefirenko
1 a
, Nataliia O. Ponomarova
1 b
, Vira M. Andriievska
1 c
, Olena O. Gulich
1 d
,
Andrii Y. Gaidus
2 e
and Iryna A. Lyakhova
3 f
1
H. S. Skovoroda Kharkiv National Pedagogical University, 29 Alchevskyh Str., Kharkiv, 61002, Ukraine
2
Kharkiv Petro Vasylenko National Technical University of Agriculture, 44 Alchevskyh Str., Kharkiv, 61002, Ukraine
3
State University of Economics and Technology, 5 Stepana Tilhy Str., Kryvyi Rih, 50006, Ukraine
Keywords:
Creating Infographics, Infographics, Young Learners, Experimental Research, Expert Evaluation.
Abstract:
The study purpose is to develop methods for preparing students to create infographics for educational purposes
and its expert evaluation. Creating an educational infographic is an interesting, but quite complex activity for
a teacher, which requires both the expansion of existing psychological and pedagogical knowledge and skills,
and the formation of new ones. The modules “Infographics in educational activities” and “Expert evaluation
of e-tools’ quality for teaching students” are offered for teachers-to-be. The determination of the weighting
factor of each criterion by expert evaluations was organized. Experimental implementation of the developed
modules is carried out. On the basis of the criterion rank, the significance of each criterion was calculated.
The indicators to determine the level of preliminary expert evaluations of e-tools are proposed. The results are
calculated with nonparametric methods of mathematical statistics. The conclusion is the expert evaluation has
different activity stages, gradually becoming a common phenomenon.
1 INTRODUCTION
The increasing speed of the modern digital world,
saturated with information and communication tech-
nologies, the habits of the modern young genera-
tion to multitasking, to the perception of a significant
amount of information, lead to the need for changes in
the learning process. First of all, changes and signif-
icant modernization require didactic tools used in the
lesson – such tools must correspond to the methods
chosen by the teacher, the specific situation in the les-
son, the peculiarities of students’ perception of infor-
mation. In modern conditions, didactic tools should
be variable, comfortable, flexible, adaptive, – those
that can be changed according to existing class needs
or new capabilities of technical means.
It should be noted that currently the range of avail-
able electronic tools has significantly expanded for
a
https://orcid.org/0000-0002-9086-0359
b
https://orcid.org/0000-0002-0172-8007
c
https://orcid.org/0000-0003-1632-4045
d
https://orcid.org/0000-0002-3846-1916
e
https://orcid.org/0000-0001-8414-5765
f
https://orcid.org/0000-0001-7589-8351
the needs of the lesson on the methodical web portals
and pages of pedagogical forums the following types
of electronic resources are offered (depending on the
educational purpose) (Olefirenko, 2015):
• means-sources of educational information: pre-
sentation of information about objects of study
(electronic textbooks and manuals, presentations),
models of objects of reality (figurative – photos,
images, illustrations, videos, etc., verbal – audio
recordings, sign – schemes, mental maps);
• means of organizing the assimilation of educa-
tional material (electronic simulators);
• means of control and diagnostics of educational
process (means of automated testing);
• means of research, creation and reproduction of
sources of information.
Infographics nowadays are one of the didactic
tools widely used in education, which provide a struc-
tured and systematic visualization of models of pro-
cesses and phenomena in static and dynamic form
(Ivanova et al., 2020). Currently, infographics are ac-
tively used in the presentation of news or analytical
data, in marketing, in journalism. Recently, in the
Olefirenko, N., Ponomarova, N., Andriievska, V., Gulich, O., Gaidus, A. and Lyakhova, I.
Training Teachers-to-Be to Create Infographics and Its Expert Evaluation.
DOI: 10.5220/0010931200003364
In Proceedings of the 1st Symposium on Advances in Educational Technology (AET 2020) - Volume 2, pages 311-322
ISBN: 978-989-758-558-6
Copyright
c
2022 by SCITEPRESS – Science and Technology Publications, Lda. All rights reserved
311

form of infographics provide both educational infor-
mation and policy (including quite official).
There are a number of factors that motivate teach-
ers to use infographics in the learning process:
• infographics are modern, and currently the most
powerful way of presenting data, which is clear
and familiar to students;
• increasing the number of infographics in the en-
tire media product, in advertising materials, text-
books, etc. requires certain skills – read informa-
tion, compare it, correctly perceive the data, an-
alyze the data and draw conclusions, which de-
termines the feasibility of including tasks to work
with infographics in class;
• due to the brevity, conciseness of information, the
ability to compare data, the availability of images
that are easy to remember, students are quickly in-
volved in the process of its consideration, in work-
ing with data;
• the use of infographics contributes to the forma-
tion of students’ skills of the future – to analyze
and critically evaluate information, depending on
the information received to make decisions;
• dynamic infographics allow you to quickly com-
pare data and draw conclusions;
• involvement of students in the independent cre-
ation of infographics from the school course is
one of the effective ways to master the material,
as it requires a lot of work to collect data, select
the most useful, systematize information, design
it in a convenient form;
• acquaintance with the concept of infographics and
the formation of skills in the use of various meth-
ods of data presentation is provided by the cur-
riculum of the subject “Computer Science” for
students of 10-11 grades of secondary schools at
the standard level and in specialized classes.
Thus, our research on the training teachers-to-be
to create infographics and its evaluation is in line with
current issues.
2 RECENT WORK
The problem of training teachers-to-be to create vi-
sual teaching aids is revealed in many psychologi-
cal and pedagogical studies. The research (Bartlett,
1927; Bilousova and Zhyteneva, 2014; Davydov,
1988; Erdniev and Erdniev, 1976; Holub et al., 2020;
Kalmykova, 1959; Kravtsov and Pulinets, 2020; Ma-
zorchuk et al., 2020; Midak et al., 2021; Min-
sky, 2013; Raputo, 2010; Verbitsky and Kalashnikov,
2015) are devoted to the theoretical and methodolog-
ical bases of visualization of educational material in
the educational process. Despite the variety of exist-
ing interpretations of the concept of visualization, re-
searchers agree that due to the growth of information
flows visualization is a new means of reflecting the
objective world in the mind of the subject, which has
significant didactic potential (Raputo, 2010). Under
the conditions of visualization, visual images reduce
the chain of verbal reasoning and contribute to the
synthesis of the image of the concept of greater ca-
pacity (Biloshapka, 2007). Visualization helps to fo-
cus on the essential components of the learning mate-
rial and to understand the connections between them.
On the other hand, the use of visualization brightens
and makes more convincing educational material (Sa-
fina, 2010), allows you to create the effect of situa-
tional expression, an atmosphere of ease, enriches the
educational process (Briantseva, 2006). It is impor-
tant that visualization stimulates students to compre-
hend, generalize, clarify perceived images, ensures
the completeness and integrity of their perception
(Bilousova and Zhyteneva, 2014), activates various
forms of thinking students visually effective, figura-
tive, associative and others (Polyakova, 2012).
The development of modern visualization tools is
a factor in the creation of both innovative teaching
methods and new pedagogical technologies. For ex-
ample, Manko (Manko, 2009) sees visualization as
the basis for the formation of a qualitatively new stage
of development of the fundamental principle of learn-
ing – the principle of clarity.
At the same time, Bilousova and Zhyteneva
(Bilousova and Zhyteneva, 2014) emphasize the need
for early preparation of teachers for the use of visual-
ization in the educational process.
In general, the use of visualization in teachers-to-
be training allows to solve a number of educational
and pedagogical tasks, including the activation of ed-
ucational and cognitive activities, the formation of
skills of systematization, analysis, highlighting, cod-
ing and recoding of educational information, devel-
opment of figurative perception and visual thinking,
development of visual culture, etc. (Movchan, 2017).
In turn, mastering the basics of infographics de-
velopment by teachers-to-be, in the opinion of ex-
perts, is appropriate not only in terms of acquiring
skills in developing modern teaching aids, but also a
powerful means of obtaining their own experience of
project activities use of information and communica-
tion technologies, etc.) (Grushevskaya, 2016).
Institutions of higher pedagogical education have
accumulated some experience in teaching the basics
of infographics development. For example, work-
AET 2020 - Symposium on Advances in Educational Technology
312

shops on information technology have been devel-
oped, the purpose of which includes mastering a wide
range of the most common services of creating info-
graphics (Ponomareva, 2015). Teachers-researchers
offer separate methods of teaching infographics de-
velopment in institutions of higher pedagogical edu-
cation – work of Grushevskaya (Grushevskaya, 2016)
presents the experience of teaching future teachers
to create infographics as a multi-stage process, in-
cluding goal setting, collecting and verifying infor-
mation, systematization of data and concept develop-
ment, prototyping, implementation.
Noteworthy are the attempts of scientists to imple-
ment new methodological approaches (e.g., acmeo-
logical) to prepare teachers-to-be for the visualization
of educational information (Briantseva and Briantsev,
2019).
Equally important in this perspective is teachers-
to-be training to evaluate existing and own means of
visualization. According to Choshanov (Choshanov,
2013), the teacher should be able to choose and de-
velop their own assessment methods that meet the
goals and content of education, use assessment data
to improve teaching, and motivate students to learn.
Problems of assessing the quality of e-learning tools
are highlighted in (Alkhattabi et al., 2011; Atanasova,
2019; Bilousova and Zhyteneva, 2014; Bykov et al.,
2001; Elumalai et al., 2019; Ginns and Ellis, 2009;
Hay et al., 2008; Iryanti and Pandiya, 2017; Kazaine,
2017; Khalid and Ziden, 2016; Leontiev et al., 2020;
Little, 2003; Lytvynova, 2013; Lundqvist et al., 2006;
Male and Pattinson, 2011; Markovi
´
c and Jovanovi
´
c,
2012; Marshall, 2012; Pons et al., 2015; Robert et al.,
2016; Stasiecka et al., 2005, 2006; Vasconcelos et al.,
2020; Wu and Lin, 2012; Yang et al., 2007; Zhaldak
et al., 2021). In particular, Lytvynova (Lytvynova,
2013) notes that expert activity is undergoing a stage
of formation, gradually becoming commonplace, and
the relevance of research in the field of examination of
electronic educational resources is associated with the
trend of standardization and systematization of elec-
tronic educational content. To this end, there is an
active discussion of various aspects of the creation
and use of electronic content in the scientific circles
of the National Academy of Educational Sciences of
Ukraine, the boards of the Ministry of Education and
Science, educational institutions and identify the need
to substantiate the foundations for creating the exper-
tise (Lytvynova, 2013).
Our previous works highlight the education poten-
tial of e-tools for teaching young learners, e-tool cre-
ation in various instrumental environments ICT use
for young learner (Olefirenko et al., 2019)). However,
some problems of students’ training for creation in-
fografic and it evaluation have not been covered in
previous research studies.
Creating quality infographics is a rather time-
consuming, multi-stage purposeful activity of a
teacher that requires diverse knowledge, skills and
abilities. Thus, our research is aimed at developing
methodological support for teachers-to-be in design-
ing infographics for the educational process, as well
as its expert evaluation.
3 MATERIAL AND METHODS
3.1 Explored Materials Used in the
Experiment
The choice of examples of infographics and software
used in the experimental study was due to the need
to acquaint teachers-to-be with current trends in the
presentation of information.
3.2 Methods for Investigation
The following research methods were used in a com-
plex to solve the set tasks and achieve the goal:
• theoretical: analysis of psychological, pedagogi-
cal works, systematization of views and achieve-
ments of scientists, study of normative documents
(to identify requirements for e-learning tools, de-
termine the methodological aspects of training
teachers-to-be for expert evaluation of e-learning
tools);
• experimental: pedagogical experiment – for ex-
perimental testing of the research hypothesis; di-
agnostic – questionnaires, observations, analysis
of the results of control tasks (to collect data to
determine the level of formation of skills of expert
assessment of students); methods of mathematical
statistics (for processing the results of empirical
research).
4 RESULTS
Creating infographics for the needs of the educational
process is an interesting, but quite complex activity
for a teacher, it requires both the expansion of ex-
isting psychological and pedagogical knowledge and
skills, and the formation of new ones. Considering
that at designing infographics, the focus should be
done on students of a particular age with their inher-
ent characteristics of information perception, think-
ing, memory, certain life and educational experience,
Training Teachers-to-Be to Create Infographics and Its Expert Evaluation
313

thinking through the content of infographics requires,
first of all, such psychological and pedagogical skills:
to determine the purpose development, to predict the
actions of the student at working with infographics,
which will really lead to the desired result, to be able
to plan the actions of students so as to support the in-
terest of the student, to avoid uniformity in the tasks.
Considerable attention needs to be paid to the selec-
tion of information that should be presented in the
form of infographics. To achieve that a teacher needs
the ability to work with information and communica-
tion technologies for the creation and design of text
materials, the ability to search and select the neces-
sary materials in collections hosted on the network
(skills to create a search query, sort found resources
by various parameters, evaluate their reliability), cre-
ate and prepare the illustrative materials (cutting the
desired fragment, increasing or decreasing its scale,
correction of color tones of the picture, overlapping
one image on another, adding a text comment to the
picture, etc.), skills of structuring and accumulation
of prepared training materials on electronic media.
It should be noted that despite the availability of a
large number of illustrative materials, templates, an-
imations, software development stored in online col-
lections, the teacher must know and follow the general
and special rules of the site for copying and using ma-
terials, preserving the rights of authors to intellectual
property.
In addition, the preparation of materials requires
knowledge of the teacher on the selection of color and
font design, understanding of the impact of colors and
their combinations on the physiological and psycho-
logical state of the student, the principles of comfort-
able information on the computer screen, recommen-
dations for font design information for students of dif-
ferent ages.
The success of infographic training is based on
the teacher’s knowledge (figure 1) of the peculiari-
ties of the student’s perception of information from
the computer screen; ability to analyze and recognize
such situations on the screen that require adjustments
in the placement of information, its structuring and
design; ability to edit and correct educational materi-
als to ensure their comfortable perception; condense
educational information through accurate formulation
and visualization; ability to use logical accents com-
petently – special techniques aimed at attracting the
attention of a student to a particular object.
To implement infographics, the teacher can use
both universal software (for example, a program for
creating presentations) and special ones, which are
designed to infographic training. Therefore, the
teacher needs to be acquainted with various tools in
order to choose the one that will be convenient for the
implementation of the plan.
Due to the fact that the conditions of a particular
lesson are unique, and the teacher is not able to carry
out a full-scale experimental testing of infographics,
during which errors can be identified and corrected,
which is why it is important to carry out its prelim-
inary pedagogical examination. Examination of e-
learning tools (including infographics) includes the
ability to assess their compliance with a set of psy-
chological, pedagogical, ergonomic and technical re-
quirements.
We have developed a structure of training mod-
ules “Infographics in educational activities” and “Ex-
pert evaluation of the e-tools’ quality for teaching stu-
dents”, which are taught in the discipline “Design
of didactic electronic resources” for masters-to-be in
“Computer Science” or elective discipline “Visualiza-
tion technologies in educational practice” for masters-
to-be of any specialty.
The purpose, tasks and expected results of stu-
dents after studying of the specified modules are de-
fined (table 1). The content of modules has been de-
veloped, a set of teaching materials – demonstration
materials has been prepared, the content of practical
and laboratory tasks for students has been developed,
tasks for independent elaboration and further discus-
sion have been selected, a set of examples of info-
graphics for analysis and expert evaluation has been
selected.
Mastering the proposed modules included the top-
ics presented in table 2.
The pedagogical experiment took place during
2015–2020 years on the basis of the Faculty of
Physics and Mathematics of H. S. Skovoroda Kharkiv
National Pedagogical University. The study involved
102 full-time and part-time students. The experimen-
tal work was carried out in several stages: preparatory,
formative, control.
At the preparatory stage, an experimental and con-
trol groups were formed. To do this, we conducted a
survey on the existing experience of reading the infor-
mation provided in the form of infographics, on the
creation of infographics to present educational mate-
rial, available knowledge and skills on such activities.
According to the results of the survey, we grouped
students by the level of identification of their moti-
vation, knowledge and skills in the evaluation of e-
tools in four groups: low level, medium, sufficient,
high. The obtained results were evaluated by non-
parametric methods of mathematical statistics, in par-
ticular, by Pearson’s criterion: at this stage the dif-
ference between students of control and experimental
groups is insignificant. Based on the obtained data,
AET 2020 - Symposium on Advances in Educational Technology
314
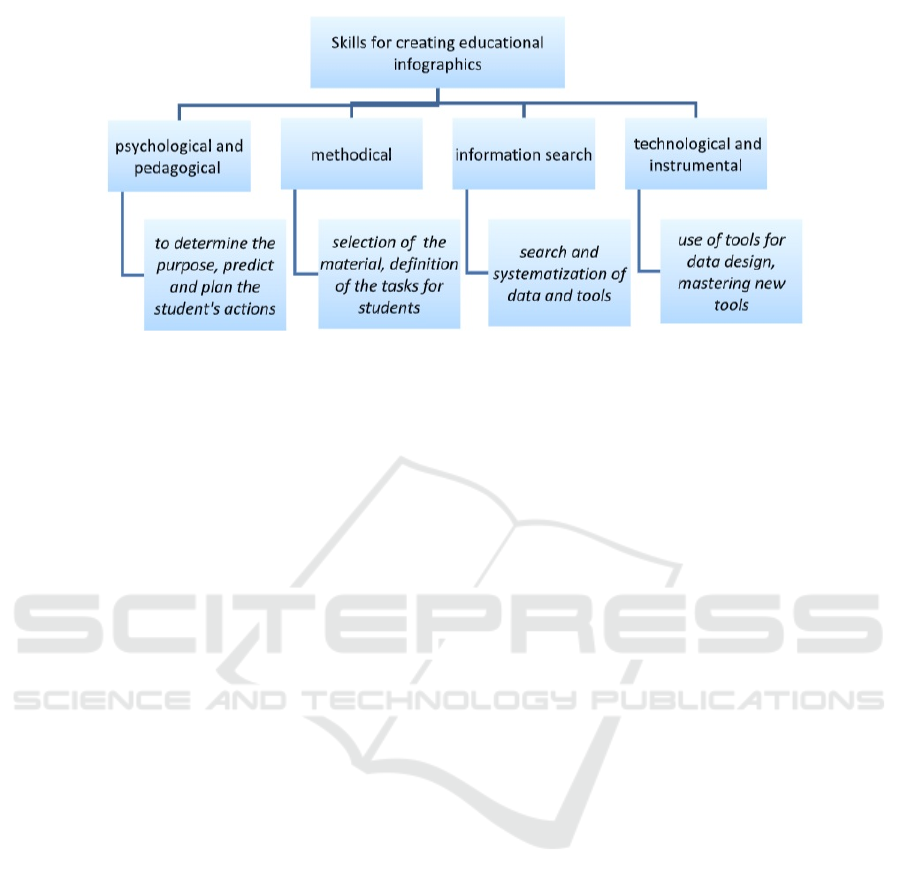
Figure 1: Skills for creating educational infographics.
the contingent of experimental and control groups of
students was established – 42 students were included
in the control group, 60 in the experimental group,
which was due to recruitment to academic groups.
During the formative phase of the study, teachers-
to-be learned to present teaching materials in the form
of infographics and evaluate them using the method of
expert evaluation.
Within the module “Infographics in educational
activities” masters-to-be were introduced to the con-
cept of infographics and its importance in presenting
information, the historical path of its development. To
understand the peculiarities of the use of infograph-
ics in the educational process, students compared the
ease of perception of information presented in differ-
ent ways, discussed the amount of material that can be
perceived, the importance of design and more. Dur-
ing the practical classes we tried to structure and for-
malize all the results of the discussion. For example,
the content of the infographic and certain features stu-
dents presented in the form of a table, a diagram or a
mental map (figure 2).
Teachers-to-be were acquainted with the types of
infographics by the nature of visualization, selected
examples of educational infographics for each type.
An essential component in mastering this module
was the creation of infographics for the presentation
of educational material. Note that since the course
is designed for masters-to-be who already have ba-
sic skills to use information and communication tech-
nologies to design text and graphics, search for tools
and install them on a computer, etc., the training was
not aimed at mastering the available tools, and on for-
mation of abilities and skills to structure educational
information, to create an integral resource, to adhere
to one style at registration of text materials, numer-
ical data, illustrative images. Examples of student’s
works (G. Tsekhmistrova, M. Korotetska) are shown
in figure 3.
Teachers-to-be were acquainted with the system
of demands for e-learning tools and for educational
infographics in particular, learned to determine the
degree of compliance in the e-learning tool. To
this end, a number of educational infographics were
demonstrated, and a discussion was held in which
students found out how each of the requirements
was met; how different requirements can be imple-
mented simultaneously. During the practical classes
it was important that students not only recognize how
much a particular demand is met in the proposed tool,
but also determine the appropriateness of the chosen
methods to ensure it.
Since working with infographics should be com-
fortable for the student, it is important to deepen the
knowledge of the primary school teachers-to-be re-
garding the general design of the didactic resource
and ensure its ergonomics. Students in the process of
practical use of various tools on their own experience
were convinced that the design and ergonomics of in-
fographics affect the user’s desire to work with this re-
source, to perform practical tasks. In addition, it was
important to consider the specifics of the student’s
perception of information from the computer screen
and mobile devices, the impact of certain parameters
of the e-tool on the psychological and physical condi-
tion of students, principles and norms of comfortable
design of didactic e-resource.
In addition, it was important to develop students’
ability to make decisions about the design of e-tools
depending on its goal and purpose – for this purpose it
was proposed to perform a number of tasks in which
it was necessary to place and design the provided
elements depending on predetermined conditions, to
condense textual information (definitions, task texts,
Training Teachers-to-Be to Create Infographics and Its Expert Evaluation
315
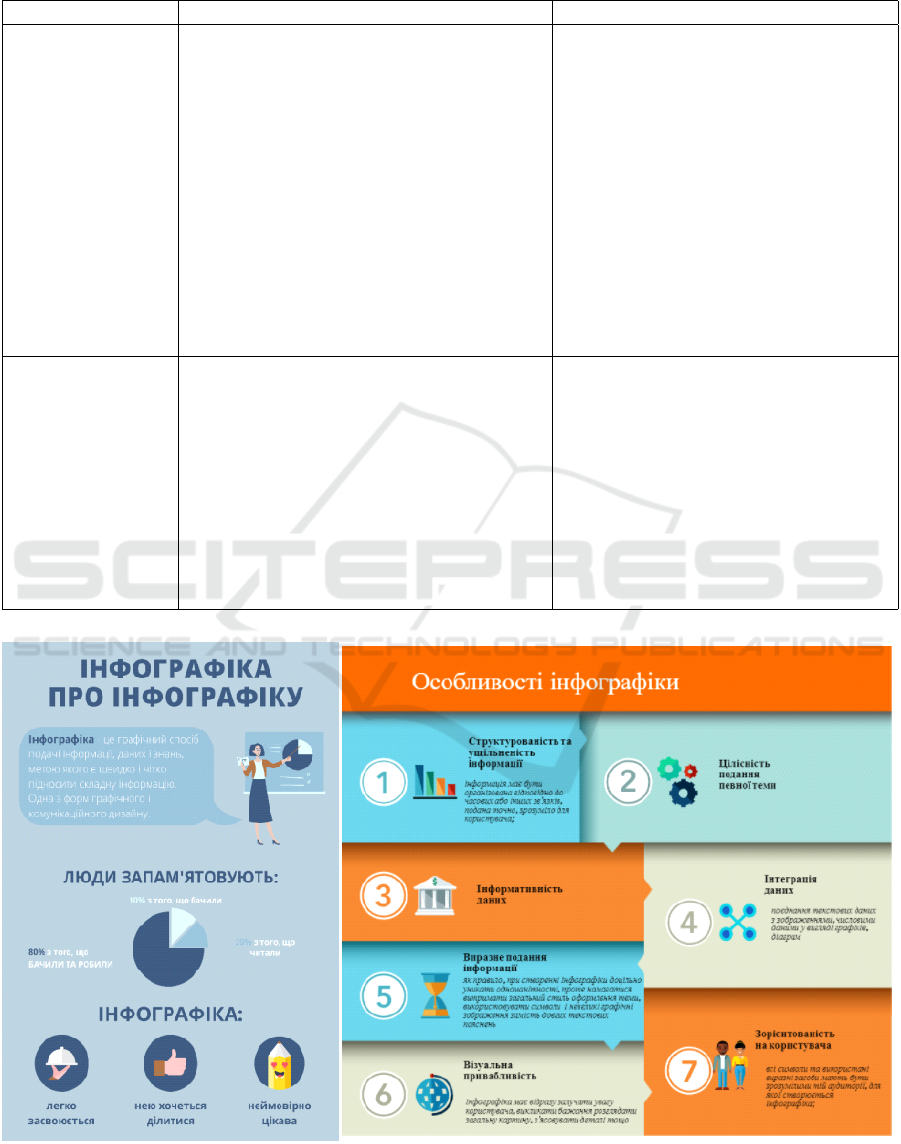
Table 1: Contents of the modules “Infographics in educational activities” and “Expert evaluation of the e-tools’ quality for
teaching students”.
Module Purpose and objectives Expected results
Infografics in educa-
tional activities
Purpose: to acquaint with the technology of
creating infographics for the educational pro-
cess
Tasks:
• highlight the specifics and types of info-
graphics;
• to reveal the features of preparation and
implementation of infographics for various
purposes;
• to get acquainted with the tools for creating
educational infographics.
Knowledge:
• essence and types of infographics;
• features of choosing the type of info-
graphic for the presentation of educa-
tional information;
• ways of structuring information.
Skills:
• select and structure information;
• use software to prepare materials;
• use tool environments to implement in-
fographics.
Expert evaluation of
the e-tools’ quality
for teaching students
Purpose: to acquaint with the technology of
expert evaluation of e-means.
Tasks:
• highlight the nature and types of testing of
e-learning tools;
• disclose the procedure for checking e-
means;
• to acquaint with the principles of profes-
sional verification of e-learning tools.
Knowledge:
• systems of requirements for e-learning
tools;
• essence and types of examination of e-
learning tools;
• quality criteria for e-learning tools;
Figure 2: Works of students G. Tsekhmistrova, I. Maistryuk.
AET 2020 - Symposium on Advances in Educational Technology
316
Table 2: Topics of training modules.
Topic Main content
Module “Infographics in educational activities”
Essence and types of in-
fographics. History of in-
fographic development
Concept of infographics. Types of infographics. Characteristics of types of infograph-
ics by the nature of visualization. Research and explanatory infographics. Features
of infographics as a means of learning. Historical information on the development of
infographics
Infographic design tech-
nology
Content of infographic design stages. Selection of educational material for presen-
tation in the form of infographics. Rules for designing headlines in infographics.
Requirements for educational infographics. Toolkit for designing infographics for
various functional purposes.
Module “Expert evaluation of the e-tools quality for teaching students”
Psychological and peda-
gogical demands for e-
learning tools
Psychological and pedagogical demands for all types of didactic tools – scientific, ac-
cessible, problematic, visual, educational awareness, systematic and consistent learn-
ing. Psychological and pedagogical demands that are additionally put forward to e-
learning tools – interactivity, multimedia, assistance system. Requirements to be met
by electronic means designed to teach students of different ages.
Ergonomic, technical and
health demands for the e-
resource.
The concept of ergonomics of the learning environment. Ergonomic demands for e-
learning tools (for general visual design; color characteristics; spatial arrangement
of objects; design of textual, numerical and symbolic information). Ways to ensure
health and technical demands in the e-means.
Pedagogical examination
of didactic e-resource
Content-scientific, methodical and design-ergonomic examination. Standardization of
e-teaching aids. The concept of e-means certification. Criteria and indicators of qual-
ity of e-learning tool. Application of the method of expert evaluations when choosing
the criteria for evaluating the quality of a didactic e-resource.
explanations, lines of heroes, etc.) which the student
should read from the computer screen, competently
design it taking into account the psychological and
physiological characteristics of the child. Here are
some examples of tasks:
1. Analyze the visual design of the proposed info-
graphics on:
• compliance of the general design of the info-
graphic with its content;
• emotions that can cause the design of the info-
graphic in the student;
• the presence of homogeneous or aggressive
fields, the feasibility of making changes;
• the number of objects that are currently in the
user’s field of view.
2. Formulate the rules of visual design of infograph-
ics, taking into account their psychological and
physiological features.
3. Design material on the topic “Addressing in
spreadsheets”, using the provided components.
Resize objects, number of slides, color scale,
background, etc. Explain the need for changes
made.
4. Using a color wheel, select for the specified colors
that are contrasting, analogous, making a contrast
triad.
5. Get acquainted with the essence of psychological
and pedagogical demands that must be met by in-
fographics. Determine how each demand is im-
plemented in the proposed examples.
6. Analyze the infographics. Determine whether dif-
ferent types of fonts are used, which headset and
skittle are selected. Determine the distance from
which the entire presentation content is clearly
visible.
During practical classes at University, students
learned to identify the criteria and indicators that were
essential for analyzing the quality of the author’s e-
tools, to analyze the compliance of professional and
own developments with the selected criteria. For this
purpose, the determination of the weighting factor of
each criterion by the method of “expert evaluations”
was organized (Orlov, 2001).
For this purpose, students identified a set of cri-
teria for later e-tool evaluation (they minded educa-
tional principles; correlation e-tool content with the
curriculum; interactivity, multimedia, assistance sys-
tem; ergonomic demands).
To determine the weighting factor of each crite-
rion, the students in academic group acted as experts
and determined individually the rank of each criterion
(from 1 to 4). The experimental group received the
data presented in table 5.
Training Teachers-to-Be to Create Infographics and Its Expert Evaluation
317
Figure 3: Student’s works of G. Tsekhmistrova, M. Korotetska.
Table 3: Table for task 4.
Name Color Sample Image Contrasting Color Analogous Colors Making contrast triad
Green
Red
Purple
Light green
Next, the concordance coefficient was calculated,
which indicated the consistency degree of all stu-
dents’ opinion as “experts”. In the experimental
group the value was W = 0.57, indicating the aver-
age degree of consistency in expert evaluations. It
should be noted that in the control group, after cal-
culating the concordation coefficient, the table of cri-
terion rank needed coordinating and editing.
On the basis of the table of criterion rank, the sig-
nificance of each criterion was calculated. For that
we found the values that were inverse to the rank sum
for each criterion, and then determined the required
weighting factors. According to the experts, the im-
portance of each criterion was: correlation e-tool con-
tent with the curriculum – 0.35; structured, concise-
ness – 0.31; adherence to pedagogical principles –
0.19; adherence to ergonomic demands – 0.15.
The students chose one e-tool for self-evaluations.
Every student evaluated the criterion degree in the
e-tool and expressed it in points from 0 to 3. For
example, 3 points for high level, 2 points for suffi-
cient level, 1 point for medium level, 0 point for low
level. After that, every student calculated the e-tool
evaluation, taking into account weighting factor of
each criterion (by the formula Φ = V
k
× P
k
, where
V
k
– weighting factor of each criterion on the basis
of expert evaluations, P
k
– the demonstration degree
of each criterion).
Consequently, as a result of the e-tool expert eval-
uation, every student gave it a general score: 2.51–3.0
for high level, 1.51–2.50 for sufficient level, 0.76
–1.50 for medium level, and 0.0 – 0.75 for low level.
AET 2020 - Symposium on Advances in Educational Technology
318

Table 4: Table for task 6.
Presentation name Age / Grade Headset Font Font height, letter height at
demonstration through projector
Table 5: Table of ranks of criteria for e-tool evaluation.
Criterion
Expert
1 2 3 4 5 6 7 8 9 10 11 12 13 14 15
correlation e-tool content with the curriculum (x
1
) 1 1 1 1 1 2 3 1 1 1 3 1 3 3 1
structured, conciseness (x
2
) 2 2 2 2 2 1 1 2 4 2 1 2 1 1 2
adherence to pedagogical principles (x
3
) 3 4 3 3 3 3 2 4 2 4 2 4 2 2 3
adherence to ergonomic demands (x
4
) 4 3 4 4 4 4 4 3 3 3 4 3 4 4 4
According to the results, students did not always
come to the same consensus about the e-tool quality.
It indicated different experience levels of using such
e-tools, subjectivity in expert evaluation. This indi-
cates a different level of experience in the use of such
tools in professional activities, subjectivity in expert
evaluation.
At the same time, such activities allowed teachers-
to-be to pay more attention to suggestions for improv-
ing e-tools, before giving their own evaluation about
the e-tool quality.
In the final stage of the experiment, we formulated
the indicators to determine the level of formation of
skills to create infographics for educational purposes
to carry out a preliminary assessment of its quality:
• awareness of the peculiarities of the use of info-
graphics as a didactic tool;
• ability to structure educational material for pre-
sentation in the form of infographics and to carry
out preliminary training by means of information
and communication technologies;
• ability to use tools to create infographics;
• knowledge of the system of demands for e-
learning tools (including infographics) for stu-
dents;
• ability to use the method of expert evaluation to
rank certain indicators;
• ability to assess compliance with the system of de-
mands for e-learning tools for students.
The results of the experiment about the effective-
ness of teaching students to e-tool expert evaluation
based on the indicators presented in table 6. In the ta-
ble, the control group is marked with letter C, and the
experimental one is marked with letter E.
So, the quantitative data show that there have been
significant changes in the experimental group as for
teaching students for e-tool expert evaluation in com-
parison with the previous experiment stage: the dif-
ference between the control and experimental groups
is quite noticeable in almost all indicators. For exam-
ple, in the control groups the high and sufficient lev-
els as for ability to use tools for creating infograph-
ics showed 23.8% and 16.7% of students, in the ex-
perimental – 43.3% and 31.7%. A significant differ-
ence was also found between the groups in the level
of awareness of the peculiarities of the use of info-
graphics as a didactic tool; formation of skills to use
the method of expert evaluations to rank certain indi-
cators. The obtained results were evaluated by non-
parametric methods of mathematical statistics, in par-
ticular, by Pearson’s criterion: the obtained values
(27.8; 11.0; 12.5; 9.3; 23.8; 22.9) are significantly
higher than the critical value, which indicates the ef-
fectiveness of the measures to develop students’ abil-
ity to expertly evaluate e-learning tools.
5 DISCUSSION
No doubt, that a modern teacher should be trained to
work in a new digital society, in the face of high ex-
pectations regarding teachers’ competences relating
to the development of e-tools that promote effective
schooling. As for expert evaluations by students, any
teacher, in our opinion, should be able to choose and
develop their own evaluation methods that are consis-
tent with lesson aims and content, to use evaluation
data to improve teaching, and to motivate children’s
learning.
However, it should be noted some difficulties as-
sociated with training teachers-to-be to create info-
graphics for the educational process:
• the need for creative abilities of students, the abil-
ity to creatively approach the presentation of in-
formation, the use of pictorial means, etc. – such
skills can not be formed during the training mod-
ule;
• the need to comprehend a significant amount of
information to select the most relevant, structured
Training Teachers-to-Be to Create Infographics and Its Expert Evaluation
319

Table 6: The results of skills’ formation of expert evaluation e-learning tools (percent).
Indicator Group Low
level
Medium
level
Sufficient
level
High
level
awareness of the peculiarities of using infographics as a
didactic tool
C 42.9 28.6 16.7 11.9
E 5.0 20.0 35.0 40.0
ability to structure educational material and carry out its
preliminary preparation
C 26.2 31.0 23.8 19.0
E 10.0 15.0 45.0 30.0
ability to use tools to create infographics
C 23.8 35.7 23.8 16.7
E 8.3 16.7 43.3 31.7
knowledge of the system of demands for e-learning tools
(including infographics) for students
C 19.0 42.9 26.2 11.9
E 6.7 26.7 38.3 28.3
ability to use the method of expert evaluation to rank certain
indicators
C 42.9 33.3 23.8 0.0
E 10.0 16.7 33.3 40.0
ability to assess compliance with the system of demands for
e-learning tools for students
C 19.0 28.6 42.9 9.5
E 3.3 6.7 48.3 41.7
presentation as a whole;
• the need to have a sufficiently wide range of soft-
ware for universal and special purposes for the de-
sign of educational information;
• practical lack of localized versions of tools fo-
cused on creating infographics, which requires
students to have sufficiently developed skills of
using information and communication technolo-
gies for the preparation of e- materials.
6 CONCLUSIONS
After the development and experimental implemen-
tation of the prepared training modules, we came to
the conclusion that the development of educational
infographics and its expert evaluation is a complex
process that requires expanding existing psycholog-
ical, pedagogical and methodological knowledge and
skills, as well as new ones. During the experiment,
students learned the features of creating infograph-
ics, its types, tools for its creation. The experimental
test was successful, as it is confirmed by the methods
of mathematical statistics, so we can recommend the
proposed methodological support for student learn-
ing.
REFERENCES
Alkhattabi, M., Neagu, D., and Cullen, A. (2011). As-
sessing information quality of e-learning systems: A
web mining approach. Computers in Human Behav-
ior, 27(2):862–873.
Atanasova, I. (2019). A university knowledge management
tool for the evaluation of the efficiency and quality
of learning resources in distance e-learning. Interna-
tional Journal of Knowledge Management, 15(4):38–
55.
Bartlett, F. C. (1927). The relevance of visual imagery to the
process of thinking. III. British Journal of Psychology.
General Section, 18(1):23–29.
Biloshapka, N. M. (2007). On the results of a pedagogical
experiment using visualization technologies in the ed-
ucational process. Current issues of modern computer
science, 5:185–188.
Bilousova, L. I. and Zhyteneva, N. V. (2014). Didac-
tic aspects using technology of vizualization in ed-
ucational process of secondary school. Information
Technologies and Learning Tools, 40(2):1–13. https:
//journal.iitta.gov.ua/index.php/itlt/article/view/1017.
Briantseva, H. (2006). Vizualization of the initial
material from computer graphics for addi-
tional associative images. Osvita Donbasu,
6. http://alma-mater.lnpu.edu.ua/magazines/
osvita-donbas/Osvita Donbasu 2011 6.pdf.
Briantseva, H. and Briantsev, O. (2019). Acmeological
approach in training teachers to visualize educa-
tional information in the process of forming the
professional competence of bachelors in terms of
professional and practical training. Information tech-
nologies in education and science, 11:57–61. https:
//www.researchgate.net/publication/339208605
Akmeologicnij pidhid u pidgotovci uciteliv
do vizualizacii navcalnoi informacii v procesi
formuvanna profesijnoi kompetentnosti bakalavriv
v umovah profesijno-prakticnoi pidgotovki.
Bykov, V., Dovgiallo, A., and Kommers, P. A. M. (2001).
Theoretical backgrounds of educational and training
technology. International Journal of Continuing En-
gineering Education and Life-Long Learning, 11(4-
6):412–441.
Choshanov, M. A. (2013). E-didactics: A new look
at learning theory in the digital age. Educa-
tional Technology and Society, 16(3):673–685.
http://web.archive.org/web/20170828192622/http:
//ifets.ieee.org/russian/depository/v16 i3/pdf/18.pdf.
Davydov, V. V. (1988). The concept of theoretical general-
AET 2020 - Symposium on Advances in Educational Technology
320

ization and problems of educational psychology. Stud-
ies in Soviet Thought, 36(3):169–202.
Elumalai, K. V., Sankar, J. P., Kalaichelvi, R., John, J. A.,
Menon, N., Alqahtani, M. S. M., and Abumelha,
M. A. (2019). Factors affecting the quality of e-
learning during the Covid-19 pandemic from the per-
spective of higher education students. Journal of In-
formation Technology Education: Research, 19:731–
753.
Erdniev, P. M. and Erdniev, B. P. (1976). The systematiza-
tion of knowledge and intensification of the learning
unit. Soviet Education, 18(5):83–97.
Ginns, P. and Ellis, R. A. (2009). Evaluating the quality of
e-learning at the degree level in the student experience
of blended learning. British Journal of Educational
Technology, 40(4):652–663.
Grushevskaya, V. Y. (2016). Methods of teaching the devel-
opment of infographics in a pedagogical university.
Pedagogical education in Russia, 7:673–685.
https://cyberleninka.ru/article/n/metodika-
obucheniya-razrabotke-infografiki-v-
pedagogicheskom-vuze.
Hay, D. B., Kehoe, C., Miquel, M. E., Hatzipana-
gos, S., Kinchin, I. M., Keevil, S. F., and Lygo-
Baker, S. (2008). Measuring the quality of e-
learning. British Journal of Educational Technology,
39(6):1037–1056.
Holub, O., Moiseienko, M., and Moiseienko, N. (2020).
Fluid flow modelling in Houdini. CEUR Workshop
Proceedings, 2732:909–917.
Iryanti, E. and Pandiya, R. (2017). Evaluating the quality of
e-learning using consistent fuzzy preference relations
method. In Proceedings of the 2016 6th International
Conference on System Engineering and Technology,
ICSET 2016, pages 61–66.
Ivanova, H. I., Lavrentieva, O. O., Eivas, L. F., Zenkovych,
I. O., and Uchitel, A. D. (2020). The students’ brain-
work intensification via the computer visualization
of study materials. CEUR Workshop Proceedings,
2643:185–209.
Kalmykova, Z. I. (1959). Dependence of knowledge as-
similation level on pupils’ activity in learning. Soviet
Education, 1(11):63–68.
Kazaine, I. (2017). Evaluating the quality of e-learning ma-
terial. Vide. Tehnologija. Resursi - Environment, Tech-
nology, Resources, 2:74–77.
Khalid, N. and Ziden, A. A. (2016). Investigating the qual-
ity of e-learning technology in relation to outcomes.
Social Sciences (Pakistan), 11(20):4882–4886.
Kravtsov, H. and Pulinets, A. (2020). Interactive aug-
mented reality technologies for model visualization in
the school textbook. CEUR Workshop Proceedings,
2732:918–933.
Leontiev, D. A., Osin, E. N., Fam, A. K., and Ovchin-
nikova, E. Y. (2020). How you choose is as
important as what you choose: Subjective quality
of choice predicts well-being and academic perfor-
mance. Current Psychology. https://doi.org/10.1007/
s12144-020-01124-1.
Little, B. (2003). “Six sigma” techniques improve the qual-
ity of e-learning. Industrial and Commercial Training,
35(3):104–108.
Lundqvist, K., Williams, S., and Baker, K. (2006). Eval-
uation of quality of e-learning environments. In
Proceedings of the European Conference on Games-
based Learning, volume 2006-January, pages 216–
223.
Lytvynova, S. G. (2013). To question of quality examina-
tion of electronic educational resources. Information
Technologies and Learning Tools, 34(2):21–27. https:
//journal.iitta.gov.ua/index.php/itlt/article/view/812.
Male, G. and Pattinson, C. (2011). Enhancing the qual-
ity of e-learning through mobile technology: A socio-
cultural and technology perspective towards quality e-
learning applications. Campus-Wide Information Sys-
tems, 28(5):331–344.
Manko, N. N. (2009). Cognitive visualization of didac-
tic objects in the activation of educational activi-
ties. Pedagogy and psychology. Proceedings of Altai
State University, 2. http://izvestia.asu.ru/2009/2/peda/
TheNewsOfASU-2009-2-peda-04.pdf.
Markovi
´
c, S. and Jovanovi
´
c, N. (2012). Learning style as a
factor which affects the quality of e-learning. Artificial
Intelligence Review, 38(4):303–312.
Marshall, S. (2012). Improving the quality of e-learning:
Lessons from the eMM. Journal of Computer Assisted
Learning, 28(1):65–78.
Mazorchuk, M. S., Vakulenko, T. S., Bychko, A. O.,
Kuzminska, O. H., and Prokhorov, O. V. (2020).
Cloud technologies and learning analytics: Web ap-
plication for PISA results analysis and visualization.
CEUR Workshop Proceedings, 2879:484–494.
Midak, L. Y., Kravets, I. V., Kuzyshyn, O. V., Baziuk,
L. V., and Buzhdyhan, K. V. (2021). Specifics of us-
ing image visualization within education of the up-
coming chemistry teachers with augmented reality
technology. Journal of Physics: Conference Series,
1840(1):012013.
Minsky, M. (2013). A framework for representing knowl-
edge. In Readings in Cognitive Science: A Perspec-
tive from Psychology and Artificial Intelligence, pages
156–289.
Movchan, V. I. (2017). Preparation of future primary
school teachers for the formation of students’ visual
thinking by means of infographics. Bulletin of the
Cherkasy Bohdan Khmelnytsky National University.
Series ‘Pedagogical Sciences’, 11.
Olefirenko, N. V. (2015). Theoretical and methodolog-
ical foundations for training primary school teach-
ers to design e-learning resources. The thesis for
doctor degree in pedagogic, speciality 13.00.04 –
the theory and methods of professional education.,
H.S. Skovoroda Kharkiv National Pedagogical Uni-
versity. https://kafinfo.org.ua/images/stories/2018-
2019/autoref onv.pdf.
Olefirenko, N. V., Kostikova, I. I., Ponomarova, N. O.,
Bilousova, L. I., and Pikilnyak, A. V. (2019). E-
learning resources for successful math teaching to
pupils of primary school. CEUR Workshop Proceed-
ings, 2433:443–458.
Training Teachers-to-Be to Create Infographics and Its Expert Evaluation
321

Orlov, A. I. (2001). Expert assessments. IVSTE, Moscow,
2nd edition.
Polyakova, E. V. (2012). Visualization as an effective
method of presenting information in the mind of a
person. Almanac of modern science and education.,
(4(59)):180–181.
Ponomareva, N. O. (2015). Studying the basics of creating
infographics by future teachers of computer science.
Proceedings of the international conference “New In-
formation Technologies in Education for All”, page
116–119.
Pons, D., Hilera, J. R., Fernandez, L., and Pages, C. (2015).
Managing the quality of e-learning resources in repos-
itories. Computer Applications in Engineering Educa-
tion, 23(4):477–488.
Raputo, A. G. (2010). Visualization as an integral part of
the teaching process. International Journal of Exper-
imental Education, (5):138–141.
Robert, I., Martirosyan, L., Gerova, N., Kastornova, V.,
Mukhametzyanov, I., and Dimova, A. (2016). Im-
plementation of the internet for educational purposes.
Smart Innovation, Systems and Technologies, 59:573–
583.
Safina, G. R. (2010). Operations management. Kazan state
technological university, Kazan.
Stasiecka, A., Plodzien, J., and Stemposz, E. (2006). Mea-
sures for estimating the quality of e-learning materials
in the didactic aspect. In WEBIST 2006 - 2nd Inter-
national Conference on Web Information Systems and
Technologies, Proceedings, volume SEBEG, pages
204–212.
Stasiecka, A., Stemposz, E., and Dabrowski, W. (2005). Di-
dactic aspects influence on quality of e-learning ma-
terials. WSEAS Transactions on Information Science
and Applications, 2(7):1002–1008.
Vasconcelos, P., Sucupira Furtado, E., Pinheiro, P., and Fur-
tado, L. (2020). Multidisciplinary criteria for the qual-
ity of e-learning services design. Computers in Hu-
man Behavior, 107.
Verbitsky, A. A. and Kalashnikov, V. G. (2015). Contextual
approach in psychology. Psikhologicheskii Zhurnal,
36(3):5–14.
Wu, H.-Y. and Lin, H.-Y. (2012). A hybrid approach to
develop an analytical model for enhancing the ser-
vice quality of e-learning. Computers and Education,
58(4):1318–1338.
Yang, S. J. H., Chen, I. Y. L., Kinshuk, and Chen, N.-S.
(2007). Enhancing the quality of e-learning in virtual
learning communities by finding quality learning con-
tent and trustworthy collaborators. Educational Tech-
nology and Society, 10(2):84–95.
Zhaldak, M. I., Franchuk, V. M., and Franchuk, N. P.
(2021). Some applications of cloud technologies in
mathematical calculations. Journal of Physics: Con-
ference Series, 1840(1):012001.
AET 2020 - Symposium on Advances in Educational Technology
322
