
Application of R Programming Language in Learning Statistics
Liliia V. Pavlenko
1 a
, Maksym P. Pavlenko
1 b
, Vitalii H. Khomenko
1 c
and Vitaliy I. Mezhuyev
2 d
1
Berdyansk State Pedagogical University, 4 Schmidta Str., Berdyansk, 71100, Ukraine
2
FH JOANNEUM University of Applied Sciences, Institute of Industrial Management, Werk-VI-Strasse 46, 8605
Kapfenberg, Austria
Keywords:
R Programming Language, Statistics, Statistical Data Analysis, Teaching Statistics.
Abstract:
The study examines the problem of teaching statistics to future programmers. The theoretical content of
teaching statistics has undergone significant development and requires a change in its focus on the practical
field, even while studying at a higher education institution. It is determined that the improvement of teaching
statistics to students requires moving from theoretical teaching methods to the practical solution of applied
problems and shifting of emphasis from the process of statistical calculations to the analysis and results in-
terpretation. The research allowed establishing that the training of statistics of future programmers should be
based on the use of applied system of tasks developed with the help of real data sets obtained as a result of
statistical research. Such tasks allow increasing the educational motivation of students in comparison with
synthetic examples, which are usually used in the study of statistics. The research has analyzed the software
for statistical data analysis as well as identified features of its application in the learning process. It is offered
to use a specialized programming language R as the main learning tool.
1 INTRODUCTION
During the “information explosion” there is a problem
in the statistical education of the society. The study
of statistics is an important component of the educa-
tional programs for training specialists in the field of
IT. While teaching courses on statistics teachers face
a significant number of problems such as: different
levels of knowledge, low level of motivation, lack of
understanding by students of the necessity to study
statistics for application in the future profession (Zi-
effler et al., 2008).
There have been serious concerns about the future
of statistics as a discipline recently. Cox (Cox, 1997),
Moore (Moore, 1997), Smith and Staetsky (Smith and
Staetsky, 2007) raise many questions about the need
to improve the goals, content, methods and forms of
teaching statistics.
Many scientists have conducted researches that
have studied the problems of teaching statistics. Rec-
ommendations for teaching statistics in the educa-
tional institutions of various types are given in (Ben-
a
https://orcid.org/0000-0001-7823-7399
b
https://orcid.org/0000-0003-0091-696X
c
https://orcid.org/0000-0002-7361-2169
d
https://orcid.org/0000-0002-9335-6131
Zvi and Garfield, 2004; Biehler et al., 2018; Bishop
et al., 1996; Garfield and Ben-Zvi, 2008; Langrall
et al., 2017; Shaughnessy, 1992, 2007). In the stud-
ies (Garfield and Ben-Zvi, 2008; Watson et al., 2013)
it was offered to move from the theoretical learning to
the application of statistical methods in practice dur-
ing learning.
Nicholl (Nicholl, 2001) notes that over the past 50
years, the theoretical content of teaching statistics has
developed significantly, but this process has been un-
controlled, by introducing new concepts into the con-
tent. As a result, the content of teaching statistics as a
discipline has provided teachers with a large number
of theoretical concepts aimed at improving the the-
oretical training of students. All this does not con-
tribute to the development of students’ motivation and
interest to study statistics. Rumsey (Rumsey, 2002),
Gal and Garfield (Gal and Garfield, 1997) draw atten-
tion to the problems of teaching statistics, and propose
to change the training paradigm and direct its focus
on the practical field, even during training in higher
educational institutions.
Investments in education are seen as investments
in production, where human capital is created. The
World Economic Forum predicts that over the next
five years, there will be a nearly six-fold increase in
62
Pavlenko, L., Pavlenko, M., Khomenko, V. and Mezhuyev, V.
Application of R Programming Language in Learning Statistics.
DOI: 10.5220/0010928500003364
In Proceedings of the 1st Symposium on Advances in Educational Technology (AET 2020) - Volume 2, pages 62-72
ISBN: 978-989-758-558-6
Copyright
c
2022 by SCITEPRESS – Science and Technology Publications, Lda. All rights reserved

global demand for statistical data analysts.
According to the Modis survey (Modis, 2018),
97.44% of respondents (representatives of banks and
industry) consider data analysis as a prospect for suc-
cessful development in sales and marketing. How-
ever, the interest in interpreting the data is higher than
in the calculations. 42% of respondents complain
about the lack of qualified professionals who have
methods of statistic data analysis in the labor market.
55% of respondents say that it is difficult to find spe-
cialists who can calculate and interpret the results.
Every day in the world large amounts of various
data are generated, which are constantly increasing
(Khomenko et al., 2020). Therefore, the demand in
the labor market for data analysts and data researchers
is constantly growing. Varian (Varian, 2017) notes
that data analyst will become the most popular pro-
fession in the future.
Thus, improving the education of students in
statistics requires moving from the theoretical teach-
ing methods to the practical solution of applied prob-
lems and the shift of emphasis from the process of
statistical calculations to the analysis and results in-
terpretation.
To begin preparing an intellectually active, en-
riched with the knowledge and skills specialist, ed-
ucation must move from the reproductive to the inno-
vative learning. Innovative learning is a creative com-
bination of the traditional and new teaching methods,
their choice for each discipline, based on its theoret-
ical content and practical orientation (Kaminskaya,
2011). At the same time, it should be considered
that while teaching educational material to students,
it is important not only to form certain professional
competencies, but also to adjust them to today’s mod-
ern requirements. It means that the future specialists
must be able to express their thoughts and concepts
in words, understand the language of symbols, signs
and schemes. This is not just the ability to think cre-
atively, but also the ability to make extraordinary de-
cisions and actions.
To organize innovative training of statistics in ac-
cordance with modern requirements, it is advisable to
use special software for statistical data analysis. How-
ever, today there are specialized programming lan-
guages and environments that can be used to quickly
and efficiently analyze data, interpret results and pre-
pare conclusions as well as reports in various formats.
Thus, there is a contradiction between traditional
approaches to teaching statistics and society’s re-
quirements for the level of modern IT specialists
training in the field of statistical data analysis, as well
as between the theoretical orientation of the content
of statistics training and the need to train a special-
ist with applied tools and methods of statistical data
analysis.
The article aims to justify the use of R program-
ming language as a teaching method in learning statis-
tics.
2 RESULTS
The following main methods were used in the re-
search process: content analysis of scientific and me-
thodical literature, generalization and systematization
to clarify the state of the problem development; ques-
tionnaire of those getting higher education and initial
statistical processing of the obtained results to clar-
ify the current state of the researched problem; gen-
eralization of theoretical and practical data to justify
the introduction of innovative approaches to the study
of statistics by students based on the use of program-
ming language R.
The process of teaching statistics to the students
is associated with certain difficulties: the study ma-
terial in this course contains a large number of def-
initions and formulas. At the same time, students
need not only to reproduce them, but also to under-
stand the meaning and be able to apply in practice.
However, with the traditional organization of the ed-
ucational process, practical tasks are far from the real
economic, social and other processes that occur in real
life. The analyzed data are generalized and do not al-
low to fully form students’ understanding of the need
and expediency of studying this discipline and the op-
portunity to implement the acquired competencies in
their further professional activities.
Therefore, most students learn statistics in frag-
ments, and do not form systemic knowledge as a re-
sult. In addition, mainly verbal presentation of infor-
mation increases fatigue, resulting reducing produc-
tivity of the learning process (Fitsula, 2000).
The number of statistically educated people is de-
creasing. It is difficult for potential employers to
find a specialist who will be able to perform statis-
tical calculations without prior training and explana-
tion. Therefore, there is a need to improve the content
of teaching this discipline through the introduction of
practical tasks.
Improving the content of the statistics course re-
quires the introduction of changes in the methods and
means of its teaching using innovative technologies.
Scientific innovations that promote scientific
progress cover all areas of knowledge. There are
socio-economic, organizational and managerial, tech-
nical and technological innovations. One of the types
of social innovations is pedagogical innovation.
Application of R Programming Language in Learning Statistics
63

Pedagogical innovation is an innovation in the
field of pedagogy, purposeful progressive changes
that make stable elements (innovations) in the educa-
tional environment that improve the characteristics of
both – its individual components and the educational
system on the whole (Rapatsevych, 2006).
Pedagogical innovations can be carried out both
with the application of the educational system’s
own resources (intensive way of development) and
with the involvement of additional capacities (invest-
ments) – new means, equipment, technologies, capital
investments, etc. (extensive way of development).
Kazakov (Kazakov, 2006) notes that the combi-
nation of intensive and extensive ways of pedagogi-
cal systems development allows to carry out so-called
“integrated innovations”, which are built at the junc-
tion of various, multilevel pedagogical subsystems
and their components.
The main ways and objects of innovative transfor-
mations in the teaching of statistics are:
• making concepts and strategies for the develop-
ment of statistical education (Tishkovskaya and
Lancaster, 2012);
• updating the content of statistics training;
• change and development of new learning tech-
nologies;
• improving the training of IT specialists in the field
of statistical data analysis;
• designing new models of the educational process
for teaching statistics;
• improving the monitoring of the educational pro-
cess and student learning;
• new generation electronic teaching aids develop-
ment.
Innovation can take place at different levels. The
highest level includes innovations that affect the entire
pedagogical system.
Kulinenko (Kulinenko, 2013) notes that while or-
ganizing the innovation, it should be considered that:
• innovative ideas must be clear, convincing and ad-
equate to the real educational needs of man and
society, they must be transformed into specific
goals, objectives and technologies;
• innovation activity should be morally and materi-
ally stimulated, legal support of innovation activ-
ity is necessary;
• not only results are important in pedagogical ac-
tivity, but also ways, means, methods of their
achievement.
The current problems of teaching statistics in
modern higher educational institutions include the re-
view of experience associated with the intensification
of learning. One of the main teacher’s tasks is to teach
students to obtain the necessary information indepen-
dently, to teach them to consciously process the ob-
tained information (Pavlenko and Pavlenko, 2021). In
order for them to be able to study the teaching mate-
rials on their own, the materials need to be designed
primarily for students and not for teachers.
Possibilities of “Statistics” discipline for experts
in the field of IT consists first of all of that know-
ing mathematical language and modeling that will al-
low the student to be better guided in forecasting of
economic, social, technical and other processes; sec-
ondly, that statistics by its internal nature has rich op-
portunities for the formation of students algorithmic
thinking.
Future IT professionals must not only know the
theoretical foundations, but also be able to apply the
means of automating statistical analysis. Such tools
include specialized statistical software packages and
programming languages.
Statistical packages on the basis of functionality
can be divided into 3 main groups.
1. Universal statistical packages Statistica, SPSS,
Statgraphics, STATA, Stadia, SYSTAT, S-PLUS
and MS Excel. These packages are not targeted at
a specific subject area and can be used to analyze
data from different industries. Typically, they of-
fer a wide range of statistical methods and have a
relatively simple interface.
It is recommended to work with such packages for
starter users who have only basic knowledge in
the field of statistics, as well as experienced users
in the initial stages of working with data, when
statistical methods that will be used to address a
particular issue are not clearly defined yet. The
versatility of the universal package allows hold-
ing a pilot analysis of different data types using a
wide range of statistical methods. The vast major-
ity of existing universal packages has much com-
mon functionality and is similar in the composi-
tion of the built-in statistical procedures.
2. Professional statistical packages such as SAS or
BMDP. Professional packages, in the contrast to
the universal ones, allow you to work with ex-
tremely large amounts of data, apply highly spe-
cialized methods of analysis and create your own
data processing system. As a rule, such packages
are complex and should not be used in the educa-
tional process.
3. Specialized statistical packages BioStat, Datas-
AET 2020 - Symposium on Advances in Educational Technology
64

tream, Datascope, etc. were designed for statis-
tical analysis in specific areas of activity, which
use special methods of statistical analysis, usually
not presented in the universal packages.
Specialized packages allow analysis using a lim-
ited number of specialized statistical methods or are
used in a specialized subject area. As a rule, such
statistical packages are handled by specialists who
are well acquainted with data analysis methods in the
field to which the package is focused. For example,
the BioStat statistical package was created to analyze
data in the field of biology and medicine.
Most of the existing statistical packages have a
flexible modular structure that can be supplemented
and expanded owing to the custom modules that are
optionally purchased or freely available on the Inter-
net. Such flexibility allows you to adapt packages to
the needs of a particular user.
Statistical packages are just the tools for an experi-
enced professional. If the specialist does not have suf-
ficient knowledge and competencies, then, even the
most advanced software product will not allow hold-
ing quality data analysis. However, the wrong soft-
ware, which does not contain the required set of sta-
tistical procedures, can make the work of even an ex-
perienced specialist more difficult.
Therefore, during the training of IT specialists it
is necessary to acquaint those who get higher educa-
tion with the available statistical packages and their
characteristics, but the application of specialized pro-
gramming languages is closer and more understand-
able for the students while conducting statistical data
analysis.
For statistical data analysis it is possible and ap-
propriate to use R and Python programming lan-
guages.
We will consider the features of the programming
language R. The language R is a powerful high-level
object-oriented programming language and environ-
ment for statistical calculations and visualization of
source and calculation data, which allows you to solve
many problems in the field of data processing. It’s a
free open source program under GNU GPL designed
to run common operating systems (Windows, macOS,
Linux).
Tens of thousands of specialized modules and util-
ities have been developed for this language. One of
the most important features of the programming lan-
guage R is the efficient implementation of vector op-
erations, which allows the application of compact no-
tation while processing large amounts of data. All this
makes R an effective tool for obtaining useful infor-
mation from large amounts of various statistics, in-
cluding Big Data.
The R language is a convenient and effective tool
for teaching statistical analysis, data processing and
visualization.
It is also possible to use the Python program-
ming language in the field of data analysis and in-
teractive research calculations with results visualiza-
tion. Python is an open source object-oriented pro-
gramming language. The relatively recent advent of
improved libraries for Python (primarily pandas) has
made it a serious competitor to the R language for sta-
tistical data analysis. Combining with the benefits of
Python as a universal programming language makes
it an excellent choice for creating data processing ap-
plications.
So, the use of a specialized programming lan-
guage as a learning tool contributes to the develop-
ment of statistical data analysis skills as well as the
development of algorithmic thinking of future IT pro-
fessionals.
In order to study the relevance of the problem
of scientific research, a ascertaining experiment was
conducted among students of IT specialties. The is-
sues that allow finding out the opinion of higher edu-
cation students on the problem of improving the meth-
ods of teaching statistics to future IT professionals
were studied.
The results of the ascertaining experiment are pre-
sented in percentages and indicate the number of pos-
itive answers to the questions. The survey was orga-
nized using GoogleForms. 83 students majoring in
015 Professional Education (Digital Technology) and
015 Professional Education (Computer Technology)
took part in ascertaining experiment.
2.1 Declared Interest of Students in
Studying the Course of Statistics
In this block students were asked two questions. You
can see the results of the answers to the first question
of the survey in figure 1. The analysis of answers
allows establishing the level of awareness of students
in the demand for specialists in the labor market who
know how to analyze data.
Figure 1: Results of answers to the question regarding stu-
dents’ awareness in the demand for the specialists on data
analysis in the labor market.
Analysis of students’ answers allows us to con-
clude that the majority of respondents, 42.17% be-
Application of R Programming Language in Learning Statistics
65
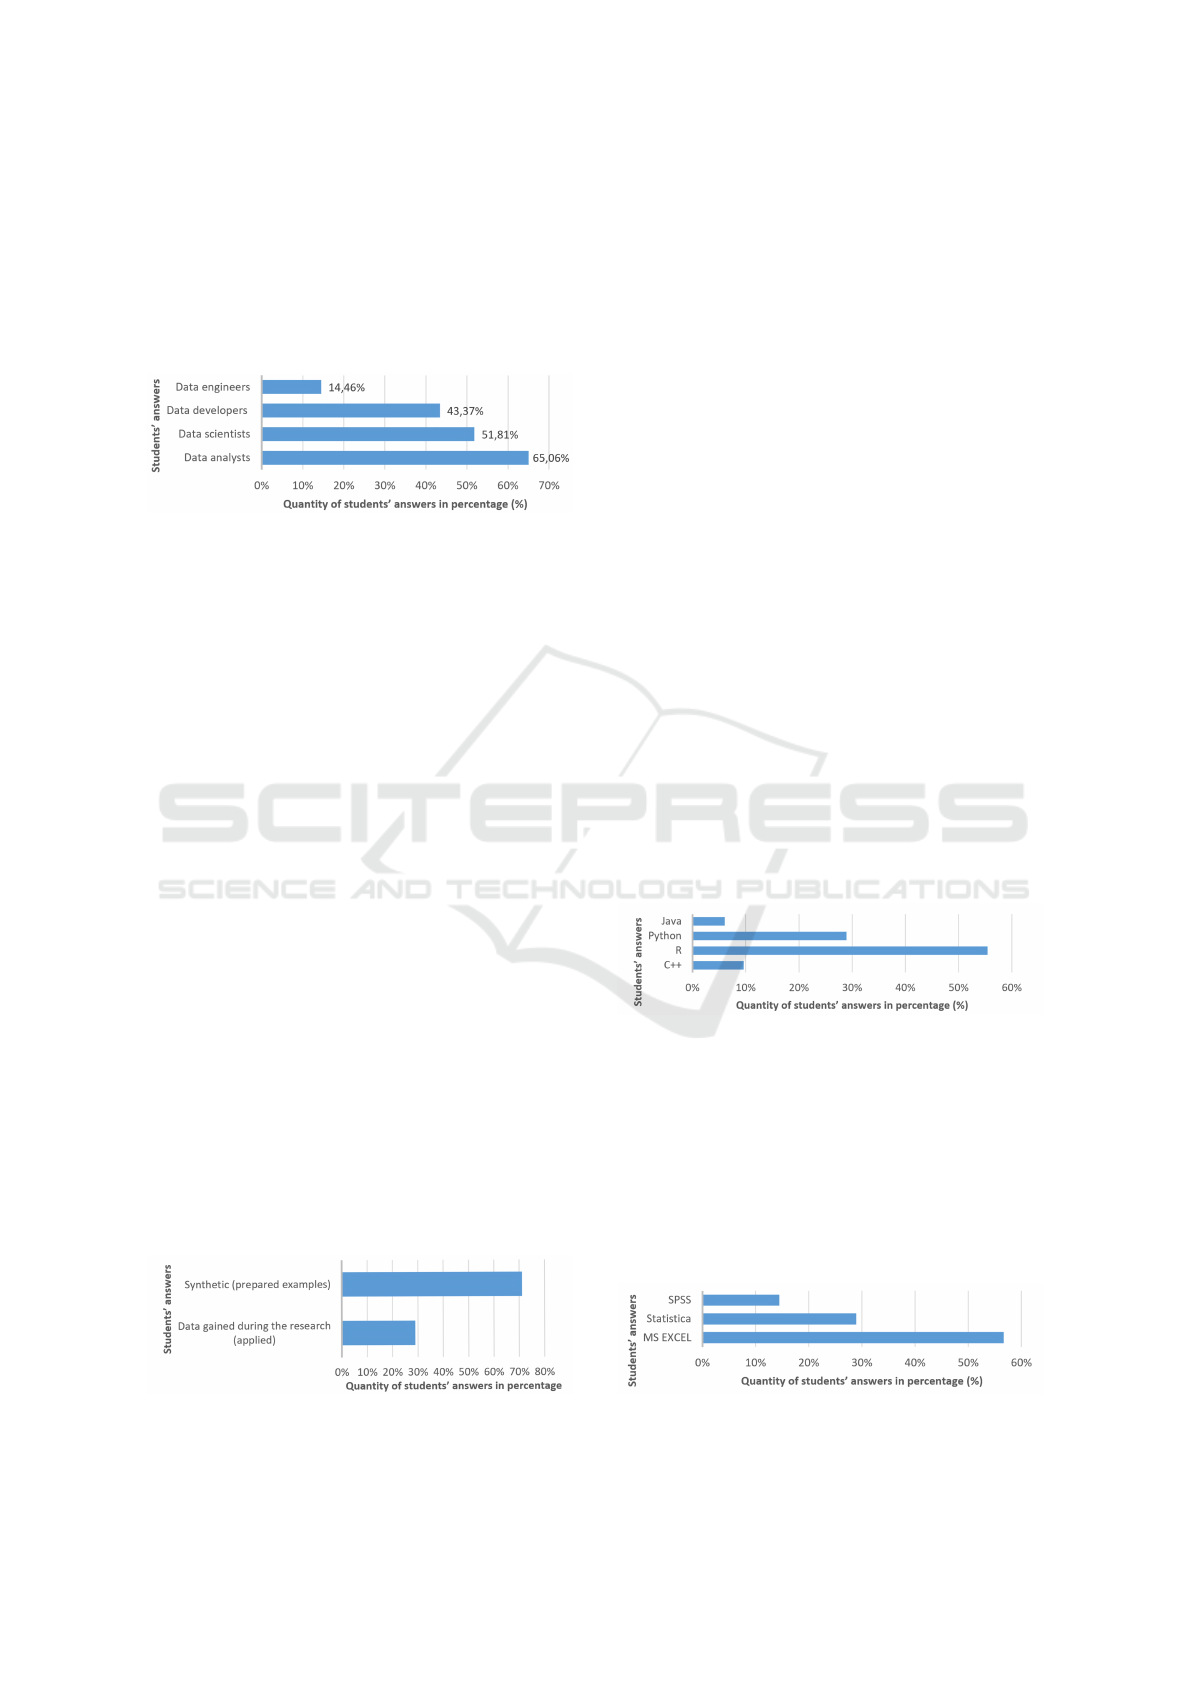
lieve that a data analysis specialist is in demand in the
labor market. This confirms the relevance and need to
study the course of statistics for IT professionals.
The second question clarified which specialties in
data analysis students consider the most relevant to-
day. The results of the student survey are shown in
figure 2.
Figure 2: The results of questionnaire regarding students’
awareness about modern professions on data analysis in the
labor market.
The most famous profession among the future stu-
dents programmers is the profession of data analysts
(65.06%), in second place is the profession of data
scientists (51.81%). These professions are known
to more than 50% of students, which indicates their
awareness and interest in this field.
So, based on the results of studying the answers to
the questions of this block, we can draw the follow-
ing conclusion. Training statistics of future IT pro-
fessionals is relevant, because students are aware of
the existence of professions in the field of data analy-
sis and believe that they will need statistics in future
professional activities.
2.2 Students’ Opinion about the Need to
Fill the Content with Tasks of an
Applied Nature
Students were asked to answer open-ended questions:
“Which subject area data analysis you are interested
conducting in?” The students’ answers showed that
the most popular data for processing are data from
sociology, medicine, engineering, economics and bi-
ology.
Also, the idea of what data students are interested
in working with in practice was studied. The results
of answers to the questions are shown in figure 3.
Figure 3: Students’ opinion on data origin for practical
tasks.
Among the surveyed respondents, 71.08% believe
that data obtained as a result of practical research and
having an applied nature are most attractive for them.
This indicates the need to develop practical and labo-
ratory work based on real data obtained from statisti-
cal studies.
2.3 Students’ Interest in using
Programming Languages and
Software for Statistical Data
Analysis
The purpose of the third block of questions was to
study the opinion of respondents about the need and
feasibility of using software and programming lan-
guages for statistical data analysis.
Students were asked the following questions: “Do
you know programming languages with which it
is possible to perform statistical data analysis (en-
ter)?”, “Which software product interface is more
user friendly for you?”, “Are you more interested in
data analysis using special software or using a pro-
gramming language?”
According to the first question, the opinions of the
respondents were divided as follows: 55.42% indi-
cated the programming language R, 28.92% indicated
the Python programming language. Programming
languages such as C++ (9.64%) and Java (6.02%)
were also indicated (figure 4).
Figure 4: Respondents’ answers to the question on conve-
nience of program packages interface.
The obtained results allow us to state that the R
language is the best known as a mean of statistical
data analysis. So, we will use this programming lan-
guage to solve application problems.
In choosing the convenience of the software
package interface, respondents preferred MS Excel
(56.63%), followed by Statistica software package
(28.92%), followed by SPSS (14.46%) (figure 5).
Figure 5: Choosing program packages for statistical data
analysis.
AET 2020 - Symposium on Advances in Educational Technology
66

So, the students will be asked to use MS Excel and
Statistica for practical calculations.
According to the results of students’ answers to
the third question of this block, the programming lan-
guage (57.83%) was chosen by the students as the
main tool for organizing the training of statistical data
analysis (figure 6).
Figure 6: Respondents’ answers regarding choosing the
mean of solving the tasks of statistical data analysis.
So, students in the class will be asked to use the
programming language R as the main tool for practi-
cal calculations. MS Excel and Statistica will be used
as aids in statistical analysis.
3 USING APPLIED TASKS FOR
TEACHING STATISTICS
Taking into account and summarizing the results of
the study, in our opinion, it is advisable to build the
content and structure of the course considering the
wishes of students. In practical classes, tasks that are
of a real applied nature and based on real statistics
should be considered. One of the main teaching meth-
ods should be a practical method of learning based on
programming. The means of statistical data analysis
in practical classes can be both software tools for data
analysis (MS Excel and Statistica) and the language
and programming environment R.
A system of tasks has been developed for the
course. Let’s consider an example for training of the
statistical analysis in the R environment. For carrying
out the analysis we will take data from the website
https://abit-poisk.org.ua, namely data concerning en-
trants for 2017. This site contains large amounts of
data, for our example we will take only entrants who
entered the Faculty of Physical and Mathematical
Computer and Technological Education of Berdyansk
State Pedagogical University in the specialty “Profes-
sional Education (Computer Technology)” and “Pro-
fessional Education)”, the level of “bachelor”.
A total of 31 applications were submitted for these
specialties. We will analyze these data, using descrip-
tive statistics in R and present the results using the
most common graphs in R when analyzing this data.
Step 1. We set the name, specialty, id, total
score of the external evaluation, status (budget /
contract), then enter the data into the table. We will
set the value in the form of vectors with the command
c(‘‘vector_value1’’,‘‘vector_value2’’,...).
We build the table from the received vectors by means
of the command > studentdata. Commands for a
table creation with the information about applicants:
> last_name <-c(’’Shvachko’’, ‘‘Dybiaga’’,
‘‘Kartashov’’, ‘‘Sytosenko’’,‘‘Filipenko’’,
‘‘Klimenko’’, ‘‘Veretelnik’’, ‘‘Diakov’’,
‘‘Salionov’’, ‘‘Bagnuk’’, ‘‘Kombarov’’,
‘‘Baranovsky’’, ‘‘Kiseliov’’, ‘‘Sakun’’,
‘‘Bova’’, ‘‘Potapova’’, ‘‘Kobzar’’,
‘‘Sementsov’’, ‘‘Cybulka’’, ‘‘Teplov’’,
‘‘Mitushkin’’, ‘‘Kartinik’’, ‘‘Gavrylenko’’,
‘‘Trotsenko’’, ‘‘Panchukov’’, ‘‘Kyslynsky’’,
‘‘Sagirov’’, ‘‘Korobov’’, ‘‘Shatalina’’,
‘‘Tichovod’’, ‘‘Popov’’)
> specialty <-c(1,1,1,1,1,1,1,1,1,1,1,1,
1,1,1,1,1,1,1,1,1,1,1,1,1,1,2,2,2,2,2)
> id <-c(1,2,3,4,5,6,7,8,9,10,11,12,13,14,
15,16,17,18,19,20,21,22,23,24,25,26,27,28,
29,30,31)
> rating <-c(186,184,180,179,173,173,170,
168,167,166,163,162,160,156,148,145,145,
142,142,140,140,139,135,131,129,123,147,
146,140,136,128)
> status <-c(1,1,1,1,1,1,1,1,1,1,1,1,0,0,0,
0,0,0,0,0,0,0,0,0,0,0,1,1,1,1,0)
> studentdata <- data.frame(id, last_name,
rating, status)
> studentdata
id last_name rating status
1 1 Shvachko 186 1
2 2 Dybiaga 184 1
3 3 Kartashov 180 1
4 4 Sytosenko 179 1
5 5 Filipenko 173 1
6 6 Klimenko 173 1
7 7 Veretelnik 170 1
8 8 Diakov 168 1
9 9 Salionov 167 1
10 10 Bagnuk 166 1
11 11 Kombarov 163 1
12 12 Baranovsky 162 1
13 13 Kiseliov 160 0
14 14 Sakun 156 0
15 15 Bova 148 0
16 16 Potapova 145 0
17 17 Kobzar 145 0
18 18 Sementsov 142 0
19 19 Cybulka 142 0
20 20 Teplov 140 0
21 21 Mitushkin 140 0
22 22 Kartinik 139 0
23 23 Gavrylenko 135 0
24 24 Trotsenko 131 0
25 25 Panchukov 129 0
26 26 Kyslynsky 123 0
27 27 Sagirov 147 1
28 28 Korobov 146 1
29 29 Shatalina 140 1
Application of R Programming Language in Learning Statistics
67
30 30 Tichovod 136 1
31 31 Popov 128 0
Step 2. We will calculate the main statistical val-
ues: average, median, standard deviation, minimum
and maximum value. The results of the main statisti-
cal values calculation:
> y <- mean(rating)
> y
[1] 153
> sd <-sd(rating)
> sd
[1] 18.03145
> var <-var(rating)
> var
[1] 325.1333
> mad <-mad(rating)
> mad
[1] 22.239
> min <-min(rating)
> min
[1] 123
> max <-max(rating)
> max
[1] 186
According to the results of the calculations, the
following data were obtained: the average score of
entrants with external evaluation is 153, the average
difference between the scores of different entrants is
22 points, the lowest result (min) – 123 points, the
best result (max) – 186 points.
Step 3. Let’s construct a histogram of frequen-
cies for external evaluation points using the command
> barplot (figure 7):
> counts <- table(studentdata$rating)
> barplot(counts,
main=’’Frequency diagram’’,
xlab=’’Rating’’, ylab=’’Frequency’’)
Figure 7: The histogram of frequencies for external evalua-
tion points.
The histogram of frequencies shows that the
largest number of entrants has a score from 139 to 142
points, as well as the fact that the vast majority has a
unique score with EIT, which is no longer repeated.
Step 4. We construct histograms of points / fre-
quencies with a normal distribution curve. With this
purpose we use the command > box. We will build:
on the x-axis – the parameter rating, and on the y-axis
– the frequency of the score in the table (figure 8):
> box()
> library(plotrix)
> x <-studentdata$rating
> h <-hist(x, breaks=12, col=’’darkblue’’,
xlab=’’ZNO score’’, main=’’Frequencies
histogram with the curve of distribution‘‘)
> xfit <-seq(min(x), max(x), length=40)
> yfit <-dnorm(xfit,mean=mean(x),sd=sd(x))
> yfit <-yfit*diff(h$mids[1:2]*length(x))
> lines(xfit, yfit, col=’’red’’, lwd=3)
Figure 8: Frequencies histogram with the curve of distribu-
tion.
The distribution histogram shows that the data on
the scores of applicants are not the subject to the nor-
mal law of distribution. We have a lot of “average”
entrants, i.e. those who passed the external exami-
nation from 135 to 145 points. There are also those
who passed 165 points, i.e. entrants with a “suffi-
cient” level. There are very few who scored more than
180 points.
Step 5. We construct a diagram of the nuclear esti-
mation of the density of values for external evaluation
points using the command > box (figure 9):
> box()
> par(mfrow=c(2,1))
> d <- density(studentdata$rating)
> plot(d)
The nuclear density estimation diagram shows
that the highest density is observed in the range from
130 to 155 points. That is, in this interval, based on
the graph, the values differ by 25 points, then, if you
take the full table, they differ by 22 (see standard de-
viation).
AET 2020 - Symposium on Advances in Educational Technology
68

Figure 9: The diagram of nuclear density estimation.
As a result of solving applied problems using the-
oretical knowledge from different sections of statis-
tics, students will not only master the skills of using
statistical methods, but also develop the ability to in-
terpret the results and predict the studied processes.
It should be emphasized that the use of programming
as a practical teaching method will allow students to
improve their knowledge and skills in the field of pro-
gramming as well as the use of algorithms and design
patterns.
Using real data for statistical analysis, students
will be able to understand the need and feasibility of
statistical research in future professional activities.
One of the problems of using application tasks
with real data is the selection and use of data sets.
Much of the datasets are closed and inaccessible for
free research and use. However, there are organiza-
tions that provide free access to data:
• World Bank Open Data (https://data.worldbank.
org/) provides more than 3,000 sets of economic
and social data on various indicators. Data can be
downloaded in csv and xml formats. The service
supports API access, which allows you to auto-
mate data downloads using the programming lan-
guage R.
• The unified state web portal of open data (https:
//data.gov.ua/) contains 15 categories of data sets
that are constantly updated. Datasets are available
for download in Excel, csv, json and xml formats.
All data are available from Creative Commons At-
tribution 4.0 International license.
• The official page of the All-Ukrainian Popu-
lation Census (http://database.ukrcensus.gov.ua)
provides access to information on the population
living in the country, socio-economic characteris-
tics, and demographic indicators, level of educa-
tion, national composition and language charac-
teristics. Datasets can be downloaded in txt, csv,
html formats.
• Open World Health Organization data repository
(https://www.who.int/data/gho/). The site pro-
vides datasets on the health status of citizens
of World Health Organization member states.
Datasets are divided into over 100 categories.
Data can be downloaded in Excel format or use
the API for direct access to data.
• UNICEF Dataset (https://data.unicef.org/) col-
lected relevant data on education, child labor,
child disability, infant mortality, maternal mortal-
ity, water and sanitation, pneumonia, malaria and
more. Datasets are available in Excel and csv for-
mats.
• Registry of Open Data on AWS (RODA) (https:
//registry.opendata.aws/) contains data located on
AWS servers. The service offers access to over
200 datasets. There is a page with additional in-
formation, usage examples, license information,
and more for each data set. Using the wide range
of computing products offered by AWS (Amazon
EC2, AmazonAthena, AWS Lambda and Amazon
EMR), it is possible to share data in the cloud.
This allows users to spend more time analyzing
data rather than collecting data. When using data
sets hosted on AWS, it is necessary to consider the
type of license of each specific data set, as they
belong to different agencies, government organi-
zations, researchers, businesses and individuals.
• Data.gov (https://www.data.gov/) provides open
data sets of the US government. The resource
contains more than 200,000 data sets from various
sources: federal agencies, states, counties, cities,
etc. Data can be obtained in various formats, in-
cluding Excel, csv, json, xml.
• The GroupLens Research (https://grouplens.org/)
provides several sets of movie ratings data pro-
vided by MovieLens users. The kits contain
movie ratings, movie metadata (genre and release
year), and user demographics (age, gender, and
occupation). Such data can be used to develop a
recommendation system based on regression anal-
ysis.
• Open data sets Yelp (https://www.yelp.com/
dataset) is a subset of our businesses, reviews,
and user data for application in personal, educa-
tional, and academic purposes. Available as JSON
files, use it to teach students about databases, to
learn NLP, or for sample production data while
you learn statistics.
• Kaggle (https://www.kaggle.com/datasets) a so-
cial network for researchers, which provides ac-
cess to various data sets for analysis and research.
The convenience of Kaggle is that it is not just a
data warehouse. Each data set brings together a
community of researchers in which data are dis-
Application of R Programming Language in Learning Statistics
69

cussed and approaches to data processing are elu-
cidated.
• Google Public Data Explorer (https://www.
google.com/publicdata/directory) provides access
to more than 130 datasets submitted by World
Bank, U. S. Bureau of Labor Statistics, OECD,
IMF and other organizations.
All considered services provide access to open
data sets. This allows you to fill the content of teach-
ing statistics for future programmers with the tasks of
applied direction.
4 EXPERIMENTAL
VERIFICATION OF THE
EFFECTIVENESS IN THE USE
OF APPLIED TASKS TO TEACH
STATISTICS TO THE FUTURE
PROGRAMMERS
Using programming language R and tasks of applied
direction while training statistics with future IT spe-
cialists.
The main purpose of the pedagogical experiment
is to test the hypothesis that the use of programming
language R and applied problems in teaching statistics
to the future IT professionals will help increase the
educational motivation of students.
According to the hypothesis of the study, the ex-
periment involved checking the level of motivation of
students of IT specialties in the field of statistics based
on the results of implementation of applied problems
and programming language R. The experiment was
conducted on the basis of Berdyansk State Pedagogi-
cal University. Students majoring in 015 Professional
Education (Digital Technology) and 015 Professional
Education (Computer Technology) took part in it.
Control and experimental groups were organized.
In the control group, the educational process was car-
ried out according to the traditional methods. This
technique involved the use of specialized software
(Microsoft Excel, Statistica, etc.) and synthetic tasks,
the content of which did not take into account the
specifics of future professional activities of students
of IT specialties. The control group (CG) consisted
of 42 students. The experimental group used appli-
cation problems and the programming language R to
solve them. The experimental group (EG) included
32 students.
During the formation of control and experimen-
tal groups, their alignment was carried out taking into
account the initial level of educational motivation of
students.
The success of the pedagogical research was en-
sured by the application of the standardized methods.
This guaranteed the reliability of the results.
Experimental methods of teaching statistics of fu-
ture programmers using professional tasks and pro-
gramming language R was based on their application
at all stages of learning: in learning new material as a
motivating task, at the stage of consolidation, in inde-
pendent work of students as a professionally oriented
project.
An electronic learning tool has been developed
for students programmers to provide information and
methodological support for the statistics course. The
development of an electronic tool takes into account
students age and preparation level. The developed
learning tool contains theoretical materials, tasks for
practical implementation, visual materials with ex-
amples of the application of the programming lan-
guage R, a guide to the commands of the R lan-
guage and a list of recommended reading. The e-
learning tool is available on the Internet at the link
https://r.ktuni.bdpu.org/.
In order to test the effectiveness of the imple-
mented experimental training, the level of educational
motivation was chosen as a criterion. To assess the
dynamics of changes in motivation to study statis-
tics, future IT specialists used the method of Rean and
Yakunin (Il’in, 1998) aimed at diagnosing educational
motivation in general in order to identify the predom-
inant types of motives for learning. The technique al-
lows identifying the predominant type of motives and
to trace the dynamics of changes in the structure of ed-
ucational motivation. The methodology is standard-
ized and involves the study of 16 types of educational
motives of students.
Positive motivation for learning ensures the suc-
cessful formation of knowledge and skills. High posi-
tive motivation can compensate for insufficiently high
abilities of students. With the right choice of means of
motivation for learning, there is a positive pedagogi-
cal influence. Focusing only on “negative” motives
(avoidance, fear of failure, fear) is always less effec-
tive than “positive” ones. In our study, we will deter-
mine the impact of the developed system of tasks on
the level of educational motivation of students.
Table 1 presents the results of calculating the aver-
age scores for each type of educational motives on the
scale of Rean and Yakunin (Il’in, 1998). Comparative
analysis of table 1 allows us to conclude that before
the experiment the levels of educational motives of
students in the control and experimental groups did
not differ. After the experiment in the experimental
AET 2020 - Symposium on Advances in Educational Technology
70

Table 1: The results of students’ questionnaire according to the methods of Rean and Yakunin (Il’in, 1998).
Educational motivation
Before the experiment After the experiment
CG EG CG EG
1. To become a qualified specialist 6.6 6.6 6.7 6.8
2. To get the diploma 6.7 6.6 6.2 6.8
3. To continue successful studies at further
courses 5.6 6.3 6.0 6.2
4. To study successfully, to pass exams
for “good” and “excellent” marks 6.0 5.3 4.5 6.2
5. To get constant scholarship 5.5 5.2 4.9 5.5
6. To gain deep and profound knowledge 6.0 6.3 6.3 6.8
7. To be always ready for classes 4.5 4.5 5.0 5.2
8. Not to give up learning the subjects of the
educational cycle 5.5 5.6 5.5 6.5
9. Not to lag behind the classmates 6.0 5.6 5.5 5.8
10. To provide future successful professional
activity 6.8 6.6 6.5 6.9
11. To execute pedagogical requirements 5.0 4.7 5.2 5.5
12. To get teachers’ respect 4.8 5.2 3.6 4.9
13. To be an example for the classmates 3.2 4.7 3.5 4.3
14. To gain parents’ and relatives’ respect 4.5 4.8 5.0 6.6
15. To avoid condemnation and punishment
for bad studying 4.1 4.9 5.0 4.5
16. To get intellectual satisfaction 4.9 4.91 4.5 6.6
Table 2: Statistical comparison of the students of control and experimental groups educational motivation levels before and
after the experiment.
Before the experiment After the experiment
W
emp
W
crit
Taken hypothesis W
emp
W
crit
Taken hypothesis
0.1508 1.96 H
0
2.186 1.96 H
1
group there is an increase in the levels of the internal
educational motives of students. In general, the level
of educational motivation in the experimental group
is higher than in the control group, except for the mo-
tives of avoiding failure and punishment.
Table 2 shows the results of statistical compar-
ison of the control and experimental groups before
and after the experiment. The following statements
were formulated as working hypotheses: H
0
– levels
of learning motivation in the compared groups do not
differ; H
1
– levels of motivation to learn in the com-
pared groups differ. The Mann-Whitney U-test was
used to determine the difference between the samples.
This is a non-parametric statistical criterion used to
estimate the difference between two samples at the
level of any qualitatively measured trait. It allows you
to detect differences in the value of the parameter be-
tween small samples.
Statistical analysis allows us to conclude that at
the level of significance α = 0.05 the initial states of
the experimental and control groups (before the ex-
periment) coincide. At the end of the experiment, the
levels of educational motivation differ.
So, the results of the study indicate that the hy-
pothesis of the study was confirmed, namely the intro-
duction of statistics of the R programming language
and applied problems in the learning process helps to
increase the level of educational motivation of future
IT professionals.
5 CONCLUSIONS
During the research the introduction of innovative ap-
proaches to the study of statistics has been theoreti-
cally substantiated. The conducted research allowed
establishing that the training of statistics of future pro-
grammers should be based on the use of applied tasks
developed with the help of real data sets obtained as a
result of statistical research. Such tasks allow increas-
ing the educational motivation of students in compar-
ison with synthetic examples, which are usually used
in the study of statistics.
Datasets for statistical analysis are a source of ap-
Application of R Programming Language in Learning Statistics
71

plied tasks. Access to data sets on the Internet is free.
Therefore, the development of practical and labora-
tory work for future IT professionals should include
tasks that will contain real data from the following
subject areas: sociology, medicine, engineering, eco-
nomics and biology.
Using the programming language R to teach
statistics to the future programmers allows you to use
the method of practical training based on program-
ming. This approach involves students in familiar to
them practical activities and programming. There-
fore, we propose to use the R language and program-
ming environment as the main learning tool. MS Ex-
cel and Statistica software packages should be used as
teaching aids.
In further research it is planned to develop a
methodology for the implementation and application
of programming languages R and Python for statisti-
cal data analysis.
REFERENCES
Ben-Zvi, D. and Garfield, J. B. (2004). The challenge of
developing statistical literacy, reasoning and thinking.
Springer.
Biehler, R., Frischemeier, D., Reading, C., and Shaugh-
nessy, J. M. (2018). Reasoning about data. In Inter-
national handbook of research in statistics education,
pages 139–192. Springer.
Bishop, A. J., Clements, M. A. K., Clements, K., Keitel,
C., Kilpatrick, J., and Laborde, C. (1996). Interna-
tional Handbook of Mathematics Education. Springer
Science & Business Media.
Cox, D. R. (1997). The current position of statistics:
a personal view. International statistical review,
65(3):261–276.
Fitsula, M. M. (2000). Pedagogy.
Gal, I. and Garfield, J. (1997). Curricular goals and assess-
ment challenges in statistics education. The assess-
ment challenge in statistics education, pages 1–13.
Garfield, J. and Ben-Zvi, D. (2008). Developing students’
statistical reasoning: Connecting research and teach-
ing practice. Springer Science & Business Media.
Il’in, E. P. (1998). Human motives: the-
ory and methods of study. High school.
https://www.elibrary.ru/item.asp?id=21748410.
Kaminskaya, A. V. (2011). Forming of readiness of future
teachers to innovative activity in higher educational
establishment. Scientific Bulletin of Donbass, (1).
http://nvd.luguniv.edu.ua/archiv/NN13/11kavvnz.pdf.
Kazakov, V. H. (2006). New times - new technologies of
professional training. Professional education, (1):12.
Khomenko, V. H., Pavlenko, L. V., Pavlenko, M. P., and
Khomenko, S. V. (2020). Cloud technologies in in-
formational and methodological support of univer-
sity students’ independent study. Information Tech-
nologies and Learning Tools, 77(3):223–239. https:
//journal.iitta.gov.ua/index.php/itlt/article/view/2941.
Kulinenko, L. (2013). Technologies of innovative ed-
ucational space. Naukovyi chasopys Natsional-
noho pedahohichnoho universytetu imeni M. P. Dra-
homanova. Seriia 07. Relihiieznavstvo. Kulturolohiia.
Filosofiia, (29 (41)). http://enpuir.npu.edu.ua/handle/
123456789/12492.
Langrall, C. W., Makar, K., Nilsson, P., and Shaughnessy,
J. M. (2017). Teaching and learning probability and
statistics: An integrated perspective.
Modis (2018). STEM IQ Survey Results 2018.
https://www.modis.com/en-us/resources/employers/
stem-iq-survey-2018/.
Moore, D. S. (1997). New pedagogy and new content:
The case of statistics. International statistical review,
65(2):123–137.
Nicholl, D. F. (2001). Future directions for the teaching and
learning of statistics at the tertiary level. International
Statistical Review, 69(1):11–15.
Pavlenko, M. and Pavlenko, L. (2021). Formation of
communication and teamwork skills of future IT-
specialists using project technology. Journal of
Physics: Conference Series, 1840(1):012031.
Rapatsevych, E. S. (2006). Psychological and pedagogical
dictionary. Minsk.
Rumsey, D. J. (2002). Statistical literacy as a goal for in-
troductory statistics courses. Journal of Statistics Ed-
ucation, 10(3).
Shaughnessy, J. M. (1992). Research in Probability and
Statistics : Reflections and Directions. In Handbook
on Research in Mathematics Education, pages 465–
494. https://ci.nii.ac.jp/naid/10029959707/.
Shaughnessy, J. M. (2007). Research on Statis-
tics’ Reasoning and Learning. pages 957–1009.
https://ci.nii.ac.jp/naid/10029959708/.
Smith, T. M. F. and Staetsky, L. (2007). The teaching of
statistics in UK universities. Journal of the Royal
Statistical Society: Series A (Statistics in Society),
170(3):581–622.
Tishkovskaya, S. and Lancaster, G. A. (2012). Statistical
Education in the 21
st
Century: A Review of Chal-
lenges, Teaching Innovations and Strategies for Re-
form. Journal of Statistics Education, 20(2):4.
Varian, H. R. (2017). Nel 2020 il data an-
alyst sar
`
a la professione pi
`
u ricercata.
https://www.giornaledibrescia.it/rubriche/impresa-4-
0/nel-2020-il-data-analyst-sar
Watson, J. M., Fitzallen, N. E., and Carter, P.
(2013). Top drawer teachers: Statistics.
http://ecite.utas.edu.au/87993.
Zieffler, A., Garfield, J., Alt, S., Dupuis, D., Holleque,
K., and Chang, B. (2008). What Does Research
Suggest About the Teaching and Learning of In-
troductory Statistics at the College Level? A Re-
view of the Literature. Journal of Statistics Educa-
tion, 16(2):8. https://www.tandfonline.com/doi/full/
10.1080/10691898.2008.11889566.
AET 2020 - Symposium on Advances in Educational Technology
72
