
Data Science in Economics Education: Examples and Opportunities
Nina O. Rizun
1 a
, Maryna V. Nehrey
2 b
and Nataliia P. Volkova
3 c
1
Gda
´
nsk University of Technology, 11/12 Gabriela Narutowicza, 80-233 Gda
´
nsk, Poland
2
National University of Life and Environmental Sciences of Ukraine, 15 Heroyiv Oborony Str., Kyiv, 03041, Ukraine
3
Alfred Nobel University, 18 Naberezhna Sicheslavska Str., Dnipro, 49000, Ukraine
Keywords:
Data Science, High Education, Economics, Machine Learning, Topic Modelling, Natural Language Process-
ing.
Abstract:
Data science is the field of study that involves tools, algorithms, and knowledge of maths and statistics to
discover knowledge from the raw data. Data science is developing fast and penetrating all spheres of life.
More people understand the importance of the science of data and the need for implementation in everyday
life. Data science is used in business for business analytics and production, in sales for offerings and, for
sales forecasting, in marketing for customizing customers, and recommendations on purchasing, digital mar-
keting, in banking and insurance for risk assessment, fraud detection, scoring, and in medicine for disease
forecasting, process automation, and patient health monitoring, in tourism in the field of price analysis, flight
safety, opinion mining, etc. This article concerns the issue of data science tools implementation, including
the Text Mining and Natural Language Processing algorithms for increasing the value of Economics Edu-
cation for the development of modern and technologically flexible society. The article deeply discusses the
opportunities of using Text Analytics and Topic modeling for conducting scientific studies and applying them
in the educational process. Presented examples demonstrate the nature of tasks and approaches which could
develop students’ research skills in the public perception analysis. Such approaches also allow students to gain
practical experience in the study and interpretation of the influence of additional metadata, characterizing the
comments authors, on differences in their opinions about events, companies, goods, and services. Finally, the
Data science study programs for economics at top-20 universities are selected and discovered.
1 INTRODUCTION
2020 was a turning point for the whole world.
COVID-19 and the resulting pandemic have identified
weaknesses in society and opened up opportunities
for development in many areas. The education sector
has also felt the significant impact of the pandemic:
the digitalization of the educational process, the tran-
sition to online learning and the abolition of educa-
tional activities – all this forces to seek effective so-
lutions and adapt to new conditions. The field of eco-
nomics has also undergone significant changes, ac-
companied by the digitalization of processes, the tran-
sition to remote work and changes in service and com-
munication with customers (Soloviev et al., 2020b).
The fast-growing world has become even more digi-
tal. Therefore, the skill is becoming increasingly pop-
a
https://orcid.org/0000-0002-4343-9713
b
https://orcid.org/0000-0001-9243-1534
c
https://orcid.org/0000-0003-1258-7251
ular use data correctly, model processes and make de-
cisions using modern methods and technologies.
Data science is a field of study that includes tools,
algorithms, and knowledge of mathematics and statis-
tics to identify knowledge from raw data. Data sci-
ence is evolving rapidly and is penetrating all walks of
life. More people understand the importance of data
science and the need to implement it in everyday life.
Data science is used in business for business intelli-
gence and manufacturing, for sales offerings and for
sales forecasting, marketing for customer customiza-
tion and procurement recommendations, digital mar-
keting, banking and insurance for risk assessment,
fraud detection, valuation and in medicine for fore-
casting diseases, process automation and monitoring
of patients’ health, in tourism in the field of price anal-
ysis, flight safety, etc. However, the application of
data science in education has been relatively limited,
and many opportunities for advancing industries have
not yet been explored.
550
Rizun, N., Nehrey, M. and Volkova, N.
Data Science in Economics Education: Examples and Opportunities.
DOI: 10.5220/0010926100003364
In Proceedings of the 1st Symposium on Advances in Educational Technology (AET 2020) - Volume 1, pages 550-564
ISBN: 978-989-758-558-6
Copyright
c
2022 by SCITEPRESS – Science and Technology Publications, Lda. All rights reserved

Data science should be used in education to solve
scientific problems, for example, in the study of
behaviour in economics, in macro- and microeco-
nomics, marketing, finance, agriculture, environmen-
tal and ecological economics and so on.
2 LITERATURE REVIEW
Data Science has a big list of tools: Linear Regres-
sion, Logistic Regression, Density Estimation, Con-
fidence Interval, Test of Hypotheses, Pattern Recog-
nition, Clustering, Supervised Learning, Time Se-
ries, Decision Trees, Monte-Carlo Simulation, Naive
Bayes, Principal Component Analysis, Neural Net-
works, k-means, Recommendation Engine, Collabo-
rative Filtering, Association Rules, Scoring Engine,
Segmentation, Predictive Modeling, Graphs, Deep
Learning, Game Theory, Arbitrage, Cross-Validation,
Model Fitting, etc. Some of these tools were used in
the next researches.
Teaching data science, for example, were intro-
duced in (Brunner and Kim, 2016), Big data and
Data Science methods presented in (Chen et al.,
2012; George et al., 2016; Shoro and Soomro, 2015;
Xiong et al., 2017; Cao, 2017; Ignatyuk et al.,
2020), machine learning used in (Parish and Du-
raisamy, 2016; Derbentsev et al., 2020; Guryanova
et al., 2020b; Babenko et al., 2021; Nosratabadi
et al., 2020; Zelinska, 2020), Monte Carlo method
presented in (Balabay and Chernonog, 2007; Patri-
arca et al., 2017), Artificial Intelligence presented in
(Rizun and Shmelova, 2017). Data Science is fast de-
veloping. A large volume of information that grows
with each passing year makes it possible to build
high-precision models that simplify and partially au-
tomate the decision-making process. Models are be-
ing developed that implement the key data science
algorithms for different areas of economics: finan-
cial Data Science (Bielinskyi et al., 2021; Brooks
et al., 2019; De Prado, 2018; Danylchuk et al., 2019;
Soloviev and Belinskiy, 2019; Soloviev et al., 2020a;
Guryanova et al., 2020a; Kuzmenko et al., 2020; Kly-
menko et al., 2019), for institutional economics –
(Pr
¨
ufer and Pr
¨
ufer, 2018; Hrabovskyi et al., 2020;
Ilchuk et al., 2019; Oliskevych et al., 2018; Shi et al.,
2020; Matviychuk et al., 2019), for agriculture –
(Kaminskyi et al., 2020; Nehrey et al., 2019; Voro-
nenko et al., 2020), for taxation – (Ausloos et al.,
2017), and labor market – (Oliskevych and Lukia-
nenko, 2019).
Data Science developing for education discussed
in (National Academies of Sciences, Engineering, and
Medicine et al., 2018; Volkova et al., 2019; Perevo-
zova et al., 2020; Dimitrov et al., 2019).
3 DATA SCIENCE: PRINCIPLES
AND TOOLS
Data Science in education is a multidisciplinary ap-
proach to technologies, processes, and systems for ex-
tract knowledge, understanding of data, and supports
decision-making under uncertainty. Data science
deals with mathematics, statistics, statistical model-
ing, signal processing, computer science & program-
ming, database technologies, data modeling, machine
learning, natural language processing, predictive an-
alytics, visualization, etc. Data Science in education
has two aspects of the application: (i) the manage-
ment and processing of data and (ii) analytical meth-
ods for analysis and modeling, and includes nine main
steps (figure 1). The first aspect includes data sys-
tems and their preparation, including databases facili-
ties, data cleansing, engineering, visualization, moni-
toring, and reporting. The second aspect includes data
analytics data mining, machine learning, text analyt-
ics, probability theory, optimization, and visualiza-
tion. The basis of the learning process is the avail-
ability of relevant data that is of sufficient quality, ap-
propriately organized for the task. Primary data often
requires pre-processing. First of all, it is necessary to
investigate the availability of the necessary data and
how they can be obtained. The data search ends with
the creation of a data set in which data coexistence
is to be provided. Data science has a wide range of
tools for data evaluation and preparation, in particu-
lar for data mining, data manipulation (value conver-
sion, data aggregation and reordering, table aggrega-
tion, breakdown or merge of values, etc.) and vali-
dation of data (checking format, ranges of test values
and search in legal values tables). The problem of
missing values is solved by using different analytical
methods: simulation, inserting default values, statis-
tical simulation. Data science provides broad oppor-
tunities for text analytics. In addition, the use of data
science tools facilitates work with big data. The main
approaches in Data Science are Supervised learning
models and Unsupervised learning models.
3.1 Supervised Learning Models
Supervised learning is one of the methods of machine
learning, in which the model learns on the basis of la-
beled data. Using Supervised learning is possible to
decide on two types of tasks: regression and classifi-
cation. The main difference between them is the type
of variance that is predicted by the corresponding al-
Data Science in Economics Education: Examples and Opportunities
551
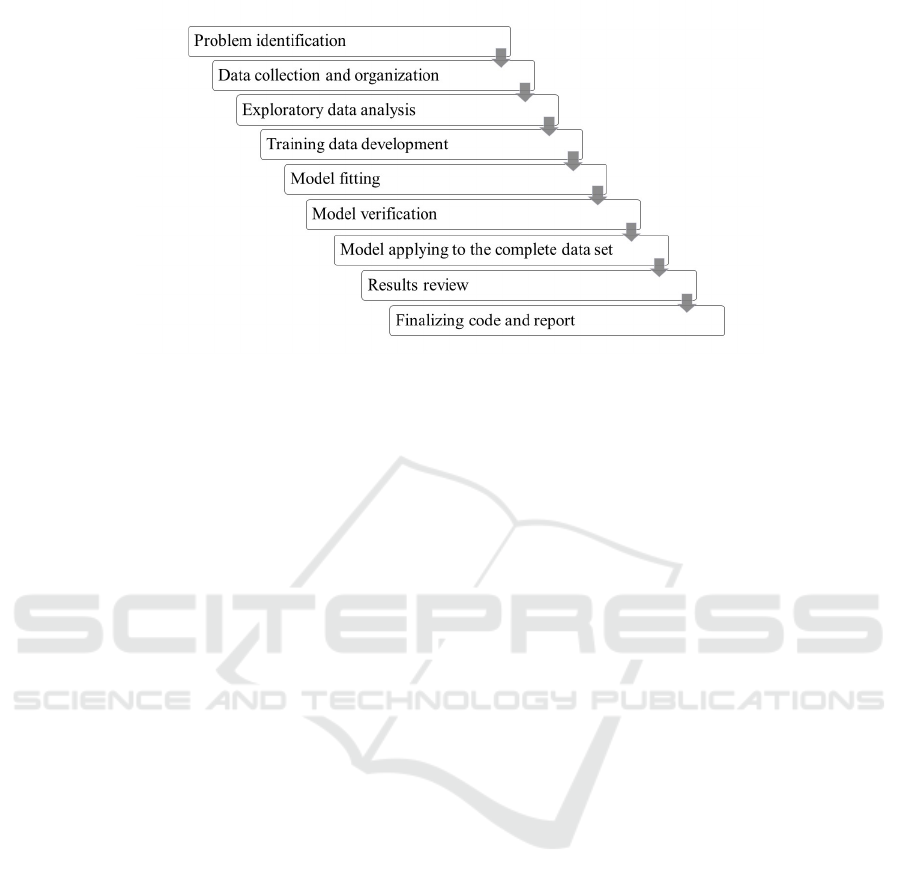
Figure 1: Data Science process.
gorithm. In regression training, it is a continuous vari-
able, in the classification, it is a categorical variable.
To solve these problems, many algorithms have been
developed. One of the most common is a linear and
logistic regression, a decision tree.
Linear regression. Regression analysis can be
considered as the basis of statistical research. This
approach involves a wide range of algorithms for fore-
casting a dependent variable using one or more factors
(independent variables). The advantage of applying
such an approach to modeling is the simplicity and
clarity of the results, the speed of learning, and the
release of the forecast. The disadvantage is not al-
ways sufficiently high precision (since in economics
and finances, the linear relationship between changes
is rare).
Logistic regression is used when it is necessary
to predict the release of a binary variable using a
dataset of continuous or categorical variables. Situa-
tions, where the parent variable has more than 2 possi-
ble values, can be simulated by a one-vs-all approach
when constructing a logistic classifier for a possible
output, or one-vs-one when constructing logistic clas-
sifiers for each possible combination of categories of
the original variable. The dependence between the
independent and the logarithmic variable in logistic
regression is linear, the only difference with linear re-
gression is sigmoidal functions, which converts a lin-
ear result in the probability of belonging to a class
within [0; 1]. The advantages and disadvantages of
logistic regression are due to the advantages and dis-
advantages of linear regression. This is the speed of
the algorithm and the possible interpretation of the re-
sults, on the one hand, and a little accuracy – on the
other. Logistic regression is often used to construct
vote-counting models. An important factor in this is
the interpretation of its results. The influence of each
factor is clearly expressed by the magnitude of the co-
efficient b, which allows it to be clearly defined which
of them positively and to what extent influence the de-
cision.
A decision tree is an approach to both regression
and classification. It is widely used in intelligent data
analysis. The decision tree consists of “nodes” and
“branches”. The tree nodes have attributes that are
used to make decisions. In order to make a decision,
it is needed to go down to the bottom of the decision
tree. The sequence of attributes in a tree, as well as the
values that divide the leaves into branches, depends
on such parameters as the amount of information or
entropy that the attribute adds to the prediction vari-
able. The advantages of decision trees are the sim-
plicity of interpretation, greater accuracy in decision-
making simulation compared with regression mod-
els, the simplicity of visualization, natural modeling
of categorical variables (in regression models it is
needed to be coded by artificial variables). However,
the decision trees have one significant drawback – low
predictive accuracy (James et al., 2013).
3.2 Unsupervised Learning
Unsupervised learning describes a more complex sit-
uation in which, for each observation i = 1, ..., n, ob-
servation of the measurement vector x
i
, but without
any variables in the output y
i
. In such data, the con-
struction of linear or logistic regression models is im-
possible, since there are no predictive variables. In
such a situation, a so-called “blind” analysis is con-
ducted. Such a task belongs to the class of tasks of
unsupervised learning, due to the absence of an out-
put variable that guided the analysis. Unsupervised
AET 2020 - Symposium on Advances in Educational Technology
552

learning algorithms can be divided into algorithms for
space reduction and clustering algorithms. The main
task of clustering is to find patterns in the data that
allow you to divide the data into groups and then in a
certain way analyze them and give them an interpre-
tation.
K-means is one of the most popular clustering
algorithms, whose main task is to divide n observa-
tions into k clusters. The minimum sum of squares is
the distance of each observation to the center of the
corresponding cluster. This algorithm is iterative, at
each step the cluster centers are re-indexed and redis-
tributed observation between them until a stable result
is achieved. The benefits of such an algorithm of clus-
tering are the simplicity, speed, and the ability to pro-
cess large amounts of data. But the user must specify
the number of clusters he wants to use for clustering
before computing; the instability of the result (it de-
pends on the initial separation of points between the
clusters).
Hierarchical clustering is an alternative ap-
proach to clustering, which does not require a prelim-
inary determination of the number of clusters. More-
over, the hierarchical clustering ensures the stability
of the result and gives the output an attractive vi-
sualization based on the tree-like structure of obser-
vations/clusters – dendrogram. This clustering algo-
rithm uses different distance metrics and cluster ag-
glomeration cluster criteria, which makes it very flex-
ible to the data on which clustering is performed.
However, the disadvantage of hierarchical clustering
is the need to calculate the matrices of the distance
between observations before agglomeration, which
complicates the application of this algorithm for large
data and data with many dimensions.
Time series analysis. A time series is built by
observations that have been collected with a fixed in-
terval. It could be daily demand, or monthly profit
growth rates, number of flights, etc. The time se-
ries analysis takes an important part in the analysis
of data that covers the region, from the analysis of ex-
change rates to sales forecasting (Nehrey and Hnot,
2017; Voronenko et al., 2021). One of the tasks of
time series analysis is the allocation of trend and sea-
sonal components and the construction of the fore-
cast. There are many algorithms that have been de-
veloped, and we consider models such as ARIMA and
Prophet.
The ARIMA algorithm is one of the most com-
mon algorithms for forecasting time series. The basic
idea is to use the previous time series values to predict
the future. This can use any number of lags, which
makes such an approach difficult in setting because it
is necessary to select the parameter so as to minimize
the error and not override the model. ARIMA is of-
ten used for short-term forecasting. A disadvantage is
the complexity of learning a model in many seasonal
conditions.
Algorithm Prophet was developed by Facebook
at the beginning of 2017 for forecasting based on time
series (Nehrey and Hnot, 2017). It is based on an ad-
ditive model in which nonlinear trends are of annual
and weekly seasonality. This approach also allows
to model holidays and weekends, thereby allowing to
predict residuals in a time series. Also, the Prophet is
insensitive to missed values, the bias in the trend, and
significant residuals, which is an important advantage
over ARIMA. Another advantage is the rather high
speed of training, as well as the ability to use large-
scale time series.
4 TOPIC MODELING IN DATA
SCIENCE
Under the notion of texts mining in natural language
we understand the application of methods of texts
computer analysis and presentation in order to achieve
the quality, which corresponds to the “manual” pro-
cessing for further usage in various tasks and appli-
cations. One of the actual tasks of automatic texts
mining is topic modelling.
4.1 Latent Dirichlet Allocation
Topic modelling is a statistical approach to extract
the hidden semantics that occurs in a collection of
documents or reviews. Latent Dirichlet Allocation
(LDA) model proposed by (Blei et al., 2003) is one
of the most notable approach for unsupervised topic
modeling, which assumes documents and the words
within them are derived from a “generative proba-
bilistic model”. Within the class of unsupervised sta-
tistical topic models, themes are defined as distribu-
tions over a vocabulary of words that represent se-
mantically interpretable “topic” (Roberts et al., 2014).
‘Meaning’ of those topics (usually, in the form of
topic Label and topic Description) is an emergent
quality of the relationship between words (Robinson,
2019; DiMaggio et al., 2013). The task of topic mean-
ing recognizing is often fraught with difficulty and re-
quires the application of a triangular approach to its
implementation, namely: (i) a literature review of ex-
isting topics found in the analyzed problem domain;
(ii) independent work of experts on assigning labels
to topics; (iii) conducting joint expert discussions in
order to compare and revise the obtained labelling re-
sults.
Data Science in Economics Education: Examples and Opportunities
553

Figure 2: Latent Dirichlet allocation model (Blei, 2012).
As for main assumption of LDA method, there are
the following (Roberts et al., 2016): (i) document is
represented as a mixture of topics; (ii) each topic are
present in many documents; (iii) each word within a
given document belonging to exactly one topic; (iv)
each document can be represented as a vector of pro-
portions that denote what fraction of the words belong
to each topic.
The basic LDA model is shown in figure 2.
Figure 2 serves as a visual explanation of the
model and could be described as follows: (i) we have
D documents and K topics; (ii) each topic presented
by β
k
words distribution over the vocabulary within
the topic k; (iii) each document is presented by θ
d
topic proportions within the document, where θ
d,k
is
the topic proportion for topic k in document d. Fi-
nally, we have (iv) for each n
th
word in the docu-
ment d – topic assignments z
d,n
(depends on the per-
document topic proportions θ
d
) and (v) for each d
th
document – observed words w
d,n
which is an element
from the fixed vocabulary (depends on the topic as-
signment z
d,n
and all of the topics β
1:k
) (Blei, 2012).
In is obviously that data scientist in cooperation
with other science domains increasingly seek ways to
apply NLP and especially LDA topic modelling tech-
niques to extract, organize, recognize, label and clas-
sify customers opinions and experiences (Kobayashi
et al., 2018a). Next examples demonstrate the pos-
sibilities to sol the apply LDA topic modelling for
solving: (i) human resources management, (ii) ser-
vice quality assessment, (iii) research & development
policy coordination tasks and (iv) strategic planning
in universities.
Kobayashi et al. (Kobayashi et al., 2018b) used
topic modelling to summarize the worker attributes
and find worker attribute constructs and use these to
cluster jobs. 140 main topics were identified, and
such skills, as, for example, interpersonal communi-
cation (vocabulary of words: communication, written,
oral, verbal, interpersonal, presentation, effective, lis-
tening); analytical and problem-solving (vocabulary
of words: problem, solving, analytical, solver, trou-
bleshooting, approach, abilities, capabilities); data
analytical skills (vocabulary of words: data, Analy-
sis, quantitative, research, statistics, economics, sta-
tistical, modeling); willingness to travel and the abil-
ity to operate on a flexible work schedule (vocabu-
lary of words: travel, willingness, willing, work, time,
needed, internationally, international) and other. As
authors mentioned, topic modelling showed that it is
not only possible to classify job information from va-
cancies but that we can also derive behavioral char-
acteristics that are valued or required by employers
from potential or existing job holders. Moreover, as
a further analysis of this research was planned the
analysing trends of worker attributes required by or-
ganizations (i) over time, (ii) occupations, companies,
and (iii) geographical regions, and also (iv) possibil-
ity to build a network of work activities to examine
relationship among tasks.
Wallace et al. (Wallace et al., 2014), Sharma et al.
(Sharma et al., 2016) captured the main positive and
negative words within latent aspects (topics), which
characterise interpersonal manner, technical compe-
tence, and systems issues (L
´
opez et al., 2012) from
online physician reviews. Similar with previous work,
James et al. (James et al., 2017) based on L
´
opez et al.
(L
´
opez et al., 2012) categorization, examined unstruc-
tured textual feedback of physicians in order to deter-
mine: (i) how the extracted sentiment and topics com-
pared to traditional identified dimensions of service
quality in healthcare and (ii) what tone and topic el-
ements were driving patients’ service quality ratings.
As a main finding were the following list of topics
and their tone: (1) Negative system quality: Staff and
Timeliness (vocabulary of words: office, staff, time,
doctor, wait, appointment); (2) Positive interpersonal
quality: Physician Compassion (vocabulary of words:
doctor, caring, great, knowledgeable, excellent, rec-
ommend); (3) Negative system quality: Experience
AET 2020 - Symposium on Advances in Educational Technology
554

(vocabulary of words: told, don’t, doctor, ask, bad,
money, call); (4) Positive Technical quality: Family
(vocabulary of words: doctor, questions, staff, prac-
tice, children, son, pregnancy); (5) Positive Techni-
cal quality: Surgery (vocabulary of words: surgery,
pain, procedure, staff, hospital, knee, cancer, age); (6)
Negative Technical quality: Diagnosis (vocabulary of
words: years, treatment, medical, patient, conditions,
test, diagnosis, time, treated). The obtained results al-
lowed the authors to establish the dependence on the
degree of influence of the identified aspects (topics)
on the general perception of the physician’s quality,
as well as the behavioural characteristics of patients
when choosing a doctor online, depending on the con-
tent of comments and overall rating.
4.2 Structural Topic Modelling
When conducting research on the basis of textual
documents or customers comments, researchers of-
ten have a more of information “about the text” than
“about the content of the text”. From the perspec-
tive of topic modelling as a statistical approach, the
existence of such information “about the text” (meta-
data) allows and initiates the inclusion in the model of
additional covariates that could influence the follow-
ing components of the topic model: (1) Proportion
of the document devoted to the topic (”prevalence of
the topic”). For example, we can know that “clients
who buy products online are more likely to talk about
delivery problems than clients who buy offline”. (2)
Word rates used in the discussing of the topic (”topi-
cal content”). For example, we can clarify that “when
clients talking about delivery problems, clients who
buy products online are more likely discuss the prob-
lems about products returning, but patients clients
who buy offline are more likely discuss staff rude-
ness issues” (Roberts et al., 2019). Such possibilities
are proposed by Structural topic modelling (STM) as
an extension of the LDA framework (Robinson, 2019;
Roberts et al., 2019, 2013) .
Drawing analogies with LDA: (i) each document
in STM arises as a mixture over K topics; (ii) topic
proportions (θ
d
) can be correlated (LDA limitation
1); (iii) topics prevalence θ
d
can be influenced by set
of covariates X through a standard regression model
with covariates; (ii) for each w
n
word in the docu-
ment d (iii) a topic Z
d,n
is drawn from the document-
specific distribution, and (iv) conditional on that
topic, a word is chosen from a multinomial distribu-
tion over words parameterized by β
d,k,v
, where k =
Z
d,n
. This distribution can include a second set of co-
variates Y (Roberts et al., 2019). Thus, the main dif-
ferences between the LSA and STM models (figure
3) are that the prevalence (content) parameters deter-
mined in the LDA by the general a priori Dirichlet
parameters α(η) in the STM model are replaced with
prior structures specified in the form of generalized
linear models parameterized by document specific co-
variates X(Y ) (Hu et al., 2019) These covariates in-
form either the topic prevalence (covariates X) or the
topical content (covariates Y ) latent variables with in-
formation “about the text” (metadata).
5 EXAMPLE OF STRUCTURAL
MODELLING ALGORITHMS
APPLICATION IN EDUCATION
In order to study customer perception of the qual-
ity of services, assess their satisfaction with goods
or services received, as well as identify factors that
influence customer acceptance of new offers on the
market, students were asked to use STM tools. As
a data source 610 textual comments about hospitals
from the site http://www.ratemyhospital.ie/ (over the
past two years – 2018–2019) were used. STM pack-
age allows to use all additional variables to demon-
strate the power of meta-data for topic modelling.
With this aim, textual comments data was extended
by information about (1) hospital ownership (private,
public), (2) sentiment (positive or negative) (table 1)
(Ojo and Rizun, 2020). After that, all steps of text
pre-processing were performed.
First, the STM model’s setup were performed. To
determine the optimal number of topics, STM models
from 10 till 30 topics were built were analyzed. Se-
mantic coherence is maximized when the most prob-
able words in a given topic frequently co-occur to-
gether, and it is a metric that correlates well with a hu-
man judgment of topic quality. Having high semantic
coherence is relatively easy, though, if we only have a
few topics dominated by very common words, so we
wanted to look at both semantic coherence and exclu-
sivity of words to topics. So, the most valuable num-
ber of topics should be very coherent and also very ex-
clusive. Looking at figure 4, we draw the conclusion
that the 15 topics suit the most to these criteria. Most
of the topics, in this case, are above the average of
exclusivity and have high coherence, especially com-
pared to the other number of topics which are often
spread out on both axes. 15-topic STM model was se-
lected based on subjectively optimal combination of
the average semantic coherence and exclusivity out-
comes.
As a result, for 15-topic model, we received the (i)
topic-words distribution β; (ii) document-topic pro-
Data Science in Economics Education: Examples and Opportunities
555
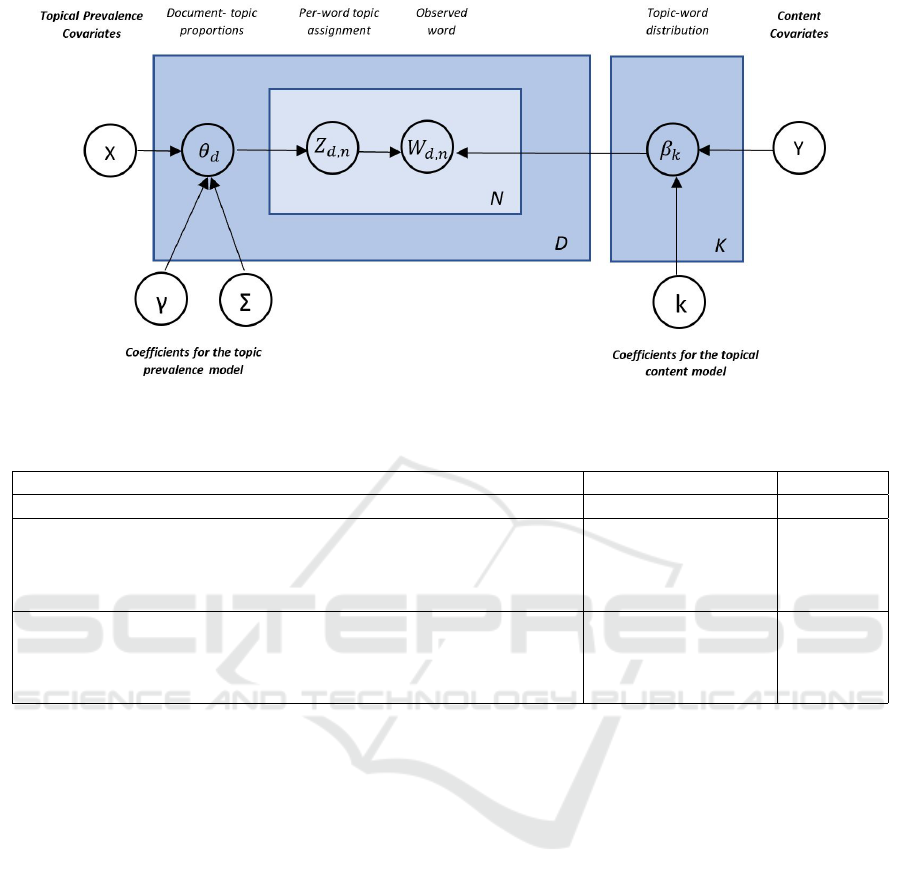
Figure 3: A graphical illustration of the structural topic model (Roberts et al., 2016).
Table 1: Comments before pre-processing.
Comments Hospital Ownership Sentiment
A lovely friendly patient-focussed hospital Public Positive
Consultant I found seriously lacking compassion for my mother the
patient. Sniggered while informing us that while my mother’s condi-
tion is uncomfortable, it is not life threatening. To be frank, consul-
tant spoke down to us.
Public Negative
Tullamore is a very clean hospital and looks very well. All staff I
had the pleasure of meeting were lovely and very professional at all
times. The staff in all capacities do not receive enough thanks for the
jobs they do
Private Positive
portions θ; (iii) list of Highest probability-, FREX-
, Lift- and Score-keywords (Highest Prob: are the
words within each topic with the highest probability;
FREX: are the words that are both frequent and ex-
clusive, identifying words that distinguish topics; Lift:
give more weight to words that appear less frequently
in other topics by dividing their frequency into other
topics; Score: score words are weighted by dividing
the log frequency of the word in the topic by the log
frequency in other topics (Roberts et al., 2013; Chang,
2015; Griffiths and Steyvers, 2004)); (iv) set of doc-
uments, mostly associated with this topic. The figure
5 allows us to get information on the share of the dif-
ferent topics at the overall corpus.
Second, students needed to realize the Topics la-
belling step. For that: (1) two students independently
labelled the topics to produce the first version of la-
bels based on top weighted keywords; (2) two stu-
dents discussed the labels and resolved discrepancies
in labelling; (3) two students independently refined
topic labels based on the computationally guided deep
reading 20 of the most representative tweets of the
topics; (5) two students agreed on final 15 topic labels
and jointly developed the topics descriptions (short
summarization of the topic content) (Ojo and Rizun,
2020). The result of topic labelling is presented in the
table 2.
Third, the STM covariate analysis could be per-
formed. In this stage, we aimed the evaluating the
Sentiment effect on the formation of more positively
and more negatively oriented aspects of hospitals ser-
vice quality (HSQ). Thus, we use Sentiment metadata
as Covariate in the STM model. Formally, we can
identify an aspect as negative if, according to the re-
sults of effect estimation, the proportion of this aspect
in negative comments (Sentiment = Negative) is sig-
nificantly higher than in comments in positive com-
ments (Sentiment = Positive). According to the re-
sults of our experiment, 5 topics (33.33%) are posi-
tive (right side of figure 6), and 10 topics (66.66%)
are negative (left side of figure 6).
The dots in the figure 6 indicated the mean values
of the estimated proportion differences (power of in-
fluence, PI) with 95% confidence intervals, allows us
AET 2020 - Symposium on Advances in Educational Technology
556
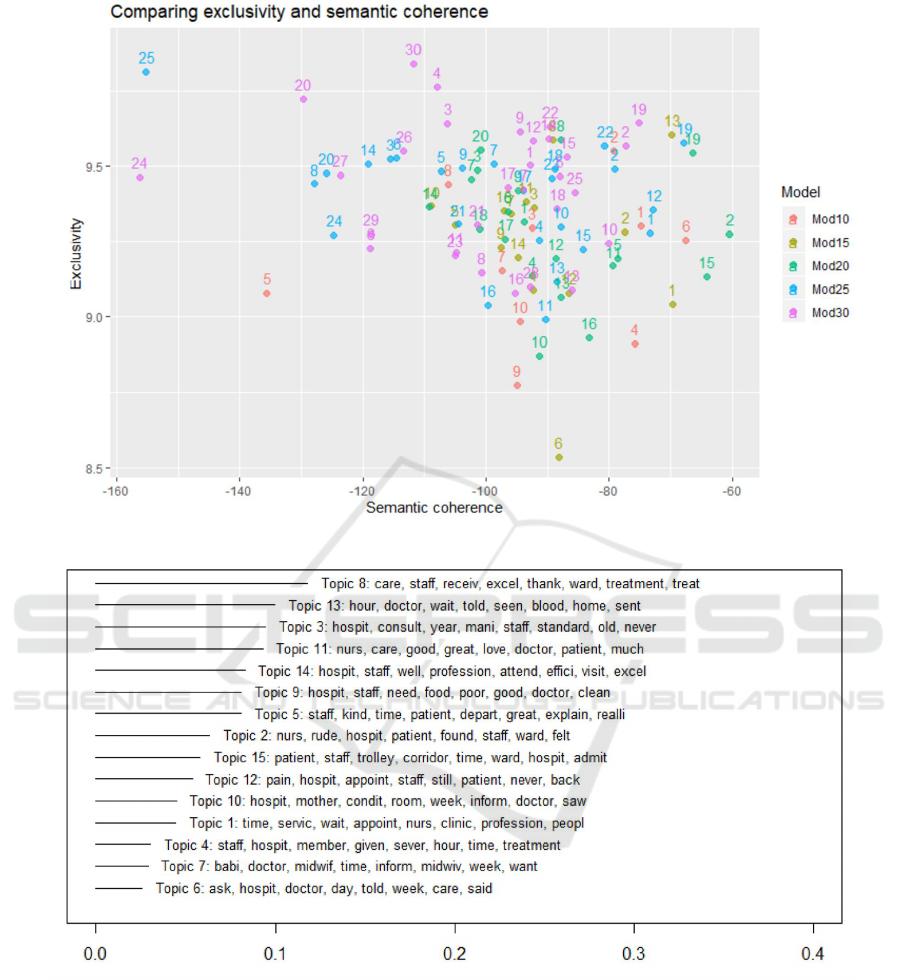
Figure 4: Semantic coherence and exclusivity of STM models.
Figure 5: Expected topic proportions over corpus.
to evaluate the relative degree of influence of senti-
ment on of hospitals service quality aspects. For ex-
ample, the five most negative Topic of are (1) Infor-
mation Exchange with Patient/Family (Topic 13) with
highest power of negative influence; (2) Communica-
tion Skills (Topic 2); (3) A&E/Admission (Topic 12),
(4) Waiting Time (Topic 4) and (5) Patient-Focusing
Service (Topic 6). In turn two most positive topics are
(1) Service Rapidness (Topic 14); (2) Personnel Reli-
ability/Treatment (Topic 8). Knowledge about Topics
with a positive and negative impact of comments Sen-
timent allow to indicate the strength of patient satis-
faction/dissatisfaction with the hospitals service qual-
ity.
Fourth, the power of Time influence on positive
and negative Topics dynamics (from 2018 to 2019)
using the STM model (with Year and Sentiment as
a Covariates) should be performed. In terms of the
Data Science in Economics Education: Examples and Opportunities
557

Table 2: Topics labels.
No Topics label Topic keywords Topic pro-
portion, %
1 Appointment Time Reliability time, service, wait, appoint, nurses, clinic, profession 4.47
2 Communication Skills nurses, rude, hospital, patient, found, staff, ward 6.34
3 Service Standards hospital, consult, year, many, staff, standard, old 9.45
4 Waiting Time staff, hospital, member, given, sever, hour, time 3.03
5 Staff Feedback/Explanation staff, kind, time, patient, depart, great, explain 8.09
6 Patient-Focusing Service ask, hospital, doctor, day, told, week, care 2.56
7 Maternity Unit/Care baby, doctor, midwife, time, inform, midwife, week 2.89
8 Personnel Reliability / Treatment scare, staff, receive, excel, thank, ward, treatment 11.81
9 Food Service hospital, staff, need, food, poor, good, doctor 8.10
10 Hospital Environment hospital, mother, conditions, room, week, inform, doctor 4.48
11 Care and Recovery nursed, care, good, great, love, doctor, patient 9.29
12 A&E/Admission pain, hospital, appoint, staff, still, patient, never 5.37
13 Information Exchange with Pa-
tient/Family
hour, doctor, wait, told, seen, blood, home 9.99
14 Service Rapidness hospital, staff, well, profession, attend, efficiency, visit 8.31
15 Ward/Hospital’s Facilities patient, staff, trolley, corridor, time, ward, hospital 5.82
Figure 6: Difference in the power of Sentiment influence on topic proportion.
Influence of the Time Factor on the Service Qual-
ity, the following four groups of HSQ Topics can be
distinguished: (1) Topics causing the growth of pa-
tient satisfaction with the Service Quality over the
time: positive topics with a positive dynamic over the
time; (2) Topics causing a recession in patient satis-
faction with the hospitals service quality (HSQ) over
the time: positive topics with a negative dynamic over
the time; (3) Topics causing the growth of patient dis-
satisfaction with the HSQ over the time: negative top-
ics with a positive dynamic over the time (4) Topics
causing a recession in patient dissatisfaction with the
HSQ over the time: negative topics with a negative
dynamic over the time.
As an indicator that allows us to identify the di-
rection and growth rate (GR) of change in the level of
positive or negative comments describing the Topic,
the slope of the regression (dependence between the
proportion of Positive/Negative Aspects and Time)
will be used. The presented four charts (figure 7 a,
b, c, d) show examples of four possible types of Influ-
ence of the Time Factor on the Service Quality:
1. Positive impact on Service Quality over the time:
Service Rapidness topic characterized by growth
rate (GR=1.100763) of patient satisfaction with
the HSQ over the time (figure 7, b);
2. Worsening of Service Quality over the time: Per-
sonnel Reliability/Treatment topic characterized
by and recession (GR=0.821713) in patient sat-
isfaction with the HSQ over the time (figure 7, a);
3. Negative impact on Service Quality over the time:
AET 2020 - Symposium on Advances in Educational Technology
558
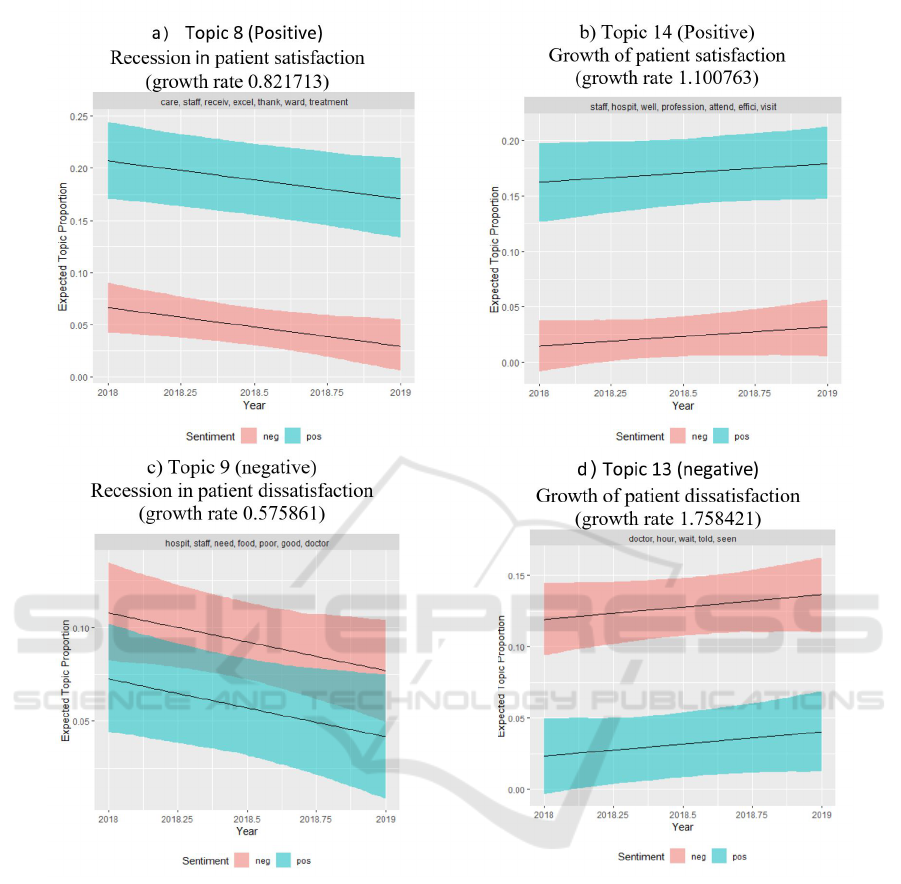
Figure 7: Examples of identification the influence of the Years Metadata.
Information Exchange with Patient/Family topic
characterized by growth (GR= 1.758421) of pa-
tient dissatisfaction with the HSQ over the time
(figure 7, d);
4. Improvement of Service Quality over the time:
Food Service topic causing a recession in cus-
tomer dissatisfaction (GR= 0.575861) with the
HSQ over the time (figure 7, c).
As a result, student could see that the largest num-
ber of aspects (37.5%) has a negative impact on the
HSQ. The highest degree of growth in patient dissat-
isfaction is characterized by A$E/Waiting Time topic.
Moreover, this growth rate is not only the largest in
the category of Negative impact, but in all analyzed
topics. The most rapid (within the whole set of top-
ics) decrease in the number of positive comments is
characterized by the aspect of Maternity Unit/Care.
The group of topics on which improvement in their
quality is noted is 25.1%. At the same time, the Hos-
pital Environment is characterized by the highest rate
of improvement. 16.7% of topics have a positive ef-
fect on the HSQ, among which Service Rapidness and
Maternity Unit/Treatment have the largest increase in
the number of positive comments.
Fifth, students may identify the influencing the
Hospital Ownership on more positively and more
Data Science in Economics Education: Examples and Opportunities
559
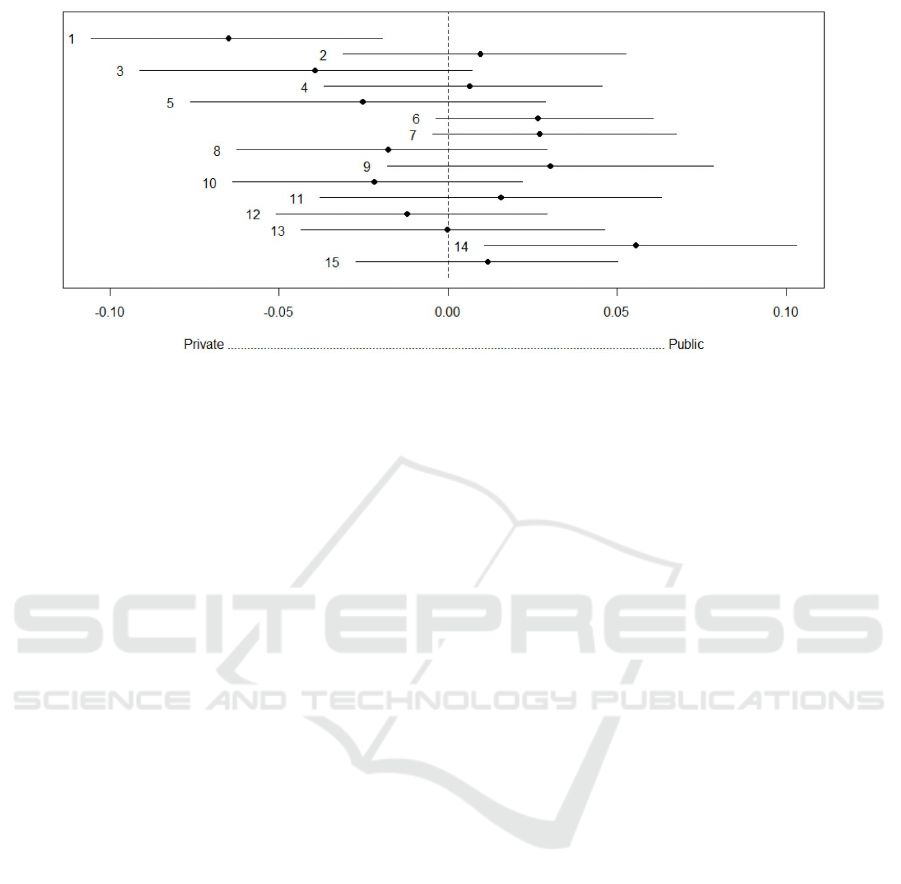
Figure 8: Difference in the power of Hospital Ownership influence on Topic Proportion.
negatively oriented HSQ aspects structure (using the
Sentiment and Hospital Ownership factors as in the
Covariates STM model). For this purpose, the fol-
lowing interpretation of the results could be proposed:
(1) the Topics, more related to Public Hospital Own-
ership according to the results of effect estimation,
in which the proportion of this Topics in comments
about Public hospitals (Hospital Ownership = Public)
is significantly higher than in comments about Private
hospitals and vice versa; (2) the direction (positive or
negative) of Hospital Ownership influencing on HSQ.
For reaching the first purpose, the Hospital Owner-
ship effect estimation was performed for revealing
the aspects in which the proportion of the comments
about Public hospitals (Hospital Ownership = Public)
is significantly higher than comments about Private
hospitals and vice versa.
For formalization the rules for second purpose
reaching, in terms of discovering the Influence of
the Hospital Ownership on the Service Quality, the
following groups of aspects proposed to be distin-
guished: (1) Topics causing the growth the level of pa-
tients satisfaction with Service Quality in Public hos-
pitals: positive topics with a positive dynamic from
Private to Public; (2) Topics causing the growth in the
level of patients satisfaction with Service Quality in
Private hospitals: positive topics with a positive dy-
namic from Public to Private; (3) Topics causing the
growth the level of patients dissatisfaction with Ser-
vice Quality in Public hospitals: negative topics with
a positive dynamic from Private to Public; (4) Topics
causing the growth in the level of patients dissatisfac-
tion with Service Quality in Private hospitals: neg-
ative topics with a positive dynamic from Public to
Private.
According to the results of our experiment, 8 Top-
ics are more associated with Public Hospitals (right
side of figure 8), and 6 Topics are more associated
with Private Hospitals (left side of figure 8), and one
topic (Topic 13) is for both types of hospitals. Based
on received results, we can conclude that the four top-
ics (one positive and 3 negative), which more char-
acterize the Public Hospital Ownership are (1) Ser-
vice Rapidness (positive); (2) Food Service (negative)
(3) Maternity Unit/Care (negative) and (4) Patient-
Focusing Service (negative). In turn five Aspects,
which more characterize the Private Hospital Owner-
ship (two positive and two negative) are (1) Appoint-
ment Time Reliability (negative); (2)Service Stan-
dards (positive); (3) Staff Feedback/Explanation (pos-
itive) and (4) Hospital Environment (negative).
Thus, this example of the use of STM modeling
in teaching students shows how versatile and in-depth
research can be carried out using data science. Pre-
sented examples demonstrate the nature of tasks and
approaches which could develop students’ technical
and research skills in the public perception analysis.
Such approaches also allow students to gain practical
experience in the study and interpretation the influ-
ence of additional metadata, characterizing the com-
ments authors, on differences in their opinions about
events, companies, goods, and services.
6 DATA SCIENCE STUDY
PROGRAMS IN ECONOMICS
FIELD
Classical methods of statistical analysis, modeling
methods, and data mining are used in economics. The
analysis of data in these areas is aimed at the study of
AET 2020 - Symposium on Advances in Educational Technology
560

Table 3: Data Science courses and programs for economics at top-20 universities.
University Location Programs, courses
Massachusetts Institute United States MicroMasters Program in Data, Economics,
of Technology (MIT) and Development; Policy Computer Science,
Economics and Data Science – course
Stanford University United States M.S. in Statistics: Data Science; Tackling Big
Questions Using Social Data Science – course
Harvard University United States Data Science for Business – course;
Using Big Data Solve Economic
and Social Problems – course
California Institute United States Business Analytics – course
of Technology
University of Oxford United Kingdom MSc in Social Data Science
ETH Zurich - Swiss Federal Switzerland Data Science in Techno-Socio-Economic
Institute of Technology Systems – course
University of Cambridge United Kingdom Economics: Data Science and Policy – course
Imperial College London United Kingdom MSc Business Analytics
University of Chicago United States Economic Policy Analysis – course
UCL United Kingdom Economics and Statistics BSc;
Social Sciences with Data Science BSc
National University Singapore Master of Science in Business Analytics
of Singapore
Princeton University United States Statistics and Machine Learning – course
Nanyang Technological Singapore Master of Science in Analytics
University
EPFL Switzerland Master’s program in Data science
Tsinghua University China (Mainland) Master’s Program in Data Science
University of Pennsylvania United States Master of Information Systems Management,
Business Intelligence and Data Analytics;
MS in Information Technology,
Business Intelligence and Data Analytics;
Online Master of Science in Business Analytics
Yale University United States Applied Econometrics: Politics, Sports,
Microeconomics; Applied Econometrics:
Macroeconomic and Finance Forecasting
Cornell University United States Introduction to Data Science – course
Columbia University United States Data Science for Social Good –
summer program
The University of Edinburgh United Kingdom Statistics with Data Science MSc
causation. In economics, current issues include policy
development, determining the impact of a decision,
long-term and short-term planning and forecasting,
choosing the best solution from many possible, and
many others. Drawing conclusions is also important
in economics. In addition, the modern economy and
finance are characterized using big data, so it is not al-
ways possible to use classical methods. Therefore, the
methods of data science are precisely those methods
that should be used in economics, which gives pos-
itive results and effect. Data Science methods were
first used in economic research and gradually pene-
trated into practice. Today, economics need special-
ists who have knowledge in these areas and are able
to apply Data Science methods. In response to this
market need, universities have begun to implement
Data Science courses and programs for students of
economics. The table 3 presents the courses and pro-
grams of the top 20 universities in the world.
A study programs in economic field in Ukrainian
universities has shown that Data Science courses and
programs are still being introduced in Ukraine. Cur-
rently, there are separate programs for studying Data
Science, mainly for computer science. Therefore, we
believe that the prospects that Data Science opens
for modern economists necessitate the introduction of
Data Science in Economics Education: Examples and Opportunities
561

courses and programs in Data Science.
7 CONCLUSIONS
Data science annually extends to more and more ar-
eas is used in various areas of research, in society,
and in business processes. Businesses and govern-
ments are making huge investments in this area. Ed-
ucation, accordingly, must keep pace with the times
and teach students new modern technologies. How-
ever, as research has shown, the process of studying
Data science for economists is at an early stage. Lead-
ing universities are gradually introducing new courses
and programs to study Data science in economics, but
this phenomenon has not yet become widespread and
needs to be developed.
As an example of the implementation of Data
science methods, we have shown the use of STM-
modeling in teaching students. The application of
such approaches promotes the development of tech-
nology and research skills of students, demonstrates
work with big data, and allows to gain experience
in studying and interpreting the influence of addi-
tional metadata characterizing the authors’ comments
on differences in their opinions about events, compa-
nies, goods, and services.
The described methods and algorithms are just
some of the basics of modeling and analysis of eco-
nomic processes. There are many examples of how
all these methods can be used in education. For ex-
ample, using time series analysis, we could predict
the future value of a cryptocurrency, using regression
models, we could determine customer loyalty or the
likelihood of customer insolvency, and so on. Today,
there are many more algorithms that can be applied in
economics.
Education must meet the modern development of
the digital economy, digital society, innovation, and
creative entrepreneurship. The use of Data science in
education should be multi-platform, ie used not only
in the study of the subject but in the teaching of all
subjects, interaction of students with each other and
with teachers, real experts, research, and individual
learning.
REFERENCES
Ausloos, M., Cerqueti, R., and Mir, T. A. (2017). Data
science for assessing possible tax income manipula-
tion: The case of Italy. Chaos, Solitons & Fractals,
104:238–256.
Babenko, V., Panchyshyn, A., Zomchak, L., Nehrey, M.,
Artym-Drohomyretska, Z., and Lahotskyi, T. (2021).
Classical machine learning methods in economics re-
search: Macro and micro level examples. WSEAS
Transactions on Business and Economics, (18):209–
217.
Balabay, R. and Chernonog, E. (2007). Alteration on the
surface of the pore walls of the porous silicon under
high temperature ageing: Computer simulation. Radi-
ation Measurements, 42(4-5):739–741.
Bielinskyi, A., Khvostina, I., Mamanazarov, A., Matviy-
chuk, A., Semerikov, S., Serdyuk, O., Solovieva, V.,
and Soloviev, V. (2021). Predictors of oil shocks.
Econophysical approach in environmental science.
IOP Conference Series: Earth and Environmental Sci-
ence, 628(1):012019.
Blei, D. M. (2012). Probabilistic topic models. Communi-
cations of the ACM, 55(4):77–84.
Blei, D. M., Ng, A. Y., and Jordan, M. I. (2003). La-
tent dirichlet allocation. Journal of Machine Learning
Research, 3:993–1022. https://www.jmlr.org/papers/
volume3/blei03a/blei03a.pdf.
Brooks, C., Hoepner, A. G. F., McMillan, D., Vivian, A.,
and Simen, C. W. (2019). Financial data science:
the birth of a new financial research paradigm com-
plementing econometrics? The European Journal of
Finance, 25(17):1627–1636.
Brunner, R. J. and Kim, E. J. (2016). Teaching data science.
Procedia Computer Science, 80:1947–1956.
Cao, L. (2017). Data science: a comprehensive overview.
ACM Computing Surveys, 50(3):1–42.
Chang, J. (2015). lda: Collapsed Gibbs sampling methods
for topic models. https://rdrr.io/cran/lda/.
Chen, H., Chiang, R. H. L., and Storey, V. C. (2012).
Business intelligence and analytics: From big data
to big impact. MIS Quarterly, 36(4):1165–1188.
http://www.jstor.org/stable/41703503.
Danylchuk, H., Chebanova, N., Reznik, N., and Vitkovskyi,
Y. (2019). Modeling of investment attractiveness
of countries using entropy analysis of regional stock
markets. Global Journal of Environmental Science
and Management, 5(Special Issue):227–235. https:
//www.gjesm.net/article 35558.html.
De Prado, M. L. (2018). Advances in financial machine
learning. John Wiley & Sons.
Derbentsev, V., Matviychuk, A., Datsenko, N., Bezko-
rovainyi, V., and Azaryan, A. (2020). Machine learn-
ing approaches for financial time series forecasting.
CEUR Workshop Proceedings, 2713:434–450.
DiMaggio, P., Nag, M., and Blei, D. (2013). Exploiting
affinities between topic modeling and the sociolog-
ical perspective on culture: Application to newspa-
per coverage of US government arts funding. Poetics,
41(6):570–606.
Dimitrov, I., Davydenko, N., Lotko, A., and Dimitrova, A.
(2019). Comparative study of main determinants of
entrepreneurship intentions of business students. In
2019 International Conference on Creative Business
for Smart and Sustainable Growth (CREBUS), pages
1–4. IEEE.
AET 2020 - Symposium on Advances in Educational Technology
562

George, G., Osinga, E. C., Lavie, D., and Scott, B. A.
(2016). Big data and data science methods for man-
agement research. The Academy of Management Jour-
nal, 59(5):1493–1507.
Griffiths, T. L. and Steyvers, M. (2004). Finding scientific
topics. Proceedings of the National Academy of Sci-
ences, 101(suppl 1):5228–5235.
Guryanova, L., Bogachkova, L., Zyma, O., Novosel, M.,
Poluektova, N., and Gvozdytskyi, V. (2020a). Mod-
els of estimation and analysis of a systemic risk in
the banking sector. In 2020 IEEE 2nd International
Conference on System Analysis Intelligent Computing
(SAIC), pages 1–6.
Guryanova, L., Yatsenko, R., Dubrovina, N., and Babenko,
V. (2020b). Machine learning methods and models,
predictive analytics and applications. CEUR Work-
shop Proceedings, 2649:1–5.
Hrabovskyi, Y., Babenko, V., Al’Boschiy, O., and Gerasi-
menko, V. (2020). Development of a Technology for
Automation of Work with Sources of Information on
the Internet. WSEAS Transactions on Business and
Economics, 17(25):231–240.
Hu, N., Zhang, T., Gao, B., and Bose, I. (2019). What
do hotel customers complain about? text analysis
using structural topic model. Tourism Management,
72:417–426.
Ignatyuk, A., Liubkina, O., Murovana, T., and Magome-
dova, A. (2020). FinTech as an innovation challenge:
From big data to sustainable development. E3S Web
of Conferences, 166:13027.
Ilchuk, M., Davydenko, N., and Nehoda, Y. (2019). Sce-
nario modeling of financial resources at the enterprise.
Intellectual Economics, 13(2).
James, G., Witten, D., Hastie, T., and Tibshirani, R. (2013).
An introduction to statistical learning: with Applica-
tions in R, volume 112 of Springer Texts in Statistics.
Springer, New York.
James, T. L., Calderon, E. D. V., and Cook, D. F. (2017).
Exploring patient perceptions of healthcare service
quality through analysis of unstructured feedback. Ex-
pert Systems with Applications, 71:479–492.
Kaminskyi, A., Nehrey, M., and Rizun, N. (2020). The im-
pact of COVID-induced shock on the risk-return cor-
respondence of agricultural ETFs. CEUR Workshop
Proceedings, 2713:204–218.
Klymenko, N., Nosovets, O., Sokolenko, L., Hryshchenko,
O., and Pisochenko, T. (2019). Off-balance
accounting in the modern information sys-
tem of an enterprise. Academy of Account-
ing and Financial Studies Journal, 23(2).
https://www.abacademies.org/articles/offbalance-
accounting-in-the-modern-information-system-of-an-
enterprise-8403.html.
Kobayashi, V. B., Mol, S. T., Berkers, H. A., Kismihok, G.,
and Den Hartog, D. N. (2018a). Text classification for
organizational researchers: A tutorial. Organizational
research methods, 21(3):766–799.
Kobayashi, V. B., Mol, S. T., Berkers, H. A., Kismih
´
ok, G.,
and Den Hartog, D. N. (2018b). Text mining in orga-
nizational research. Organizational research methods,
21(3):733–765.
Kuzmenko, O. V., Lieonov, S. V., and Boiko, A. O.
(2020). Data mining and bifurcation analysis of the
risk of money laundering with the involvement of fi-
nancial institutions. Journal of International Studies,
13(3). https://www.jois.eu/files/22 871 Kuzmenko%
20et%20al.pdf.
L
´
opez, A., Detz, A., Ratanawongsa, N., and Sarkar, U.
(2012). What patients say about their doctors online:
a qualitative content analysis. Journal of general in-
ternal medicine, 27(6):685–692.
Matviychuk, A., Strelchenko, I., Vashchaiev, S., and Ve-
lykoivanenko, H. (2019). Simulation of the crisis con-
tagion process between countries with different lev-
els of socio-economic development. CEUR Workshop
Proceedings, 2393:485–496.
National Academies of Sciences, Engineering, and
Medicine, Division on Engineering and Physical Sci-
ences, Division of Behavioral and Social Sciences and
Education, Computer Science and Telecommunica-
tions Board, Board on Mathematical Sciences and An-
alytics, Committee on Applied and Theoretical Statis-
tics, Board on Science Education, and Committee on
Envisioning the Data Science Discipline: The Under-
graduate Perspective (2018). Data science for under-
graduates: Opportunities and options. The National
Academies Press, Washington, DC.
Nehrey, M. and Hnot, T. (2017). Using recommendation
approaches for ratings matrixes in online marketing.
Studia Ekonomiczne, (342):115–130.
Nehrey, M., Kaminskyi, A., and Komar, M. (2019). Agro-
economic models: a review and directions for re-
search. Periodicals of Engineering and Natural Sci-
ences, 7(2):702–711. http://pen.ius.edu.ba/index.php/
pen/article/view/579.
Nosratabadi, S., Mosavi, A., Duan, P., Ghamisi, P., Filip,
F., Band, S. S., Reuter, U., Gama, J., and Gandomi,
A. H. (2020). Data science in economics: comprehen-
sive review of advanced machine learning and deep
learning methods. Mathematics, 8(10):1799.
Ojo, A. and Rizun, N. (2020). Structural and temporal topic
models of feedbacks on service quality–a path to the-
ory development? In Americas Conference on In-
formation Systems (AMCIS 2020). Healthcare Infor-
matics & Health Information Tech (SIGHealth), vol-
ume 15.
Oliskevych, M., Beregova, G., and Tokarchuk, V.
(2018). Fuel consumption in Ukraine: Evi-
dence from vector error correction model. Inter-
national Journal of Energy Economics and Policy,
8(5). https://www.econjournals.com/index.php/ijeep/
article/view/6825/3925.
Oliskevych, M. and Lukianenko, I. (2019). Labor force
participation in Eastern European countries: nonlinear
modeling. Journal of Economic Studies, 46(6):1258–
1279.
Parish, E. J. and Duraisamy, K. (2016). A paradigm for
data-driven predictive modeling using field inversion
and machine learning. Journal of Computational
Physics, 305:758–774.
Data Science in Economics Education: Examples and Opportunities
563

Patriarca, R., Di Gravio, G., and Costantino, F. (2017). A
Monte Carlo evolution of the Functional Resonance
Analysis Method (FRAM) to assess performance vari-
ability in complex systems. Safety science, 91:49–60.
Perevozova, I., Babenko, V., Krykhovetska, Z., and Popa-
dynets, I. (2020). Holistic approach based assessment
of social efficiency of research conducted by higher
educational establishments. E3S Web of Conferences,
166:13022.
Pr
¨
ufer, J. and Pr
¨
ufer, P. (2018). Data science for institutional
and organizational economics. Technical report.
Rizun, N. and Shmelova, T. (2017). Decision-making mod-
els of the human-operator as an element of the socio-
technical systems. In Strategic Imperatives and Core
Competencies in the Era of Robotics and Artificial In-
telligence, pages 167–204. IGI Global.
Roberts, M. E., Stewart, B. M., and Airoldi, E. M. (2016).
A model of text for experimentation in the social sci-
ences. Journal of the American Statistical Associa-
tion, 111(515):988–1003.
Roberts, M. E., Stewart, B. M., and Tingley, D. (2019). Stm:
An R package for structural topic models. Journal of
Statistical Software, 91(1):1–40.
Roberts, M. E., Stewart, B. M., Tingley, D., Airoldi, E. M.,
et al. (2013). The structural topic model and applied
social science. In Advances in neural information pro-
cessing systems workshop on topic models: compu-
tation, application, and evaluation, volume 4, pages
1–20. Harrahs and Harveys, Lake Tahoe.
Roberts, M. E., Stewart, B. M., Tingley, D., Lucas, C.,
Leder-Luis, J., Albertson, B., Gadarian, S., and Rand,
D. (2014). Topic models for open ended survey re-
sponses with applications to experiments. American
Journal of Political Science, 58:1064–82.
Robinson, S. D. (2019). Temporal topic modeling applied
to aviation safety reports: A subject matter expert re-
view. Safety science, 116:275–286.
Sharma, R. D., Tripathi, S., Sahu, S. K., Mittal, S., and
Anand, A. (2016). Predicting online doctor ratings
from user reviews using convolutional neural net-
works. International Journal of Machine Learning
and Computing, 6(2):149.
Shi, Y., Zhu, J., and Charles, V. (2020). Data science and
productivity: A bibliometric review of data science
applications and approaches in productivity evalua-
tions. Journal of the Operational Research Society,
72(5):975–988.
Shoro, A. G. and Soomro, T. R. (2015). Big data analysis:
Apache spark perspective. Global Journal of Com-
puter Science and Technology: C Software & Data
Engineering, 15(1):7–14.
Soloviev, V. and Belinskiy, A. (2019). Complex systems
theory and crashes of cryptocurrency market. Com-
munications in Computer and Information Science,
1007:276–297.
Soloviev, V., Serdiuk, O., Semerikov, S., and Kiv, A.
(2020a). Recurrence plot-based analysis of financial-
economic crashes. CEUR Workshop Proceedings,
2713:21–40.
Soloviev, V. N., Bielinskyi, A. O., and Kharadzjan, N. A.
(2020b). Coverage of the coronavirus pandemic
through entropy measures. CEUR Workshop Proceed-
ings, 2832:24–42.
Volkova, N., Rizun, N., and Nehrey, M. (2019). Data sci-
ence: Opportunities to transform education. CEUR
Workshop Proceedings, 2433:48–73.
Voronenko, I., Nehrey, M., Kostenko, S., Lashchyk, I., and
Niziaieva, V. (2021). Advertising strategy manage-
ment in Internet marketing. Journal of Information
Technology Management, 13(Special Issue):35–47.
Voronenko, I., Skrypnyk, A., Klymenko, N., Zherlitsyn,
D., and Starychenko, Y. (2020). Food security risk
in Ukraine: assessment and forecast. Agricultural
and Resource Economics: International Scientific E-
Journal, 6(4):63–75.
Wallace, B. C., Paul, M. J., Sarkar, U., Trikalinos, T. A., and
Dredze, M. (2014). A large-scale quantitative analy-
sis of latent factors and sentiment in online doctor re-
views. Journal of the American Medical Informatics
Association, 21(6):1098–1103.
Xiong, J., Yu, G., and Zhang, X. (2017). Research on gov-
ernance structure of big data of civil aviation. Journal
of Computer and Communications, 5(5):112–118.
Zelinska, S. (2020). Machine learning: Technologies and
potential application at mining companies. E3S Web
of Conferences, 166:03007.
AET 2020 - Symposium on Advances in Educational Technology
564
