
Correlation Analysis between Total Chlorophyll Content and Color
Intensity in Bambu duri (Bambusa blumeana) Leaf Extract
Ni Made Sri Wahyuni, Luh Putu Wrasiati
*
and Amna Hartiati
Department of Agroindustrial Technology, Faculty of Agricultural Technology, Udayana University,
Campus Bukit Jimbaran Street, Badung, Indonesia
Keywords: Bambusa Blumeana, Total Chlorophyll, Correlation, Color Intensity.
Abstract: Bambu duri leaves are known to contain many bioactive compounds, one of which is chlorophyll. Chlorophyll
is a green pigment found in leaves which is often used as a natural food colorant. This study aims to: (i)
determine the effect of temperature and maceration time on total chlorophyll content and color intensity of
bambu duri leaf extract, (ii) determine the correlation between total chlorophyll content and color intensity
(L*a*b*). This study used a factorial randomized block design with two factors. The first factor is the
maceration temperature consisting of 30, 45, and 60°C. The second factor is the maceration time consisting
of 24, 36, and 48 hours. Data were analyzed by analysis of variance and continued with the Tukey's test.
Correlation analysis using Pearson correlation analysis. The results showed that the interaction between
temperature and maceration time had a very significant effect on the total chlorophyll content and color
intensity (L*a*b*) of the bambu duri leaf extract. Correlation analysis between total chlorophyll content and
color intensity (L*a*b*) showed r = -0.989, r = -0.983, and r = 0.981. These results indicate that there is a
very strong relationship between total chlorophyll content and color intensity (L*a*b*) of bambu duri leaf
extract.
1 INTRODUCTION
Food coloring is a type of food additive that is often
added to food products to improve product quality.
Types of food coloring based on the source can be
divided into two, there are synthetic and natural dyes
(Winarno, 1992). Synthetic dyes are obtained through
chemical reactions (sulfuric acid or nitric acid), while
natural dyes are obtained from plants, animals, and
minerals that have color pigments. Color pigments in
plants can be found in the roots, rhizomes, wood,
fruit, seeds, flowers, and leaves.
Bambu duri (Bambusa blumeana) leaves are part
of the bamboo plant which has the characteristics of
small leaves (9.5-15 cm long and 2.5-4.5 cm wide)
and green. The green color of the leaves indicates that
bambu duri leaves contain a green pigment called
chlorophyll and has the potential to be used as a
source of natural dyes. According to Aryanti et al.
(2016), chlorophyll is a green pigment found in
chloroplasts together with carotene and xanthophyll
in all living things capable of photosynthesis.
Regulation of the Head of National Food and Drug
Administration of Republic Indonesia Number 37 of
2013 about the Maximum Limit for Use of Colored
Food Additives, states that chlorophyll and its
derivative compounds are included as natural food
additives so that they are safe for consumption. Apart
from being a natural dye, chlorophyll compounds can
also be used as potential antioxidants because they
have effective activity in fighting lipid peroxidation,
DNA degradation, and overcoming cases of anemia
(Banu and Devi, 2015 and Vankova et al., 2018).
The potential chlorophyll content of bambu duri
leaves to be used as a natural dye can be determined
from the level of color intensity. According to
Lukitasari et al. (2017), color intensity shows the
strength of the color when the color contained in the
extract is applied to the product. Chlorophyll content
can be obtained through solvent extraction, which is
then analyzed using a spectrophotometer, while the
color intensity level can be analyzed using the
CIELAB color system which consists of three
variables, namely L* (brightness), a* (redness), and
b* (yellowish).
The maceration extraction method is a method
that can be used to obtain the chlorophyll content
contained in bambu duri leaves. The maceration
Wahyuni, N., Wrasiati, L. and Hartiati, A.
Correlation Analysis between Total Chlorophyll Content and Color Intensity in Bambu duri (Bambusa blumeana) Leaf Extract.
DOI: 10.5220/0010547000003108
In Proceedings of the 6th Food Ingredient Asia Conference (6th FiAC 2020) - Food Science, Nutrition and Health, pages 145-151
ISBN: 978-989-758-540-1
Copyright
c
2022 by SCITEPRESS – Science and Technology Publications, Lda. All rights reserved
145

method was chosen because it is a simple method, can
produce the maximum amount of extract, and did not
damage the compounds contained due to the use of
high temperatures. Chlorophyll is a compounds that
is easily degraded due to certain conditions, such as
heat, light, oxygen, and acidic conditions (Heaton and
Marangoni, 1996). The color of the extract produced
can affect the main characteristics in determining
product acceptance, therefore it is important to
prevent and reduce chlorophyll degradation during
the extraction process. Optimization of the use of
temperature and time during the extraction process is
an effort to reduce chlorophyll degradation and
increase the recovery of color pigments. Based on the
explanation above, it was necessary to do a research
about the effect of temperature and maceration time
on total chlorophyll content and color intensity of
bambu duri leaf extracts and also correlation analysis
between total chlorophyll content and color intensity.
2 MATERIALS AND METHODS
2.1 Materials
Bambu duri (Bambusa blumeana) leaves obtained
from Mengwi, Badung, Bali. Some characteristics of
bamboo duri leaves that being used are young leaves
in 1-3 positions which are counted from the shoots,
have green color, and have a measurement of ± 9 cm
× 2 cm. Chemicals that being used are acetone pa
(Merck), 96 percent technical ethanol (Bratachem),
and aquades (One Med).
2.2 Equipments
Oven (Blue M), blender (Philips), analytical balance
(Shimadzu), vacuum rotary evaporator (IKA RV 10
digital), spectrophotometer (Biochrome SN 133467),
vortex (Barnstead Thermolyne Maxi Mix II),
micropipette (Socorex), sieve 60 mesh (Retsch), color
reader (Accuprobe HH-06), and glassware.
2.3 Preparation of Materials
Bambu duri leaves that have been sorted are cleaned
first, then dried in an oven at a temperature of 50 ±
2°C for 6 hours or until the leaves are easily crushed.
Then the dried leaves are cut into pieces and blend
until smooth. The finely powdered bambu duri leaves
are then sieved with a 60 mesh sieve. Materials that
did not pass the sieve are blended back to pass the 60
mesh sieve. The water content of bambu duri leaf
powder is around 11.06%.
Bambu buri leaf sample extraction was carried out
using the maceration method. A total of 25 grams of
bambu duri leaf powder is put into a dark glass bottle,
then 250 mL of 96 percent ethanol solvent is added.
The comparison of bambu duri leaf powder with
ethanol solvent is 1:10 (w /v). The maceration process
was carried out at temperatures (30 ± 2˚C, 45 ± 2 ° C,
and 60 ± 2˚C) and time (24 hours, 36 hours, and 48
hours) according to the treatment. During the
maceration process, the shaking process is carried out
manually every 6 hours for 5 minutes. After the
maceration process, the filtering process was carried
out using filter paper twice. The first filtering used
coarse filter paper which then produces filtrate I and
pulp. The dregs were then added with 50 mL of
solvent, shaken for 5 minutes, and then filtered using
coarse filter paper to produce filtrate II. Filtrates I and
II were then mixed and filtered again using Whatman
filter paper no.1. The filtrate is then evaporated with
a vacuum rotary evaporator at a temperature of 40˚C
with a speed of 100 rpm and a pressure of 100 mBar
until all the ethanol evaporated.
2.4 Chlorophyll Analysis
Chlorophyll analysis in this study used a modified
method according to Nollet (2004). The sample of
bambu duri leaf extract was weighed as much as 0.01
grams, then diluted to 5 mL with 80 percent acetone.
Then from the dilution as much as 0.5 mL was taken
and placed in a 5 mL measuring flask. Furthermore,
80 percent of acetone is added up to the mark limit.
Chlorophyll content was calculated by measuring the
absorbance at 645 and 663 nm. Calculation of
chlorophyll content is carried out with the formula:
Total chlorophyll (ppm) = 20.2 A
645
nm + 8.02 A
663
nm
Chlorophyll a (ppm) = 12.7 A
663
nm - 2.69 A
645
nm
Chlorophyll b (ppm) = 22.9 A
645
nm - 4.68 A
663
nm
2.5 Color Intensity Analysis
The color intensity analysis in this study used the
Weaver method (1996). The measurement of the
color intensity of the bambu duri leaf extract was
carried out using the L*a*b* parameter. The extract
sample was placed on a petri dish then the color
reader was turned on and calibrated. The parameter
L* represents the level of brightness and changes
between 0 (black) to 100 (white), parameter a*
represents the level of greenness (-a*) or redness
(+a*), and parameter b* represents the level of
blueness (-b*) and yellowish (+b*).
6th FiAC 2020 - The Food Ingredient Asia Conference (FiAC)
146
2.6 Statistic Analysis
The experimental data were analyzed by analysis of
variance (ANOVA) and if the treatment was
influential, it would be continued with the Tukey’s
test using Minitab 17 software. The correlation value
between chlorophyll content and color intensity was
analyzed using the Pearson correlation method in the
IBM Statistic SPSS 26 software.
3 RESULTS AND DISCUSSION
3.1 Total Chlorophyll in Bambu duri
Leaf Extract
The results showed that the treatment of temperature
and time of maceration and their interactions had a
very significant effect (P≤0.01) on the total
chlorophyll of bambu duri leaf extract. The average
value of total chlorophyll of bambu duri leaf extract
can be seen in Table 1.
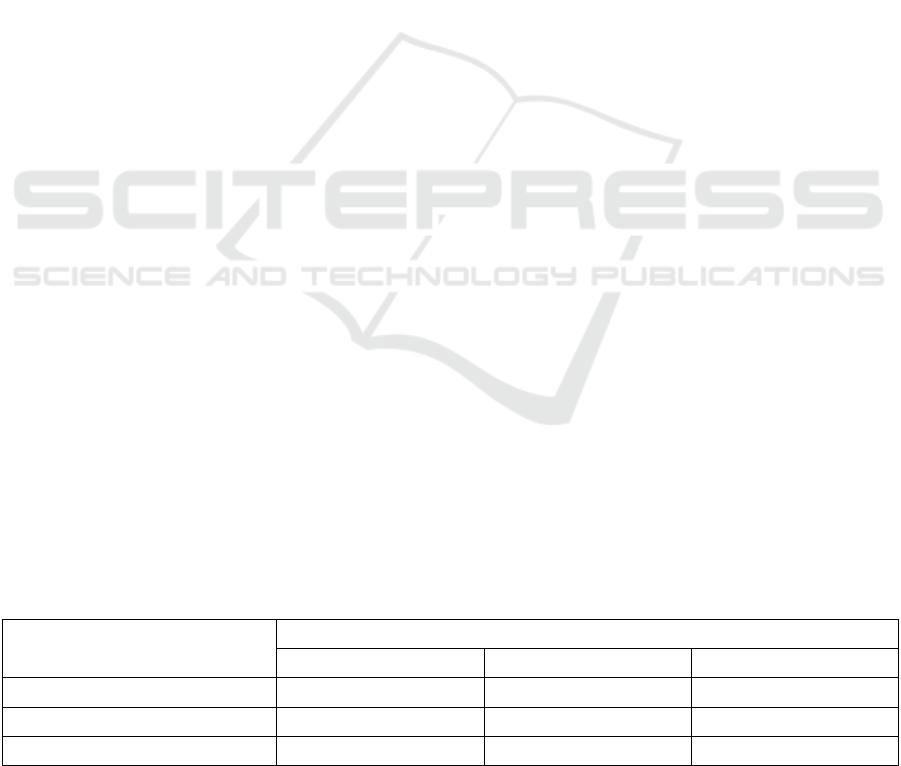
In Table 1, the highest total chlorophyll value
(ppm) of bambu duri leaf extract was found in the
maceration temperature treatment of 60°C and 36
hours of maceration time of 80,625.74 ± 436.94 ppm
and the lowest total chlorophyll was found at 30°C
maceration temperature treatment and 24 hours
maceration time as much as 49,296.76 ± 359.54 ppm.
These results indicated that the higher temperature
used, namely 60°C and the longer maceration time up
to 36 hours, the more total chlorophyll produced.
Changes in temperature during the extraction process
can affect the solubility of a compound due to the
influence of density (density is very sensitive to
temperature changes), so that the higher temperature
in the extraction process can accelerate mass transfer
and increase the extraction yield (Bimakr et al.,
2011).
Chlorophyll content in the bambu duri leaf extract
increased and achieved maximum results at a
treatment temperature of 60°C and maceration time
of 36 hours. It can be seen that in every 48 hours of
maceration time treatment, the total chlorophyll
content contained in the extract decreased. This
decrease in total chlorophyll content occurs due to
high-temperature treatment and long extraction times
which can result in a pheophytin reaction.
The pheophytin reaction is a reaction that occurs
because chlorophyll was damaged and becomes its
derivative, namely pheophytin. The existence of
high-temperature treatment for a long time can cause
the protein molecules that bind to chlorophyll to
experience denaturation so that the chlorophyll will
be released. The free chlorophyll released was
unstable, so the magnesium ion (Mg
2+
) contained in it
can be easily replaced by hydrogen ions (Fitria,
2015). The change of chlorophyll to pheophytin
causes discoloration of the extract, from originally
green to brownish-green. Beside, an increase in
temperature and the length time of maceration can
also increase the occurrence of oxidation reactions, so
that chlorophyll degrades (Hanum, 2000). The
chlorophyll oxidation reaction occurs in its functional
group, namely the isocyclic ring which forms
agglomerated chlorophyll and the rupture of the
tetrapyrrole ring to form a colorless product (Prasetyo
et al., 2012). The results of this study are in
accordance with the statement of Aryanti et al.
(2016), which states that chlorophyll dye is a
compound that is very easy to change (degrade) into
its derivatives after processing (the effect of the
extraction factor).
3.2 Color Intensity
3.2.1 Brightness Level (L*)
The results of the analysis of diversity showed the
treatment of temperature and time of maceration and
their interactions had a very significant effect (P≤0.01)
on the brightness (L*) of bambu duri leaf extract. The
L* value represents the dark to light levels in the range
of 0-100. The average brightness level (L) of bambu
duri leaf extract can be seen in Table 2.
Table 1: Average value of total chlorophyll (ppm) of bambu duri leaf extract at temperature and time of maceration treatment.
Maceration temperature (°C)
Maceration time (Hours)
(24) (36) (48)
(30±2) 49,296.76±359.54
i
55,799.06±277.29
g
54,062.67±397.77
h
(45±2) 60,309.28±480.19
f
63,010.78±670.58
d
61,398.53±639.20
e
(60±2) 70,383.91±396.35
c
80,625.74±436.94
a
71,043.78±548.93
b
Note: Different letters behind the mean value indicate a significant difference at the 5% error rate (P≤0.05). The data are
mean of two groups in each treatment.
Correlation Analysis between Total Chlorophyll Content and Color Intensity in Bambu duri (Bambusa blumeana) Leaf Extract
147
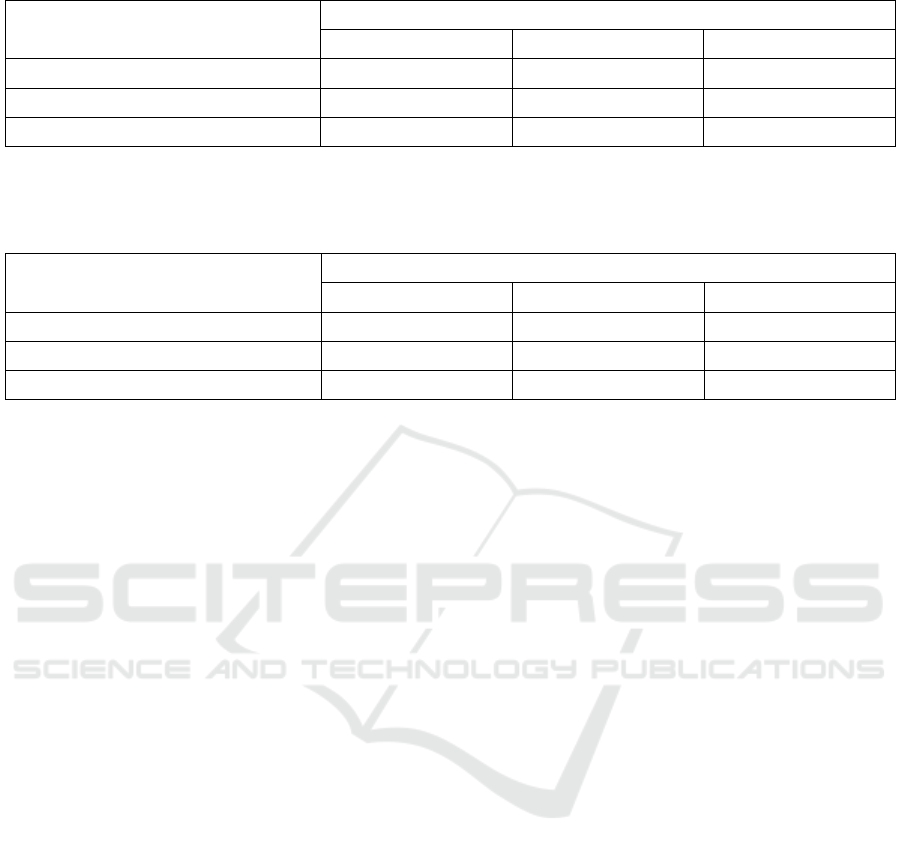
Table 2: Value of brightness level (L*) of bambu duri leaf extract at treatment temperature and time of maceration.
Maceration temperature (°C)
Maceration time (Hours)
24 36 48
30±2 20.10±0.06
a
19.35±0.14
c
19.77±0.15
b
45±2 18.90±0.08
d
18.31±0.12
f
18.71±0.06
e
60±2 17.78±0.11
g
16.89±0.05
i
17.54±0.06
h
Note: Different letters behind the mean value indicate a significant difference at the 5% error rate (P≤0.05). The data are
mean of two groups in each treatment.
Table 3: The value of redness (a*) of bambu duri leaf extract at treatment temperature and maceration time.
Maceration temperature (°C)
Maceration time (Hours)
24 36 48
30±2 -7.74±0.13
a
-8.64±0.16
c
-8.22±0.18
b
45±2 -8.97±0.11
d
-9.75±0.10
f
-9.34±0.18
e
60±2 -10.06±0.06
g
-11.25±0.18
i
-10.66±0.15
h
Note: Different letters behind the mean value indicate a significant difference at the 5% error rate (P≤0.05). The data are
mean of two groups in each treatment.
Table 2 showed the highest brightness (L*) value
of bambu duri leaf extract was found at a
temperature treatment of 30°C with the maceration
time of 24 hours, which was 20.10 ± 0.06 and the
lowest brightness (L*) was found at temperature
treatment of 60°C with a maceration time of 36
hours as much as 16.89 ± 0.05. These results
indicated that the higher temperature and maceration
time used, the lower level of brightness (L*)
produced. The resulting brightness level (L*) was
inversely proportional to the chlorophyll content in
the extract. Putri et al. (2012) stated that chlorophyll
is a green pigment that tends to be dark, therefore
the measurement results of the brightness level will
be inversely proportional to the color intensity of
chlorophyll. These results are in line with the
research of Manasika and Widjanarko (2015) which
states that the high content of extracted pigments can
cause the color of the extract to get darker, so that it
can reduce the brightness level (L*). The low-level
of brightness (L*) on the use of high temperatures
and long maceration times was also caused by the
pheophytin reaction. In this reaction, the chlorophyll
was damaged so that the color of the extract which
was originally green turns into greenish-brown
(dark). This is consistent with the statements of
Sajilata and Singhal (2006) and Gross (1991) which
state that color changes in pigments indicate
degradation due to exposure to temperature and light
with high intensity for a long time. This causes the
measurement result of the brightness level (L*) to
decrease.
3.2.2 Redness Level (a*)
The results of the analysis of diversity showed the
treatment of temperature and time of maceration and
their interactions had a very significant effect
(P≤0.01) on the level of redness (a*) of bambu duri
leaf extract. The value (a*) represents the green to red
color level in the range of -100 to +100. The average
value of redness (a*) in the bambu duri leaf extract
can be seen in Table 3.
Table 3 showed the highest value of redness (a*)
in the bambu duri leaf extract was at 30°C maceration
temperature and 24 hours maceration time, which is -
7.74 ± 0.13 and the lowest redness (a*) contained at
temperature treatment of 60°C and maceration time
of 36 hours as much as -11.25 ± 0.18. These results
indicate that the use of higher temperature and longer
maceration time can reduce the redness level (a*).
The degree of redness shows the color intensity from
green to red and is related to the amount of color
pigment contained in the extract. Aryanti et al. (2016)
stated that the level of redness (a*) is related to the
solubility of chlorophyll pigments, the lower
chlorophyll content in the extract, the higher level of
redness and conversely the higher chlorophyll
content, the lower redness value, and the resulting
color will be more green.
3.2.3 Yellowish Level (b*)
The results showed the treatment of temperature and
time of maceration and their interactions had a very
significant effect (P≤0.01) on the yellowing level (b*)
6th FiAC 2020 - The Food Ingredient Asia Conference (FiAC)
148
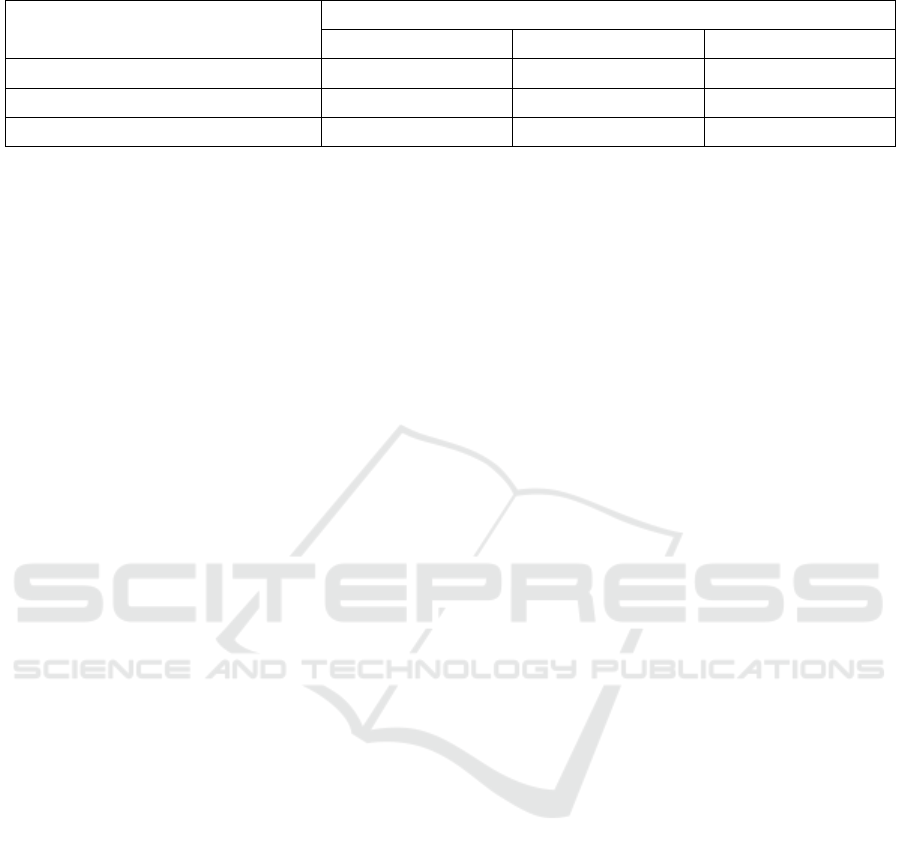
Table 4: Value of yellowish level (b *) of bambu duri leaf extract at temperature and time of maceration treatment.
Maceration temperature (°C)
Maceration Time (Hours)
24 36 48
30±2 3.09±0.05
i
3.71±0.10
g
3.21±0.05
h
45±2 3.86±0.04
f
4.46±0.09
d
4.17±0.06
e
60±2 4.83±0.06
c
5.48±0.07
a
4.95±0.09
b
Note: Different letters behind the mean value indicate a significant difference at the 5% error rate (P≤0.05). The data are
mean of two groups in each treatment.
of bambu duri leaf extract. The value (b*) represents
the blue to yellow color level in the range of -100 to
+100. The average value of yellowish level (b*) of
bambu duri leaf extract can be seen in Table 4.
Table 4 showed the average value of yellowish
level (b*) of the highest bambu duri leaf extract was
found in the maceration temperature treatment of
60°C and 36 hours of maceration time, namely 5.48 ±
0.07 and the lowest yellowish level (b*) was found at
a temperature of 30°C and a 24 hour maceration time
of 3.09 ± 0.05. These results indicated that the higher
temperature and the longer of maceration time used,
the greater degree of yellowish (b*) produced. The
value of yellowish (b*) in this study produced
positive results, it showed that the bambu duri leaf
extract has a yellow pigment. The presence of a
yellow pigment in the extract was probably due to the
degradation of chlorophyll compounds due to the use
of high temperatures for a long time. The same thing
was stated by Du et al. (2014) who states that
chlorophyll was a very sensitive compound,
chlorophyll will be very easily degraded on exposure
to temperature and light, so it will change its color to
yellowish.
In addition, the yellowish color of the bambu duri
leaf extract was also caused by the ethanol solvent
used. Based on Prasetyo et al. (2012) research,
extracted suji leaves using ethanol solvent 95% tend
to be yellowish-green. The yellowish-green color
comes from chlorophyll b, xanthophyll, and other
polar compounds (Gross, 1991).
3.3 Correlation between Total
Chlorophyll Content and Color
Intensity (L*a*b*)
Pearson's correlation coefficient was used to evaluate
the relationship between total chlorophyll content and
color intensity (L*a*b*) in bambu duri leaf extract.
Based on the data in Table 5, the correlation
coefficient value between total chlorophyll content
and color intensity showed a very strong relationship.
Sugiyono (2007) states that the very strong
relationship category is indicated by the correlation
coefficient value which is in the range of 0.80-1.00.
The highest correlation coefficient (r = -0,989) was
in the relationship between the total chlorophyll
content and the brightness level (L *), followed by the
correlation value (r = -0,983) which is in the
relationship between the total chlorophyll content and
the redness level (a*), and the lowest (r = -0,981) was
in the relationship between the total chlorophyll
content and the yellowish level (b*). The results of
this studies are almost the same as the research
conducted by Agarwal and Gupta (2018) which
received a correlation value (r = - 0.822) on the
relationship between the chlorophyll content of
spinach leaves and brightness (L*) and research by
Mazza and Oomah (1994) which obtained the result
of the correlation value (r = -0.873) on the
relationship between the chlorophyll content of peas
and the degree of redness (a*).
The resulting correlation coefficient between total
chlorophyll with brightness (L*) and redness (a*) was
negative. This indicates that the higher total
chlorophyll content, the lower the brightness (L*) and
redness (a*) levels of the extract produced. This result
was in accordance with the statement of Putri et al.
(2012) which states that chlorophyll is a green
pigment that tends to be dark, so that the
measurement results of the brightness level will be
inversely proportional to the color intensity of
chlorophyll. Meanwhile, Aryanti et al. (2016) also
stated that the level of redness was related to the
solubility of chlorophyll pigments, the lower
chlorophyll content in the extract, the higher level of
redness, and conversely the higher chlorophyll
content, the lower level of redness, and the greener
resulting color. The results of this study were not
much different from those of Putri et al. (2012) which
resulted in a correlation coefficient between
brightness (L*) and total chlorophyll of (r = -0.996).
The resulting correlation coefficient between total
chlorophyll and yellowish level (b*) was positive.
This means that the higher total chlorophyll content,
the yellowish level (b*) of the extract will also
increase. The increase between the total chlorophyll
Correlation Analysis between Total Chlorophyll Content and Color Intensity in Bambu duri (Bambusa blumeana) Leaf Extract
149
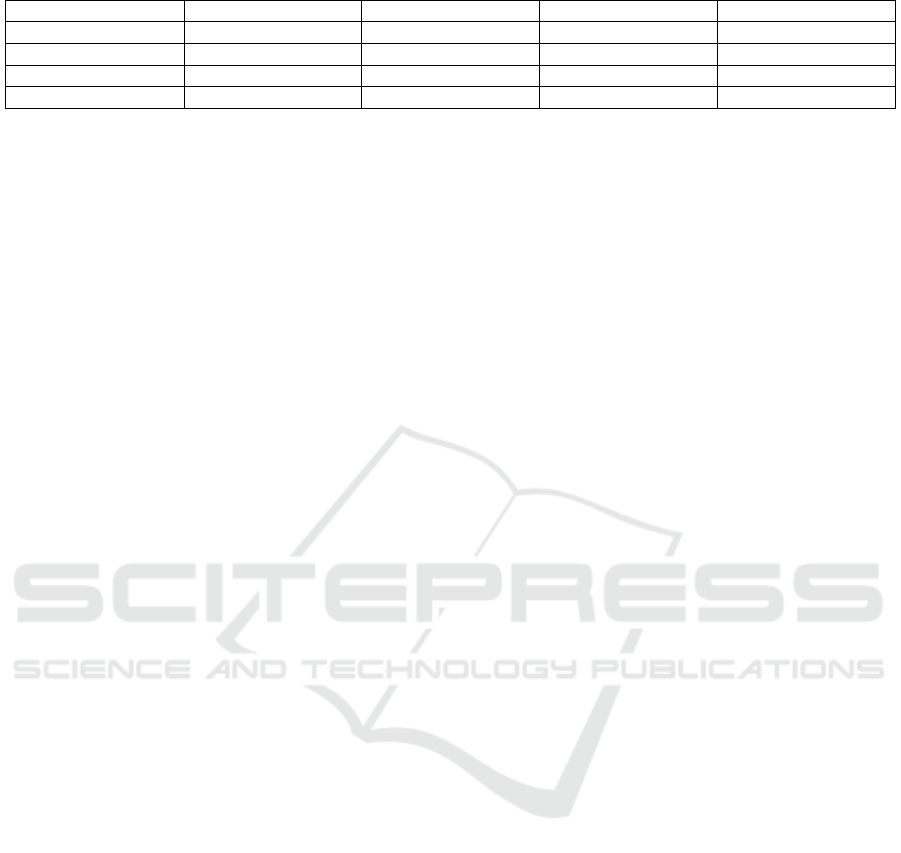
Table 5: Pearson correlation coefficient between total chlorophyll and color intensity (L*a*b*).
Total chloro
p
h
y
ll Bri
g
htness level
(
L*
)
Redness level
(
a*
)
Yellowish level
(
b*
)
Total chloro
p
h
y
ll 1 -0.989** -0.983** 0.981**
Bri
g
htness level
(
L*
)
-0.989** 1 0.996** -0.997**
Redness level (a*) -0.983** 0.996** 1 -0.993**
Yellowish level (b*) 0.981** -0.997** -0.993** 1
Note: ** Significant correlation at level P <0.01
content and the yellowish level (b*) occurs due to the
influence of temperature treatment and maceration
time which then results in the degradation of the
chlorophyll pigment. This was consistent with the
statement of Du et al. (2014) who states that
chlorophyll is a very sensitive compound, chlorophyll
will be very easily degraded on exposure to tempera-
ture and light, so it will change its color to yellowish.
There are two types of chlorophyll in plants, there
are chlorophyll a and chlorophyll b. Chlorophyll a has
a characteristic dark green (green-blue) color while
chlorophyll b has a light green (green-yellow) color.
Based on the analysis of chlorophyll a and b content
in the bambu duri leaf extract, it was found that the
average chlorophyll a content was higher (47%) than
chlorophyll b. According to Indrasti et al. (2019), the
amount or high levels of chlorophyll, especially
chlorophyll a, has implications for the appearance of
a green color in plants. The high chlorophyll a content
can also affect the rate of degradation of chlorophyll.
Schwartz et al. (2008) stated that the degradation of
chlorophyll to pheophytin in chlorophyll a can take
place 2.5-10 times faster than chlorophyll b.
Chlorophyll a degrades to pheophytin a which is gray
in color, while chlorophyll b undergoes degradation
to pheophytin b which is brown in color (Indrasti et
al., 2019). This explanation is in accordance with the
results of the research obtained, where the highest
correlation value between chlorophyll content and
color intensity is at the brightness level (L*). This
indicates that the high chlorophyll a content can
reduce the brightness (L*) of the extract because
chlorophyll a is easily degraded at high temperatures
to a darker color. In addition, the lowest correlation
value obtained between the relationship between total
chlorophyll and yellowish level (b*) can also indicate
that the amount of chlorophyll b content is less than
chlorophyll a so that the resulting correlation value is
lower than the other color intensities.
4 CONCLUSIONS
The treatment of temperature and maceration time
had a very significant effect on the total chlorophyll
content and color intensity (L*a*b*) of bambu duri
leaf extract. Increasing the maceration temperature to
60°C and the maceration time of up to 36 hours can
increase the total chlorophyll content and the
yellowish level (b*), as well as decrease the
brightness (L*) and redness (a*) values. At a
temperature of 60°C and a maceration time of 48
hours, the total chlorophyll content, brightness (L*)
and redness (a*) values decreased, while the
yellowish level (b*) values increased. Pearson
correlation analysis between total chlorophyll content
and color intensity (L*a*b*) of bambu duri leaf
extract had a very strong relationship. The correlation
value between total chlorophyll content and
brightness level (L*) was (r = -0.989), total
chlorophyll content with redness (a*) was (r = -
0.983), and total chlorophyll content with a yellowish
level (b*) was (r = -0,981).
REFERENCES
Agarwal, A. and Gupta, S. D., 2018. Assessment of spinach
seedling health status and chlorophyll content by
multivariate data analysis and multiple linear regression
of leaf image features. Computers and Electronics in
Agriculture, Volume 152, pp. 281-289.
Aryanti, N., Nafiunisa A., and Willis, F. M., 2016.
Extraction and characterization of chlorophyll from suji
(Pleomele angustifolia) leaf as natural food coloring.
Journal of Food Technology Applications, 5(4), pp.
129-135. (in Indonesia).
Banu, N. and Devi, D., 2015. Study of antioxidant activity
of chlorophyll from some medical plants. Indian
Journal of Research, 4(2), pp. 6-8.
Bimakr, M., Russly, A. R., Ganjloo, A., Saleena, F., Salleh,
L. M., Selamat, J., Hamid, A., and Zaidu, I. S. M., 2011.
Comparison of different extraction methods for the
extraction of major bioactive flavonoid compounds
from spearmint (Mentha spicata L.) leaves. Food and
Bioproducts Processing, 89(1), pp. 67–72.
Du, L., Yang, X., Song, J., Ma, Z., Zhang, Z., and Pang, X.,
2014. Characterization of the stage dependency of high
temperature on green ripening reveals a distinct
chlorophyll degradation regulation in banana fruit.
Journal of Scientia Horticulturae, Volume 180, pp. 139
-146.
6th FiAC 2020 - The Food Ingredient Asia Conference (FiAC)
150

Fitria, E. A., 2015. Utilization of Chlorophyll as Intelligent
Color Indicator Label, Thesis S2. Bogor: IPB
University. (in Indonesia).
Gross, J., 1991. Pigments in Vegetable, Chlorophylls, and
Carotenoids. Van Nostrand Reinhold: New York.
Hanum, T., 2000. Extraction and stability of natural dyes
from black glutinous rice bran (Oryza sativa glutinosa).
Journal of Technology and Food Industry, XI(1),
pp. 17-23. (in Indonesia).
Heaton, J. W., and Marangoni, A.G., 1996. Chlorophyll
degradation in processed foods and senescent
plant tissues. Trends Food Science Technology, 7(1),
pp. 8-15.
Indonesian Government, 2013. Regulation of the Head of
the Republic of Indonesia Food and Drug Supervisory
Agency Number 37 of 2013 about Maximum Limits for
Use of Food Color Additives. Jakarta: State Secretariat.
(in Indonesia).
Indrasti, D., Andarwulan, N., Purnomo, E. H., and
Wulandari, N., 2019. Chlorophyll of suji leaves:
potential and challenges of developing natural green
dyes. Indonesian Journal of Agricultural Sciences,
24(2), pp. 109-116. (in Indonesia).
Lukitasari, D. M., Indrawati, R., Chandra, R. D., Heriyanto,
and Limantara, L., 2017. Pigment microencapsulation
of red cabbage: study of color intensity and antioxidant
activity, J. Technol. and Food Industry, 3(3), pp. 1-9.
(in Indonesia).
Manasika, A. and Widjanarko, S. B., 2015. Kabocha
pumpkin carotenoid pigment extraction using
ultrasonic method (study of the ratio of ingredients,
solvents, and extraction time), Journal of Food and
Agroindustry, 3(3), pp. 928-938. (in Indonesia).
Mazza, G. and Oomah, B. D., 1994. Color evaluation and
chlorophyll content in dry green peas. Journal of Food
Quality, 17(5), pp. 381-392.
Nollet, L. M. L., 2004. Handbook of Food Analysis Vol.1.
second ed. Revised and Expanded Physical
Characterzati-ion and Nutrient Analysis. New York:
Marcel Dekker Inc.
Prasetyo, S., Sunjaya, H., and Yanuar. Y., 2012. Effect of
Suji Leaf Mass Ratio/Solvent, Temperature, and Type
of Solvent on Batched Extraction of Suji Leaf
Chlorophyll with Dispersion Resistance. Bandung:
Research Institution and Community Service,
Parahyangan Catholic University. (in Indonesia).
Putri, W. D. R., Zubaedah, E., and Sholahudin, N., 2012.
Natural dye extraction of suji leaves, study of the
effect of blanching and types of extracting materials.
Journal of Agricultural Technology, 4(1), pp. 13-24.
(in Indonesia).
Sajilata and Singhal. 2006. Isolation and stabilitation of
natural pigments for food application. Srewart
Postharvest Review, 2(5), pp. 5-11.
Schwartz, S. J., Elbe, J. H., and Giusti, M.M., Colorants. In
Fennema’s Food Chemistry, 4
th
ed. Damodaran, S.,
Parkin, K.L., Fennema OR. Roca Raton: CRC Press.
Sugiyono, 2007. Administrative Research Methods.
Bandung: Alfabeta.
Vankova, K., Markova, I., Jasprova, J., Dvorak, A.,
Subhanova, I., Zelenka, J., Novosadova, I., Vomastek,
J., Sobotka, R., Muchova, L., and Vitek, L., 2018.
Chlorophyll-mediated changes in the redox status of
pancreatic cancer cells are associated with its anticancer
effects. Oxidative Medicine and Cellular Longevity,
2018(6), pp. 1-11.
Weaver, C., 1996. The Food Chemistry Laboratory. Boca
Raton, New York, London, Tokyo: CRC Press.
Winarno, F. G., 1992. Food Chemistry and Nutrition.
Jakarta: PT. Gramedia Pustaka. (in Indonesia).
Correlation Analysis between Total Chlorophyll Content and Color Intensity in Bambu duri (Bambusa blumeana) Leaf Extract
151
