
Quality Deterioration and Shelf Life Determination of Purwaceng
Coffee based on Packaging Variation using Accelerated Shelf Life
Testing (ASLT)
Alan S. U.
1
, Endy S.
2
, Wagiman
3
and Jumeri M. W.
1
1
Lab. of Bioindustry, Department of Agroindustrial Technology, Gadjah Mada University, Indonesia
2
Lab. of System Analysis, Department of Agroindustrial Technology, Gadjah Mada University, Indonesia
3
Lab. of Waste and Byproduct Engineering, Department of Agroindustrial Technology,
Gadjah Mada University, Indonesia
Keywords: Packaging, Purwaceng Coffee, Shelf Life.
Abstract: Purwaceng coffee is a varian of coffee products that has benefits for human health. The quality of purwaceng
coffee has significantly related with their shelf life. However, many purwaceng coffee producer still predicts
the shelf life manually without scientific method, which has relatively low accuration. Therefore, many
studies have been conducted to overcome that poblem in order to extend their shelf life. Packaging-based
prediction used since that method could detemine the shelf life of the poduct adequately. The aim of this study
is to analysis quality deterioration of purwaceng coffee and determine their shelf life based packaging
variation. The packaging used were PAP 0.11, AF 0.05, PP 0.05, PP 0.03, and PE 0.03. The quality
deterioration of purwaceng coffee was measured by 6 parameters, namely water content, water activity (Aw),
weight, pH, colour, and antioxidant activity. Water content was determined by thermogravimetry method,
colour by chromameter, and determination of antioxidant activity was carried out by DPPH method.
Futhermore, the product shelf life test was performed using the critical moisture content method. The longest
shelf life of coffee product was reached by AF 0.05 which has shelf life of 322 days and permeability value
of 0.27 g H
2
O/mmHg.m
2
.day.
1 INTRODUCTION
Coffee is an agricultural commodities which has the
most reliability in Indonesia. Coffee is not a native
plant of Indonesia, but originated from the African
Continent (Anonym, 1988). Purwaceng plant is an
endemic species that grows in the altitude mountains
of 1,800 - 3,500 m above sea level in West Java
(Mount of Pangrango), Central Java (Dieng plateau)
and East Java. Purwaceng seeds are expensive
commodities which has high demand as the herbal
medicine or functional food industry (Anonym, 2000,
Rostiana, 2006). Purwaceng coffee is the product
which containing a combination between coffee and
purwaceng powder, as well as other additives with a
percentage based on a determined formula.
The deviations in product quality from the
beginning of their quality are called deterioration
(Arpah, 2001). The deterioration process is caused by
a reaction that starts from contacting the product with
air, oxygen, water vapor, light, or due to changes in
temperature. This reaction can also be preceded by
physical treatments such as vibration, compression,
and also abrasion.
Packaging is one determinant of product shelf life.
Packaging permeability was the important factor in
relation to quality deterioration and shelf life
determination of product in a packaging through its
critical water content. Some of common quality
attributes which affected the product self life were
water content, water activity, pH, weight and colour
change (Brown et al., 2011). Each packaging has
specific caracteristics that will affect their capacity to
maintain product inside toward harsh environmental.
There were two methods for determine the shelf
life of a food item, namely Extended Storage Studies
(ESS) and Accelerated Shelf Life Test (ASLT)
(Floros and Gnanasekharan, 1993). Extended Storage
Studies is the conventional method of determining
expiration by storing a product under normal
conditions, then observing changes in their quality
U., A., S., E., Wagiman, . and W., J.
Quality Deterioration and Shelf Life Determination of Purwaceng Coffee based on Packaging Variation using Accelerated Shelf Life Testing (ASLT).
DOI: 10.5220/0010546800003108
In Proceedings of the 6th Food Ingredient Asia Conference (6th FiAC 2020) - Food Science, Nutrition and Health, pages 137-144
ISBN: 978-989-758-540-1
Copyright
c
2022 by SCITEPRESS – Science and Technology Publications, Lda. All rights reserved
137

and shelf life. This method requires the same amount
of time as the quality change, therefore, if the quality
change was long, the time used for research using this
model will also be long. The ESS method usually
used for food products that have a shelf life less than
3 months, whereas the ASLT methods was more
suitable to predict the food products that have a shelf
life more than 3 months.
There are two kind of approaches for determining
the shelf life with the ASLT method namely the
Arrhenius approach and the critical moisture content
approach. The Arrhenius approach is used for food
products that are damaged due to chemical reactions
which are influenced by temperature factors. The
critical moisture content approach is used for food
products caused by adsorption of mositure content,
usually it used in dried food products (Anandito et al,
2017). Objectives of the research were to analyze the
isothermic sorption curve of purwaceng coffee
products, to predict the self life of purwaceng coffee
in various types of packaging, and to analyze the
effect of packaging on the decline in quality of
purwaceng coffee
2 EXPERIMENTAL METHOD
2.1 Material
Robusta coffee roasted powder from a farmer in
Gunung Kelir, Semarang. The coffee which used is
robusta medium roasted. These coffee was packaged
in PP 0.05 mm of thickness. Purwaceng powder was
originated and produced by purwaceng farmer group
at Dieng, Wonosobo. This powder also packaged in
PP 0.05 of thickness. Addictive ingredient in this
product is non diary creamer and sugar. The materials
was sealed for further experiment. The materials were
keept on room temperature in the laboratory of
bioindustry, Gadjah Mada University before using.
In this study, purwaceng coffee was packaged
using 5 types of packaging. There were alumunium
foil (AF) (thickness of 0.05 mm), combination of
poliethylene - alumunium foil - paper foil (PAP)
(thickness of 0.11 mm), polipropylene (PP)
((thickness of 0.05 mm), polipropylene (PP)
((thickness of 0.03 mm), and poliethylene (PE)
(thickness of 0.03 mm).
2.2 Purwaceng Coffee Production
Purwaceng coffee production process generally
consists of 3 stages of production, namely the
manufacture of Robusta coffee powder, manufacture
of Purwaceng powder, and the mixing of ingredients.
Making robusta coffee powder using a roaster and
grinder with type roasting medium and fine grinding.
Purwaceng powder produce by drying purwaceng
plants, cleaned, and mashed using grinder to become
smooth. The following step is blend and homogenize
of robusta coffee powder, non dairy creamer,
purwaceng powder, and sugar. The mixtures were
then packaged using 5 type of packaging and kept in
room temperature for further experiment.
2.3 Quality Deterioration Testing
Quality deterioration of purwaceng coffee was tested
by 6 parameters. Those parameters were water
content, water activity (Aw), weight, pH, colour, and
DPPH antioxidant activity. Water content was
determined by thermogravimetry method, Aw was
measured by Aqualab Series 3 (USA), weight by
analitycal balance (ACIS 600i), pH by pH meter 009
(I) A (USA), colour by cromameter (Konica Minolta
FR 400), and antioxidant activity was measured by
DPPH method.
The samples were stored in incubator (Memmert
GmbH) at 30
o
C for 90
days. This assay was carried
out periodically every 15 days. Statistical test using
IBM SPSS Statistic 24 was performed for the
comprehensive test result from all of the assay. The
statistical tests used include data normality tests,
homogenity tests, and ANNOVA tests, and Kruskall
Wallis test. Statistical test was used to determine the
effect of packaging variations on the quality changes
of product packaged. A general quality deterioration
test was also used to confirm the estimated shelf life
that has been determined previously.
2.4 Determination of Purwaceng
Coffee Shelf Life
2.4.1 Initial Water Content (Mo)
Measurement
Initial water content was determined by
thermogravimetric method to evaporate the water
inside product. This experimental procedure refers to
the procedure of the Association of Official
Analytical Chemists/AOAC (Anonym, 1995). Two
grams of sample was evaporated using oven dyer at
105°C for about 6 hours, and then placed it in a
dessicator vacuum for 15 minutes before weighing
the dried samples using analytical balance. The assay
was carried out in triplicate.
6th FiAC 2020 - The Food Ingredient Asia Conference (FiAC)
138
2.4.2 Isothermic Sorption Curves
Measurement
Determination of moisture isothermic sorption in this
study was conducted using the static
thermogravimetric method, Principle of this method
is to evaporate the water content when the sample in
an equilibrium state. Based on Anandito et al (2017,
data unpublished), the isothermic sorption curve was
determined at constant temperature (30
o
C). In this
study, different relative humidity (RH) was achieved
by using several saturated salt of NaBr, NaNO
2
,
NaCl, KCl, and BaCl
2
, which gave a relative humidity
value of 56%, 64%, 75%, 84% and 90%, respectively.
2.4.3 Packaging Permeability Test
The packaging permeability test for water vapor in
this study used the ASTM E-96 procedure by using a
device in the form of a WVTR (Water Vapor
Transmission Rate) cup filled with 15 grams of dry
silica gell and the sample of the package was placed
on a WVTR dish. After that, the weight of the WVTR
cup is weighed once a day for 7 days. According to
the ASTM E-96 (American Method) procedure, the
temperature and RH required for data collection are
30
o
C ± 2
o
C and RH 50-60%. The temperature and
relative humidity was controlled in an incubator.
2.4.4 Determination of Shelf Life
Determination of purwaceng coffee shelf life was
carried out using the equation as follow (Labuza,
1984):
t =
(1)
Components used for determine the shelf life were
initial water content (M
o
), critical water content (M
c
),
and equilibrium mositure content (M
e
). These three
parameters were expressed in units of g H
2
O / 100 g
solid. Material permeability (k/x) was expressed in gr
H
2
O/mmHg.m
2
.day. The surface area of the
packaging (A) is 0.00945 m
2
, and the weight of the
product/package was 21 grams. Saturated vapor
pressure was denoted by P
o
and the slope of the
isothermic sorption curve was denoted by b.
2.4.5 Statistical Analysis
All assay were carried out in at least triplicates.
Analysis of Varian (Annova) was used to analyze the
significance differences of parametric data of the
packaging with least significance difference (LSD) at
p < 0.05 as a level of significance. Meanwhile,
Kruskall Wallis was used to analyze the significance
differences of non parametric data.
3 RESULT AND DISCUSSION
3.1 Quality Deterioration
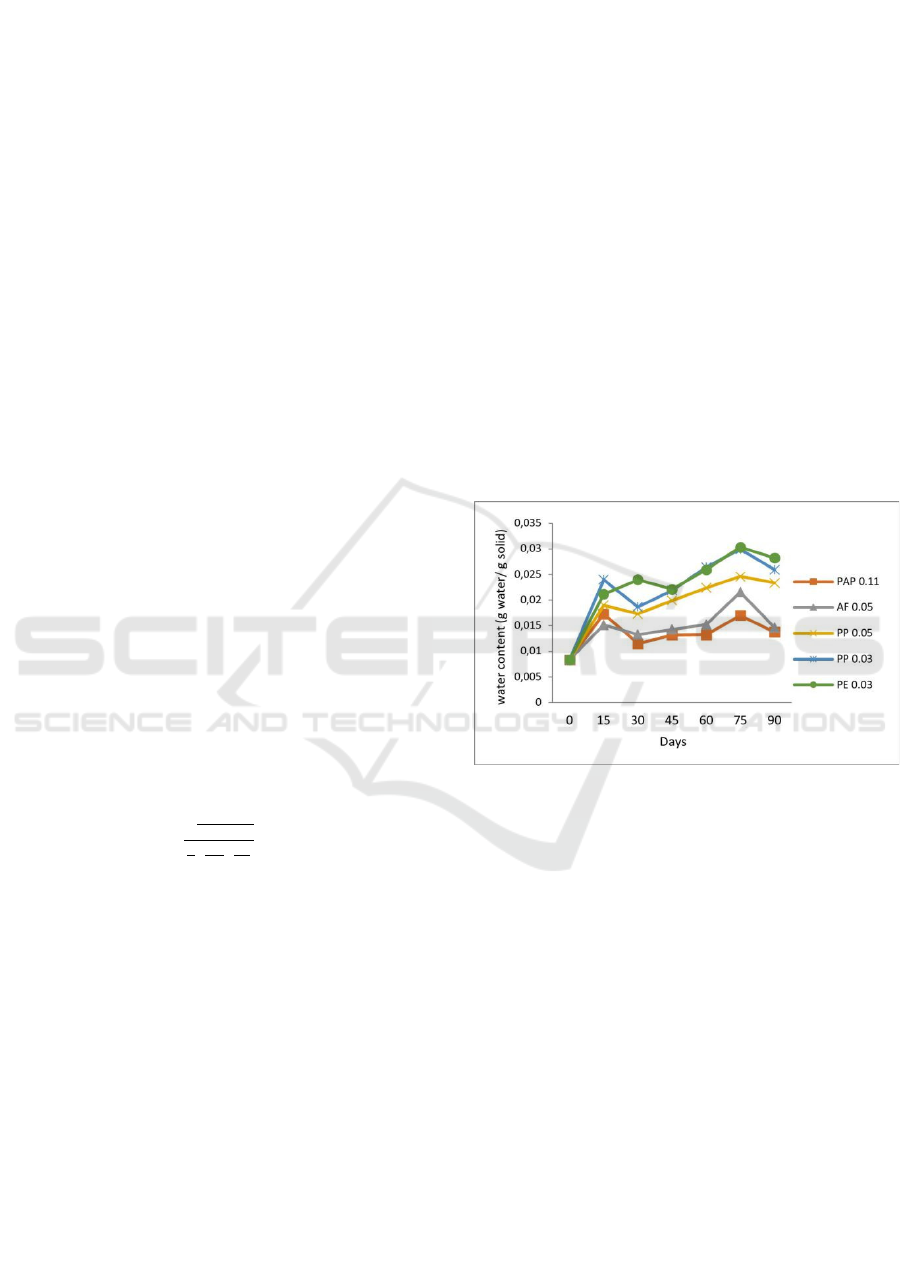
3.1.1 Water Content Assay
Water content is one of quality parameters which has
significant effect on agriculture product deterioration.
The result showed that all samples has a stagnant
increase of water content in general, eventhough at
90th day there was a decrease in water content in all
packaging. Increase in water content among 5
packaging showed different values. The result of
water content deterioration test was depicted in
Figure 1.
Figure 1: Quality deterioration graph based on water
content parameter.
The smallest increase in water content occurred in
the PAP 0.11 and AF 0.05 packaging, while the
largest increase of water content occurred in the PE
0.03 packaging. This differences of water content
increase may caused by the differences of the
packaging nature, especially in terms of packaging
permeability. Permeability of packaging materials
indicate the ability of packaging materials to protect
the products inside from the transpiration rate of
water vapor coming from the environment. The
smaller the permeability value, the better the
packaging's ability to protect the product from
transpiration of water vapor.
According to the water content as shown in Figure
1, AF 0.05 packaging has the lowest permeability
value, following by PAP 0.11, PP 0.05, PP 0.03, and
packaging PE 0.03 with highest permeability value.
Rahayu and Eny (2007) state that aluminum foil (AF)
Quality Deterioration and Shelf Life Determination of Purwaceng Coffee based on Packaging Variation using Accelerated Shelf Life Testing
(ASLT)
139
packaging was better than Polyethylene as well as
hand paper when used to maintain the moisture
content. That was the reason that the permeability
value of the aluminum foil packaging was smaller
than the other two packaging. Products which
packaged using aluminum foil also showed lower
water content. The smaller the increment of water that
enters the material, the better the packaging to use.
Based on the ANNOVA analysis, the significance
value of 0.009 (<0.05) was obtained, means that the
population tested was significantly different.
Therefore, it can be concluded that based on water
content parameters, the type of packaging
significantly influences the quality deterioration of
purwaceng coffee.
From the results of the Post Hoc Test by water
content parameter, data groups that have different
significantly was occurred in 2 pairs. Those data
were the decrease in water content in PAP 0.11 - PP
0.03 and PAP 0.11 - PE 0.03 packaging. Another
pairs data groups was not different significantly at all.
This means that the reduction in water content in the
packaging of PAP 0.11 and PP 0.03 was significantly
different.
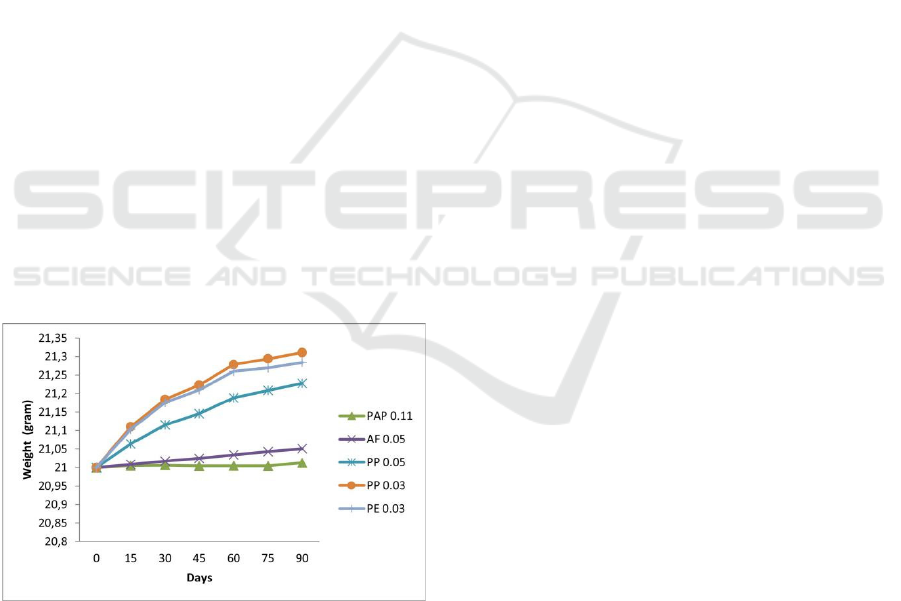
3.1.2 Weight Assay
The weight of purwaceng coffee stored in five
packaging showed that all have an increased stagnant
of water content in general. The product weights on 5
packaging have different values. The result of weight
deterioration test was depicted in Figure 2.
Figure 2: Quality deterioration graph based on weight
parameter.
According to Figure 2, the smallest weight
occurred in the PAP 0.11 and AF 0.05 packaging,
while the largest weight occurred in the 0.03 PE
packaging weight testing carried out for 90 days. This
difference in weight value occurs may caused by the
differences in the nature of the packaging, especially
in terms of packaging permeability. It also shows the
similarity between the results of water content and the
weighting assay of purwaceng coffee.
Kruskal Wallis test was performed in this assay
because the data classified into non-parametric data.
Kruskal Wallis test results obtained a significance
value of 0.005 (<0.05), indicated that the population
data was different significantly. The results showed
that the use of packaging variations has significant
influences to quality deterioration of purwaceng
coffee based on weight parameter.
The average weight of samples with PAP 0.11
packaging had the smallest weight changes,
meanwhile samples with PP 0.03 packagimg had the
highest average weight changes among 5 packaging.
Based on post hoc test, it can conclude that different
weights between populations occur in PAP 0.11
packaging against PP 0.05, PP 0.03, PE 0.03 and vice
versa. AF 0.05 packaging was also has different
significantly from PP 0.05 packaging, PP 0.03, PE
0.03 and vice versa. Population data which were not
significantly different occurred in PP 0.05 packaging
against PP 0.03, PE 0.03. In addition, PP 0.03 and PE
0.03 packaging also have not significant weight
differences.
3.1.3 Water Activity (Aw) Assay
The existence of microorganism growth in
purwaceng coffee was proven by the results of water
actuvity test. The assay results showed that
purwaceng coffee stored at 86% RH (Aw value of
0.86) and 90% RH (Aw value of 0.9) for 43 days has
been overgrown by microorganisms (mold)
As the results of water activity assay using
aqualab within a span of 90 days, the value of water
activity in purwaceng coffee was under 0.4, its mean
that storage of purwaceng coffee until the 90 days was
not affect their quality and suitable for consumption.
If purwaceng coffee consumed more than the
specified shelf life limit, it can endanger consumers
because the microorganisms have begun to grow. The
result of water activity deterioration assay was
depicted in Figure 3.
6th FiAC 2020 - The Food Ingredient Asia Conference (FiAC)
140
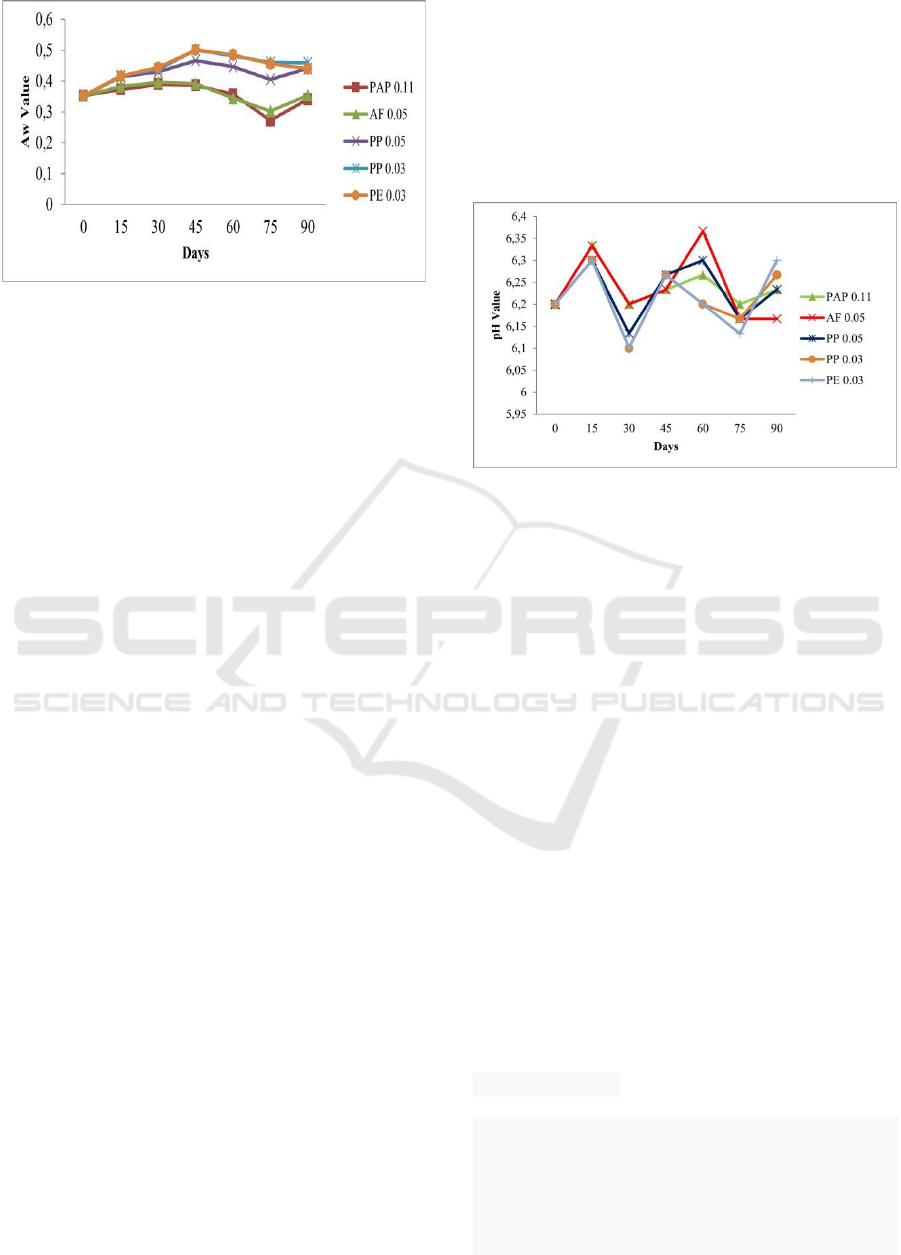
Figure 3: Quality deterioration graph based on water
activity parameter.
In addition, the water activity assay was also used
as a parameter for determine the effect of packaging
variations on the quality deterioration. The value of
Aw tends to rise, even though on the 45
th
day until the
90
th
day has decreased. In general, the greatest
increase of Aw occurred in PP 0.03 packaging, while
the smallest increases in PAP 0.11 and AL 0.05
packaging.
The significance value of the five packaging has a
value > 0.05, its mean that the weight change data has
a normal distribution. Using homogeneity test with a
significance value of 0.928, the data was considered
to have homogenity. Based on the ANNOVA test, a
significance value of 0.000 was obtained, indicate
that based on the parameters of water activity, the
type of packaging significantly affected the quality
deterioration of purwaceng coffee products.
Based on post hoc test, 6 pairs of data groups have
significant difference. The pairs of data groups were
PAP 0.11 and PP 0.05, PAP 0.11 and PP 0.03, PAP
0.11 and PE 0.03, AF 0.05 and PP 0.03, and AF 0.05
and PE 0.03.
3.1.4 pH Assay
The degree of acidity (pH) is very influential on the
taste and aroma of coffee. According to Kustiyah
(1985), at a pH interval between 4.9-5.2 will give a
preferred coffee beverage aroma in general. The pH
will increase to greater than 6.0 if the roasting
imperfectly (lightly roasted). The optimum pH of
robusta coffee is between 5.0-5.8, while the pH of
ground coffee produced in the United States in
between 4.7-5.2 (Sivetz, 1972)
According to Winarno (2004), some
microorganisms such as mold and yeast can break
down acids so that they will increase pH. Mold will
isolate the acid and produce a final product that is
alkaline due to the proteolysis reaction. In addition,
the increase in pH occurs due to the formation of
compounds from protein decomposition by
microorganisms that are basic as ammonia. Ihwani
(2008) also states that, increasing or decreasing the
pH value is strongly influenced by the results of the
degradation formed and the ionic balance of the
protein solution. The result of water activity
deterioration test was depicted in Figure 4.
Figure 4: Quality deterioration graph based on pH
parameter.
Changes that occur in this pH test, do not
experience stagnation or a constant decrease. In
general, the change in pH of the two packages is only
at intervals 6.1 to 6.4. The pH value at the beginning
of the storage period was 6.2, then changed until the
last day (90th day), obtained information that the PAF
0.11 and PP 0.05 packages were able to maintain the
most stable pH value and close to the initial pH
quality value of 6.23. The 0.05 aluminum foil
packaging has decreased pH to 6.16, while the PP
0.03 and PE 0.03 packages have increased to 6.26 and
6.3, respectively.
Statistical analysis showed that the pH change of
the five packaging has a significance > 0.05 mean that
the pH change was to be normal data. Furthermore,
the homogeneity test obtained a significance value of
>0.05 indicate that the data was homogeneous and to
be further analyzed by ANNOVA. ANNOVA
statistical analysis showed a significance value of
>0.05, indicate that the type of packaging used was
not significantly affect the pH change of purwaceng
coffee.
3.1.5 Lightness
According to Bicho et al (2012), brightness /lightness
(L*) decreases significantly with increasing roasting
intensity, and this process affects the browning level
of the product or is generally easier to understand
with longer and higher roasting temperatures the
product the resulting coffee is darker in color. This
Quality Deterioration and Shelf Life Determination of Purwaceng Coffee based on Packaging Variation using Accelerated Shelf Life Testing
(ASLT)
141
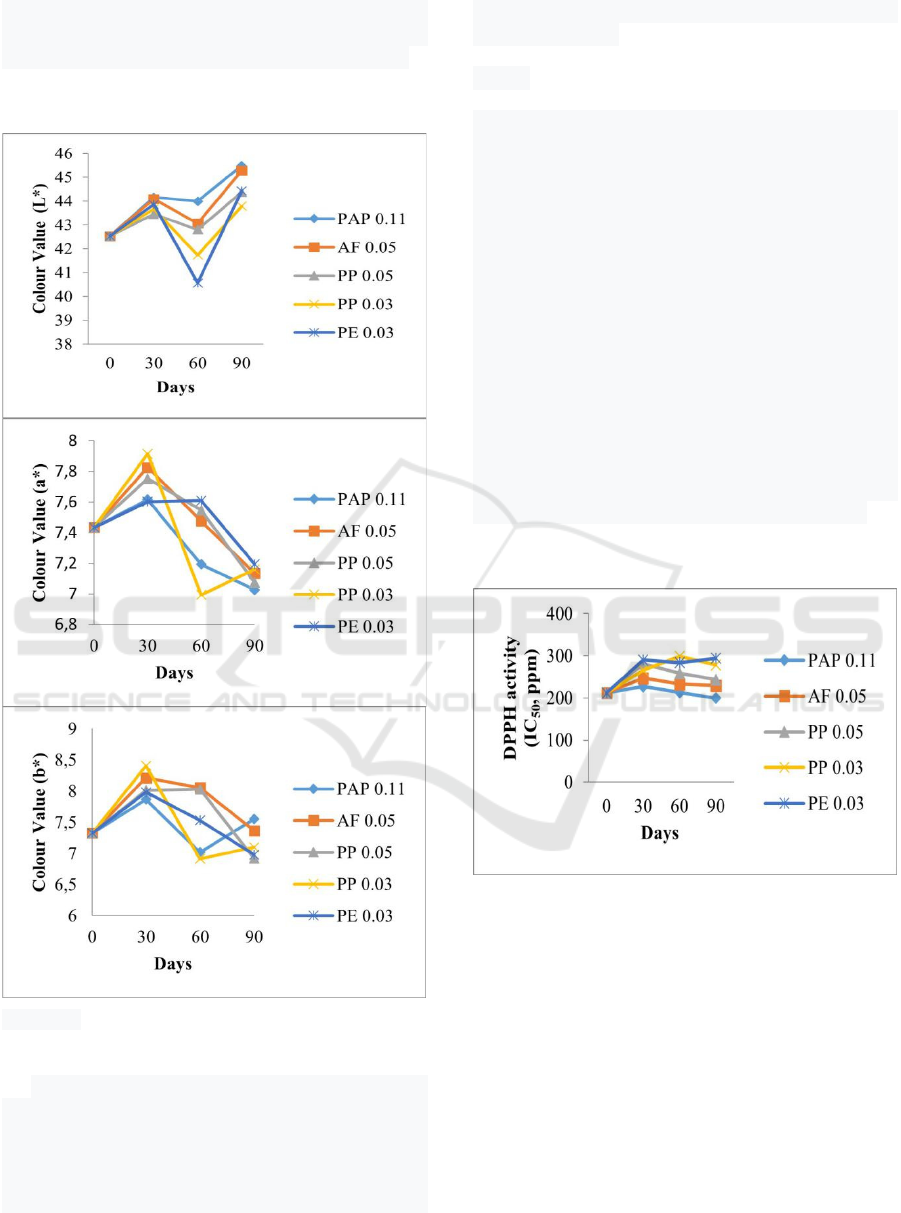
brownish level will also greatly affect the coordinates
of a* and b*. In this research, robusta coffee produced
by medium roasting was assayed their color and the
result of colour deterioration test (L*, a*, and b*) was
depicted in Figure 5.
Figure 5: Colour deterioration test (L*, a*, and b*) of
purwaceng coffee samples.
Results of the study found that the value of L* was
in the interval 41-46 in five packaging. This indicates
that purwaceng coffee has an L* value that almost
same as the L* results in the study of roasted medium
robusta coffee. The value of a * obtained was in the
range of number 8, it has similarities to the previous
studies. However, the value of b* was lower than the
previous research.
3.1.6 Antioxidant Activity
DPPH (2.2-diphenyl-1-picrylhydrazyl) scavenging
activity test was conducted by comparing the pure
antioxidant/strong antioxidant. The parameter of the
DPPH method is the 50% inhibition concentration
(IC
50
value) or the concentration that can reduce free
radical activity by 50% (Widyasanti et al,, 2016). A
compound classified into very strong antioxidant
activity if the IC
50
value is less than 50 ppm, those
belong to strong group have the IC
50
value in between
50-100 ppm, and those belong to moderate group
have the IC
50
value in beetwen 101-150 ppm, the
group is weak if the IC
50
value is between 150-200
ppm, and the group antioxidants are very weak if the
IC
50
value >200 ppm (Molyneux, 2004). Vitamin C
used as the comparative antioxidant (positive control)
which has an DPPH antioxidant IC
50
value of 6.0674
ppm. Its mean that DPPH scavenging activity of all
samples were much lower than vitamin C. The
antioxidant activity (IC
50
value) of purwaceng coffee
in five type of packaging was shown in Figure 6.
Figure 6: DPPH scavenging activity (IC
50
value) of
purwaceng coffee samples.
The changes in the value of the greatest
antioxidant levels occur in PE 0.03 packaging, then in
PP 0.03 packaging, and PP 0.05 packaging. On PAP
0.11 and AF 0.05 packages, the change in antioxidant
activity was smaller than the previous three packages.
The relationship between IC
50
concentration values
and the ability of packaging to maintain product
quality is the higher the IC
50
concentration value, the
worse the packaging is in maintaining product
quality. This study shows the antioxidant value of
purwaceng cream coffee >200 ppm. This can be
interpreted that the antioxidant value of purwaceng
coffee is classified as very weak.
6th FiAC 2020 - The Food Ingredient Asia Conference (FiAC)
142
3.2 Determination of Purwaceng
Coffee Shelf Life
3.2.1 Permeability of Packagings
Five packages were tested their permeability values.
As shown in Table 1, each packaging have different
permeability values. The packaging that has the
lowest / smallest permeability in this study is AF 0.05
with a permeability value of 0.249 g / mmHg.m
2
.day,
while the packaging that has the highest permeability
is the PE 0.03 packaging with a permeability value of
0.465 g / mmHg.m2.day. In general, the order of 5
packages from the smallest permeability to the largest
permeability were AL 0.05, PAF 0.11, PP 0.05, PP
0.03, and PE 0.03, respectively.
Table 1: Packaging permeability value.
Packaging
Type
Area (m
2
) Slope Permeability
(g/mmHg.m
2
.day)
PAP 0,11 0,001555 0,0092 0,268211858
AF 0,05 0,001555 0,0082 0,249188856
PP 0,05 0,001555 0,0128 0,373164324
PP 0,03 0,001555 0,0144 0,437599942
PE 0,03 0,001555 0,0153 0,464949938
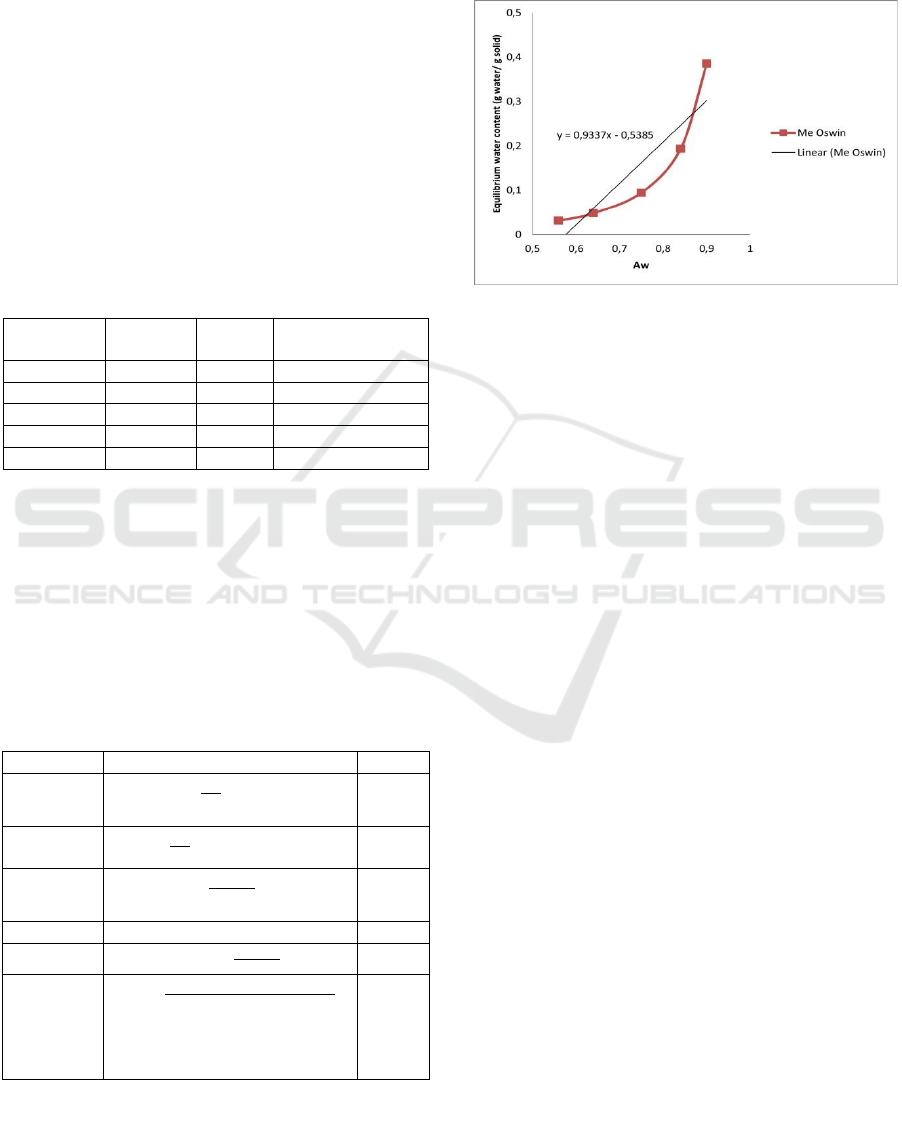
3.2.2 Isothermic Sorption Curve
The models used to determine the shape of the
isothermic sorption curve are very diverse. The model
to be selected is the one with the smallest Mean
Relative Determination (MRD) value. The Oswin
model was used to create an isothermic absorption
curve because it has the smallest MRD value
compared to the other 5 models, as shown in Table 2.
Table 2: Mean relative determination.
Model E
q
uation MRD
Hasley
logln
1
𝑎𝑤
1,241 0,672log𝑀𝑒
8,568
Chen –
Clayton
lnln
1
𝑎𝑤
0,594 4,814𝑀𝑒
41,636
Henderson
𝑙𝑜𝑔 ln
1
1𝑎𝑤
0,542 0,406log𝑀𝑒
10,170
Caurie
ln𝑀𝑒 7,610 7,205𝑎𝑤
13,522
Oswin
ln𝑀𝑒 1,279ln
𝑎𝑤
1𝑎𝑤
3,765
8,360
Guggenhe
im-
Anderson-
de Boer
(
GAB
)
𝑀𝑒
0,0198 𝑎𝑤
1 1,0481 1,068𝑎𝑤
55,357
Furthermore, Oswin model is used to determine
the equilibrium water content at A
w
of 0.6. Based on
the substitution results above, the equilibrium water
content value was 0.0389 gam water/gram solids. The
isothermic absorption curve of the Oswin model was
depicted in Figure 7.
Figure 7: The isothermic absorption curve of the Oswin
model.
According to Labuza (1984), the value of the
slope on the sorption curve is determined in the linear
region. The slope of the isothermal sorption curve is
the value of the straight-line slope of the linear region
which passes the water content at different relative
equilibrium values. The slope value of the isothermal
sorption curve in this study was 0.9337.
3.2.3 Estimation of Purwaceng Coffee Shelf
Life
By using equation 1, the self life of purwaceng coffee
in five types of packaging could be determined. The
shelf life of purwaceng coffee resulted from those
equation was depicted in Figure 8. The longest shelf
life was reached by purwaceng coffee packaged using
AF 0.05, with the self life estimation of 322 days.
Conversely, purwaceng coffee packaged using PE
0.03 has the shortest self life estimation. Purwaceng
coffee packaged using PAP 0.11 has a relatively
longer shelf life than those packaged using PP 0.05,
PP 0.03, and PE 0.03 as well.
Comparing with the other research of shelf life in
similar product, durian flavored coffee products has a
shelf life of 199 days (Nirmala, 2017) and brand
instant coffee XYZ has a shelf life of 21 months or
632 days (Wijaya, 2007) . The shelf life of purwaceng
coffee packaged by AF 0.05 was longer than those of
durian flavored coffee and shorter than those of XYZ
instant coffee. This may caused by many factors, one
of which was the packaging used. XYZ brand instant
coffee packaging in the form of metalized film was
much better in maintaining the quality of coffee
products, therefore their shelf life was longer.
Quality Deterioration and Shelf Life Determination of Purwaceng Coffee based on Packaging Variation using Accelerated Shelf Life Testing
(ASLT)
143
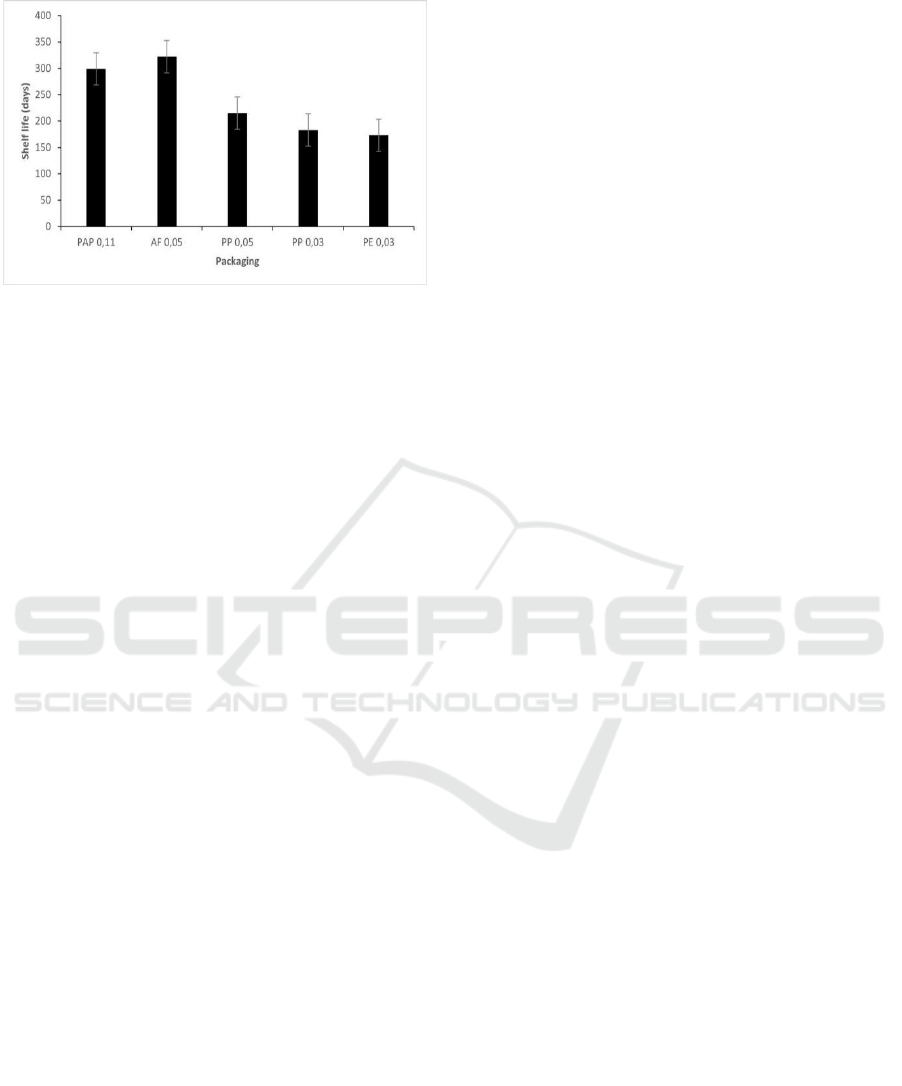
Figure 8: Shelf life estimation of purwaceng coffee using
five type of packaging.
4 CONCLUSIONS
Purwaceng coffee packaged by AF 0.05 has the
longest shelf life estimation (about 322 days),
compared to the other four packaging. By using water
content, water activity, and weight parameters
showed that the type of packaging used has a
significant effect on quality deterioration of
purwaceng coffee.
ACKNOWLEDGEMENTS
This funding research was fully supported by
Ministry of Research Technology and Higher
Education Through Gadjah Mada University with
Contract number: 2577/UN1. DITLIT/ DIT-LIT/ LT
2019.
REFERENCES
Anonym, 1988. Budidaya tanaman kopi. Aksi Agraris
Kanisius, Yogyakarta.
Anonim, 1995. AOAC official methods of analysis.
Association of Official Analytical Chemists,
Washington
Anonym, 2000. Penggalian pemanfaatan dan karakterisasi
mutu tumbuhan obat potensial dan langka. Laporan
Penelitian Ballitro, Bogor.
Anandito, R.B.K., Siswanti, L.P., Hangga S., 2017. Shelf
determination of fish koya using critical moisture
content approach. Proceedings of the Pakistan
Academy of Sciences No. 54 (3): 201 – 206.
Arpah, 2001. Buku monograf penentuan kadaluarsa
produk. Program Studi Ilmu Pangan. Bogor, Institut
Pertanian Bogor.
Bicho, N. C., António E. L., José C. R.,Fernando C. L.,
2012. Use of colour parameters for roasted coffee
assessment. Ciênc. Tecnol. Aliment. Campinas Journal
32(3): 436-442
Brown, H., James W., Mark K., 2011. Food and beverages
technology: packaged product quality and shelf life. 2
nd
Edition, Blackwell Publishing. New York.
Sivetz, M., 1972. How acidity affects coffee flavour. Inside
Clifford and Willson, 1985. Botany, Biochemistry and
Production of Beans and Beverage. The AVI
Publishing Company, Inc., Westport, Connecticut.
Floros, J.D., V. Gnanaskharan. 1993. Shelf life prediction
of packages food : chemical, biological, physical, and
nutritional aspects. Elsevier Publishing, London.
Ihwani, N. 2008. Pengaruh kemasan terhadap daya simpan
tahu segar pada suhu dingin. Skripsi. Fakultas
Teknologi Pertanian, Institut Pertanian Bogor, Bogor.
Kustiyah, 1985. Mempelajari beberapa karakteristik kopi
bubuk dari berbagai jenis cacat biji kopi. Skripsi S1,
Fakultas Teknologi Pertanian, Institut Pertanian Bogor,
Bogor.
Labuza, T.P., 1984. Moisture sorption : practical aspect of
isotherm measurement and use. American Association
of Cereal Chemists. St Paul Minnesota.
Molyneux, P. 2004. The use of the stable free radical
dyhenylpicrylhydrazil (DPPH) for estimating
antioxidant activity. Journals Science and Technology
26:211-219.
Nirmala, A. 2017. Pendugaan umur simpan kopi krimer
rasa durian. Skripsi Fakultas Teknologi Pertanian
UGM, Yogyakarta.
Rahayu, E. and Eny W. 2007. Pengaruh kemasan, kondisi
ruang simpan dan periode simpan terhadap vabilitas
benih caisin (Brassica chinensis L.). Jurnal Buletin
Agroindustri 35 (3): 191-196
Rostiana, O. D., 2006. Karakteristik nomor-nomor koleksi
purwoceng (Pimpinella pruatjan Molk.) di gunung
putri. Prosiding Seminar Nasional dan Pameran
Tumbuhan Obat Indonesia XXVIII: 55-61
Wijaya, C. H. 2007. Pendugaan umur simpan produk kopi
instan formula merek Z dengan pendekatan arrhenius.
Skripsi, Institut Pertanian Bogor, Bogor
Winarno, F.G., 2004. Kimia pangan dan gizi. Gramedia
Pustaka Utama, Jakarta.
Widyasanti, A., Dadan R., Novriana E., 2016. Aktivitas
antioksidan ekstrak teh putih (Camellia Sinensis)
dengan metode DPPH (2,2 Difenil -1- Pikrilhidrazil).
Jurnal Fortech 1 (1): 1-9
6th FiAC 2020 - The Food Ingredient Asia Conference (FiAC)
144
