
Laboratory Study on Shear Strength of Soil using Woven and
Non-woven Geotextiles
Yelvi
1
, Aisyah Salimah
1
, Vatih Abdullah
1
1
Civil Engineering, Politeknik Negeri Jakarta, Depok 16424, Indonesia
Keywords: Geotextiles, Woven, Non-Woven, Shear Strength
Abstract: In constructing a construction, it is necessary to identify the type of soil as a place for the foundation and the
building to rest on it. The carrying capacity of the soil also varies, in sand that has a uniform gradation when
it is saturated, the shear strength will decrease. One way that can be done to increase the shear strength of the
soil is to provide reinforcement with the addition of geotextiles. The shear strength parameters used in the
planning of the bearing capacity of the soil reinforced by geotextiles are the internal friction angle and the
interaction coefficient between the geotextile and the sand. The sample of this study used liquefaction
potential sand Bangka using woven and non-woven geotextile reinforcement with a relative density variation
of 25%, 50%, 75%. For use geotextiles are installed vertically and horizontally. To get the parameter value of
shear strength, Direct Shear testing is carried out. Based on the test results, it is found that Bangka sand is
uniform sand with values of Cu <6 and Cc <1. The increase in shear strength in the samples reinforced by
geotextile vertically is greater than horizontally at a density of 25% and 50%, while at a density of 75% it
states otherwise.
1 INTRODUCTION
Geotextiles have been widely applied in civil
engineering projects with various functions. One of
its functions is for reinforcement. Some examples of
soil reinforcement with geotextiles are soil
embankments, slopes, and retaining walls. Soil
reinforcement with geotextiles requires knowledge of
the soil-geotextile interface behavior for structural
stability analysis (Day, 2000). In order to analyze the
interface shear strength parameters, several studies
have been conducted to understand the shear strength
behavior of geotextile-reinforced sand soils. An
significant factor in the design of geotextile structures
is the interface shear strength. (Omar AH et al. 2019;
Punetha et al. 2017; Wang et al. 2016; Brahim et al.
2016; Aldeeky et al. 2016; Hatami and Esmaili 2015;
Vieira et al. 2015; Anubhav and Wu. 2015; Dixon and
Jones 2005; Bergado et al. 2006). The results
generally reveal that the addition of fibers to sandy
soils as reinforcement can increase the shear strength
compared to unreinforced sand. To improve
performance in different soil conditions,
strengthening the soil is increasingly important. The
reinforcement mechanism is to withstand the soil's
tensile deformation, thus increasing the overall
resistance of the composite soil matrix through the
interface bond resistance limited by the tensile
strength of the geotextile. Jewell (1996) has examined
the interaction between reinforced soil and
geotextiles. There are two conditions in soil
interaction with reinforcement, namely direct shear
and pull-out conditions. The results showed that the
direct shear resistance is the ratio of the interface
friction angle to the friction angle in the soil. The
mobilization of the interface friction angle is one of
the important factors affecting the stability analysis.
Some researchers use the Direct Shear Test to
understand the shear strength of reinforced soil
behavior. The choice of direct shear test installation
depends on the interaction mechanism to be
reproduced. The reinforcement layer located parallel
to the shear plane of the shear box offers laboratory
test results in many literature studies. (Palmeira EM,
2008; Takasumi et al. 1991; Tan SA et al. 1998;
Cerato AB and Lutenegger AJ 2006; Abu-Farsakh
MY et al. 2007; Liu CN et al. 2009; Lopes ML,
Silvano R 2010; Hossain B et al. 2012; Anubhav
Basudhar PK 2013; Rifa'i, A., 2003; Tuna SC, Altun
S 2012; Vieira CS, Lopes ML 2013; Kim D, Ha S
2014; Vangla P, Latha GM 2015; Choudhary AQ, and
Krishna AM 2016. Other studies place the
58
Yelvi, ., Salimah, A. and Abdullah, V.
Laboratory Study on Shear Strength of Soil using Woven and Non-woven Geotextiles.
DOI: 10.5220/0010514700003153
In Proceedings of the 9th Annual Southeast Asian International Seminar (ASAIS 2020), pages 58-64
ISBN: 978-989-758-518-0
Copyright
c
2022 by SCITEPRESS – Science and Technology Publications, Lda. All rights reserved
reinforcement layer perpendicular to the shear plane
Jewell RA, Wroth CP 1987; Athanasopoulos GA
1993; Bauer GE, Zhao Y 1994; Palmeira EM 1999;
Moayedi H et al. 2010; Saya˜o ASFJ, Sieira ACCF
2012; Jose D et al. 2016. The reinforcement layer was
positioned perpendicular to the shear plane in that
study to characterize the behavior of the composite
materials when the soil and reinforcement are shifted.
Based on previous research which has given some
evidence that the effect of geotextiles as
reinforcement on the soil can increase the interface
shear strength. However, not much research has been
done on the effect of geotextile placement on sandy
soil on the interface shear strength. Therefore, it is
necessary to do more research on the effect of
geotextile position on the soil on the interface shear
strength. So it is hoped that the results of this study
can add to the literature that can be used as a reference
in geotextile reinforcement analysis to obtain the right
design.
2 THEORY
Soil shears the resistance force exerted by soil grains
against pressure or pull (Hardiyatmo, 2002). Based on
this understanding, when the soil is exposed to
freight, it will be held back by soil cohesion which
depends on the type of soil and its density, but does
not depend on the normal stresses acting on the shear
plane and the friction between the grains of soil
whose magnitude is directly proportional to the
normal stress in the shear plane. Then the shear
strength equation can be formulated as follows.
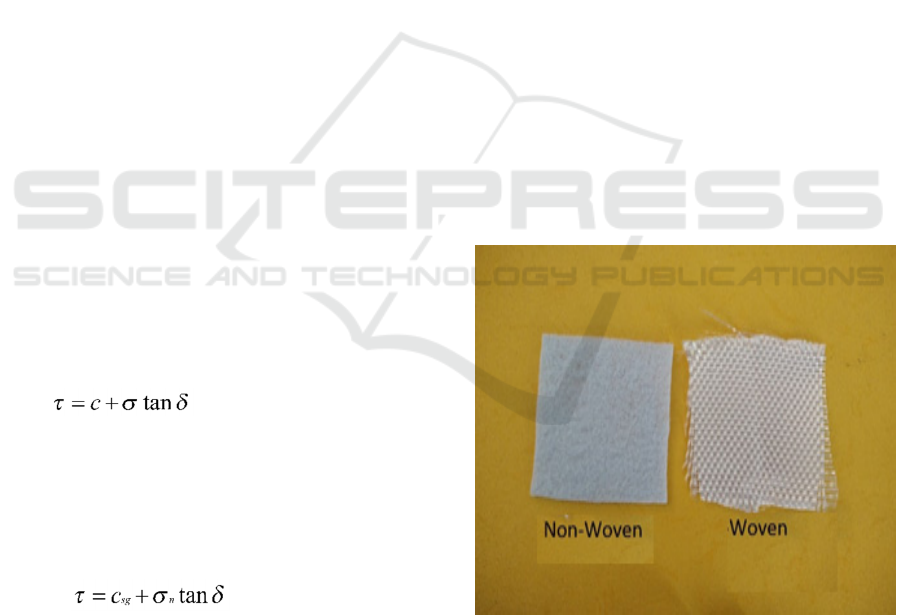
(2.1)
(Note: c = 0 for sand and σ = σ ')
For the shear strength which is strengthened by
Geotextile, the determining parameters are the
Mobilization of the Angle of Friction of the interface
Sand-Geotextile (δ) and Adhesion (c
sg
).
(2.2)
Determination of shear strength can be carried out
Direct shear test utilizing controlled shear stress,
where the addition of shear forces is made constant
and regulated, or utilizing controlled stress in which
the shear stress is applied by adding dead load
sustainably, and with the same addition big every
time, until it collapses.
3 METHOD
3.1 Soil
The soil sample used in the study was a disturbed
sample by selecting Bangka sand which has a uniform
gradation. On the soil, the grain size analysis test is
conducted first to determine whether the soil is
included in the soil criteria that have the liquefaction
potential.
3.2 Geotextiles
Material as the interface consists of woven and non-
woven types. Woven type is GT 200 (GTX-N-2 High
strength polyester) and non-woven type GT 250 PET.
The characteristic of woven geotextile is a woven
sheet with a polyester base material which has a
uniform tensile strength. This type weights 200 gr /
m2. The tensile strength value for the long direction is
4.15 kN / m and the transverse direction is 6.38 kN /
m. Non-woven geotextile is a non-woven sheet that
functions as separation, filtration, protection, and
drainage. This type weights 250 gr / m2. The tensile
strength value for the long direction is 8.87 kN / m and
the transverse direction is 11.76 kN / m. The tensile
strength test of the two types of geotextiles refers to
the technical standard test ASTM D4595. Geotextile
used is woven and non-woven can be seen in Figure 1.
Figure 1 Woven and Non-Woven Geotextiles
3.3 Sample Preparation and Testing
Phase
3.3.1 Sample Preparation
The dry weight of sand is prepared for the relative
density of 25%, 50%, and 75%, respectively. For sand
Laboratory Study on Shear Strength of Soil using Woven and Non-woven Geotextiles
59
soil without geotextile reinforcement, the sand soil is
directly put into the shear box. Then it is saturated and
ready for the shear test. As for sand soil with
geotextile, a sand-geotextile soil sample is prepared
according to the position of the geotextile placement
in the shear box. If the position is parallel to the
sliding direction, then testing is carried out every one
layer, two layers, and three layers. Meanwhile, if the
direction is perpendicular to the sliding direction,
only one layer is sufficient for each woven and non-
woven. After the sand-geotextile soil has been put
into the shear box, it is saturated and ready for the
shear test, then it is put into the shear box.
3.3.2 Testing Procedure
The test is divided into two stages. The first is testing
to obtain the physical properties of the soil according
to the provisions of the 1989 Annual Book of ASTM
Standards and followed by testing the shear strength
under static loads with the direct shear test. As many
as 15 samples were made, namely sand without using
geotextiles, sand using Woven and Non-Woven
geotextiles which were installed horizontally and
vertically. Each treatment had a different density,
namely 25%, 50%, and 75%.
4 ANALYSIS AND DISCUSSION
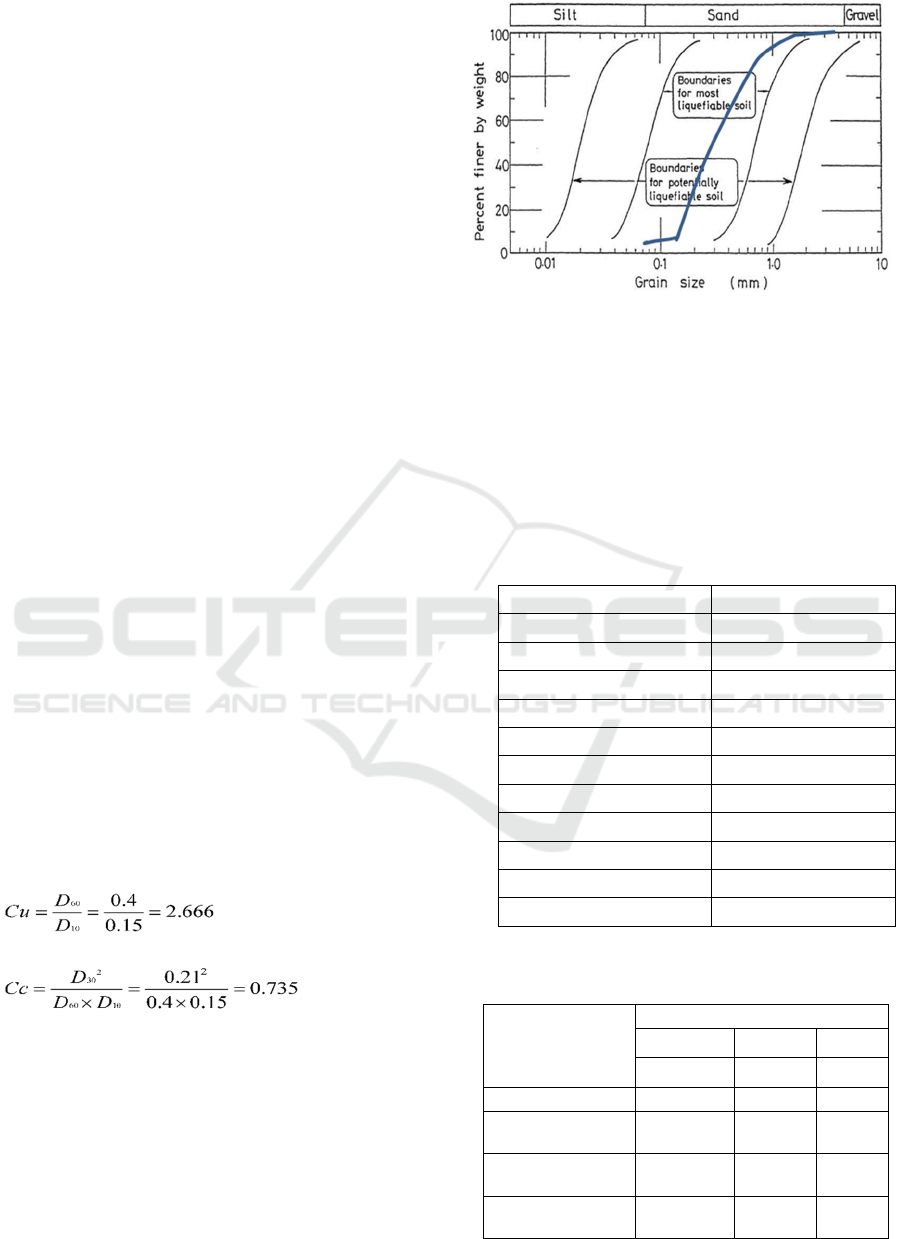
The result of the Analysis of shieve, it shows that the
sandy soil of Bangka
the entry into
an area that is
potentially liquefied and can be seen in Figure 4.1
The USCS classification system is used to see the
uniformity coefficient and curvature of grading. From
the graph, it can be seen that the values of
D
60
= 0.4, D
10
= 0.15, D
30
= 0.21
Figure 2 Grading boundary curve between soils that have
the potential for liquefaction (Tsuchida, 1970)
Well graded sand if Cu > 6 and 1 < Cc < 3, both
criteria must be fulfilled, otherwise it is classified as
poorly graded. From the Cu and Cc values obtained,
Bangka sand is considered to be poorly graded with
uniform gradations. The following is a summary of
the Bangka sand soil property index which is
presented in Table 1.
Table 1 Soil Property Index Soil
Properties Value
γd max 18.92 kN/m
3
γd min 14.69 kN/m
3
Gs 2.644
e
max
0.799
e
min
0.397
D50 0.32 mm
D10 0.15 mm
D60 0.4 mm
D30 0.21 mm
Cu 2.666
Cc 0.735
Table 2 Results of the interaction coefficient between sand
and geotextile (c
sg
)
Sample
Treatment
Relative Density (Dr%)
25% 50% 75%
c
sg
c
sg
c
sg
Woven Vertical 0.035 0.021 0.02
Horizontal
Woven
0.032 0.021 0.01
Vertical Non-
Woven
0.059 0.058 0.053
Horizontal Non-
Woven
0.008 0.005 0.004
ASAIS 2020 - Annual Southeast Asian International Seminar
60
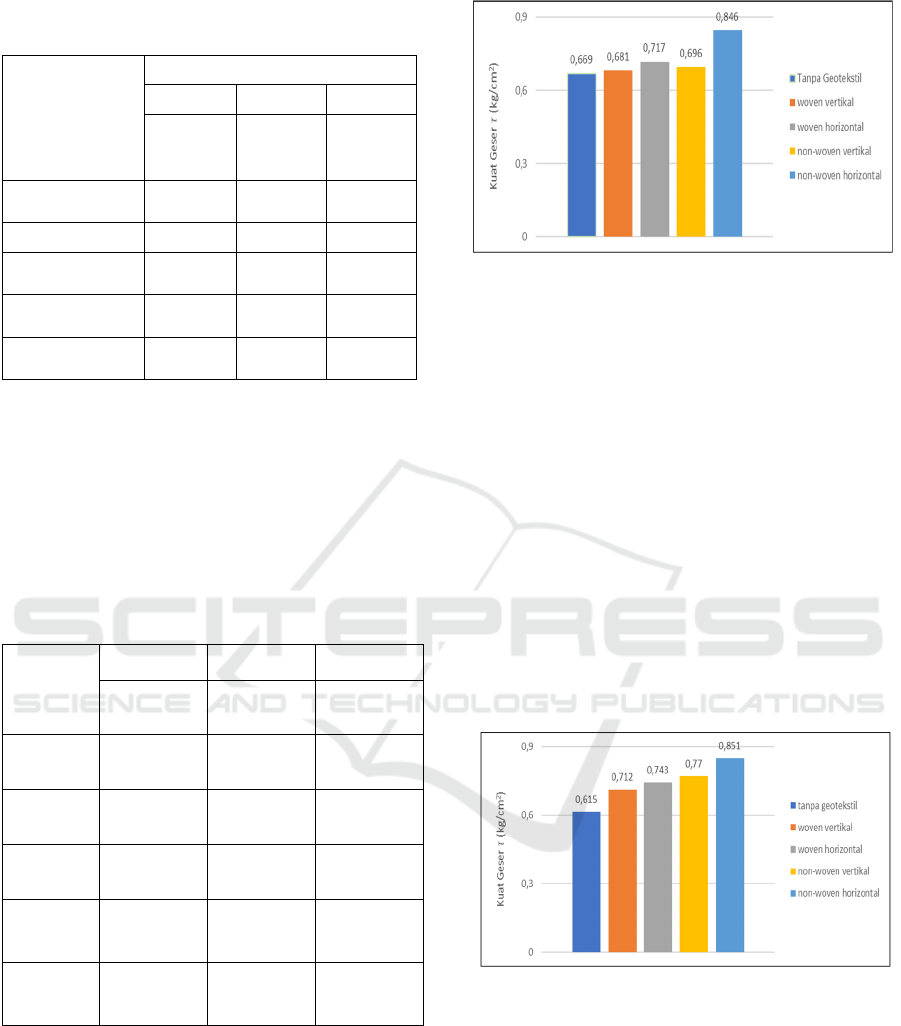
Table 3 Results Comparison of shear angle values after and
before (δ and ∅) use of geotextiles
Sample
Treatment
Relative Density (Dr %)
25% 50% 75%
/ / /
Without
Geotextile
1 1 1
Vertical Woven
1.23 1.24 1.29
Horizontal
Woven
1.29 1.28 1.24
Vertical Non-
Woven
1.21 1.27 1.3
Horizontal Non-
Woven
1.49 1.44 1.37
Based on the results of the shear test, the shear
strength parameter is obtained, so that the equation
used to obtain the shear strength value (f =
tan
)
pure sand and = c
sg
+ tan ) for sand
reinforced
geotextile with the assumption of normal stress of 1
unit. Table 4 shows the results of the calculation of
shear strength.
Table 4 The sand shear strength with the assumption of
normal load 1 unit
Sample
Treatment
25% 50% 75%
τ (kg / cm
2
) τ (kg / cm
2
) τ (kg / cm
2
)
Without
geotextile
0669 0615 0589
Woven
vertical
0.681 0712 0.819
Woven
horizontal
0717 0743 0767
Non-
woven
vertical
0696 0770 0861
Non-
woven
horizontal
0846 0851 0877
Figure 3 Graph relationship shear strength (kg / cm
2
) with
sample tests on the density of 25%
Shear strength sand after the addition of geotextile
on the density of a 25% increase, with strong
maximum shear on samples of sand by geotextile
non-woven horizontally by 0.846 kg/cm
2
and a
minimum in samples of sand by woven geotextile
vertically by 0.681 kg/cm
2
.
The increase in the pure shear strength with
vertical woven geotextile reinforced sand was 1.8%,
and the pure sand with horizontal woven geotextile
reinforced sand was 7.2%. Pure sand with sand
reinforced with non-woven geotextiles vertically by
4.1% and pure sand with sand reinforced by
horizontal non-woven geotextiles by 26%. The
horizontal use of geotextiles indicates a greater
increase than the use of vertical geotextiles based on
data on the increase in sand shear intensity at a density
of 25%.
Figure 4 Graph of the relationship of shear strength (kg /
cm
2
) with the Test Sample at a density of 50%.
The shear strength of sand after the addition of
geotextiles at a density of 50% has increased, with the
maximum shear strength in sand samples given
horizontal non-woven geotextiles of 0.851 kg /cm
2
and minimum sample was woven geotextile sand by
vertically by 0.712 kg / cm
2
.
The increase in pure shear strength with vertical
woven geotextile reinforced sand was 15.7%, pure
sand with horizontal woven geotextile reinforced
Laboratory Study on Shear Strength of Soil using Woven and Non-woven Geotextiles
61

sand was 20.8%. pure sand with vertical sand
reinforced by non-woven geotextiles by 25.2% and
pure sand with horizontal non-woven geotextile
reinforced sand by 38.3%. Based on the data on the
increase in the shear strength of sand at a density of
50%, the horizontal use of geotextiles shows a greater
increase than the use of vertical geotextiles.
Figure 5 Graph of the relationship of shear strength (kg /
cm
2
) with the Test Sample at a density of 75%
The Shear strength of sand after the addition of
geotextiles at a density of 75% has increased, with the
maximum shear strength in sand samples given
horizontal non-woven geotextiles of 0.877 kg/cm
2
and minimum sample by woven geotextile sand
horizontally by 0.767 kg / cm
2
.
The increase in pure shear strength with vertical
woven geotextile reinforced sand was 39%, and the
pure sand with horizontal woven geotextile
reinforced sand was 30.2%. Pure sand with vertical
sand reinforced by non-woven geotextiles amounting
to 46.2% and pure sand with horizontal non-woven
geotextile reinforced sand by 48.9%. Based on the
data on the increase in the shear strength of sand at a
density of 75%, the average increase in the use of
geotextiles vertically shows a greater increase than
the use of horizontal geotextiles, namely 42.6%
versus 39.6%.
5 CONCLUSION
Based on the actual results of this research, it can be
inferred as follows:
1. Shear strength of pure sand or without geotextile
reinforcement decreases with each increase in the
average relative density of 6.15%
2. Vertical has an increase with each addition of
relative density by an average of 9.75%.
3. The shear strength of sand that is reinforced with
woven geotextiles installed horizontally has an
increase with each addition of an average relative
density of 3.4%.
4. The shear strength of sand that is reinforced with
non-woven geotextiles installed vertically has an
increase with each addition of an average relative
density of 11%.
5. The shear strength of sand that is reinforced with
non-woven geotextiles installed horizontally
increases with each addition of an average relative
density of 1.8%.
6. The increase in shear strength in geotextile
reinforced samples vertically is greater than
horizontally at a density of 25% and 50%,
whereas at a density of 75% states the opposite.
ACKNOWLEDGMENTS
The authors would like to sincerely thank the Head of
UP2M Jakarta State Polytechnic for providing
support for this research through the PNJ DIPA
funding. The authors also honor the PNJ Department
of Civil Engineering's Head of Laboratory for
granting permission to use laboratory facilities..
The Geotextiles were provided by PT Mitra Hijau
Lestari, Indonesia. We highly appreciate this support.
REFERENCES
Abu-Farsakh MY, Coronel J, Tao M (2007) Effect of soil
moisture content and dry density on cohesive soil–
geosynthetic interactions using large direct shear tests.
J Mater Civ Eng 19(7):540–549
Aldeeky, H., O. Al Hattamleh, and B. A. Alfoul. 2016.
“Effect of Sand Placement Method on the Interface
Friction of Sand and Geotextile.” International Journal
of Civil Engineering 14 (2): 133–138.
doi:10.1007/s40999-016-0019-0.
Anubhav Basudhar PK (2013) Interface behaviour of
woven geotextile with rounded and angular particle
sand. J Mater Civ Eng ASCE 25(12):1970–1974
Anubhav, W. H. 2015. “Modelling of Non-linear Shear
Displacement Behaviour of Soil–Geotextile Interface.”
International Journal of Geosynthetics and Ground
Engineering 1: 19. doi:10.1007/s40891- 015-0021-7
Abu-Farsakh MY, Coronel J, Tao M (2007) Effect of soil
moisture content and dry density on cohesive soil–
geosynthetic interactions using large direct shear tests.
J Mater Civ Eng 19(7):540–549
Aldeeky, H., O. Al Hattamleh, and B. A. Alfoul. 2016.
“Effect of Sand Placement Method on the Interface
Friction of Sand and Geotextile.” International Journal
of Civil Engineering 14 (2): 133–138.
doi:10.1007/s40999-016-0019-0.
ASAIS 2020 - Annual Southeast Asian International Seminar
62

Anubhav Basudhar PK (2013) Interface behaviour of
woven geotextile with rounded and angular particle
sand. J Mater Civ Eng ASCE 25(12):1970–1974
Anubhav, W. H. 2015. “Modelling of Non-linear Shear
Displacement Behaviour of Soil–Geotextile Interface.”
International Journal of Geosynthetics and Ground
Engineering 1: 19. doi:10.1007/s40891- 015-0021-7
Athanasopoulos GA (1993) Effect of particle size on the
mechanical behaviour of sand-geotextile composites.
Geotext Geomembr 12(3):255–273
Bauer GE, Zhao Y (1994) A realistic stress transfer model
for geogrids in pullout. In: Proceedings of the 5th
International Conference on Geotextiles,
Geomembranes and Related Products, vol 1. Singapore,
pp 457–460
Bergado, D. T., G. V. Ramana, H. Sia, and I. Varun. 2006.
“Evaluation of Interface Shear Strength of Composite
Liner System and Stability Analysis for a Landfill
Lining System in Thailand.” Geotextiles and
Geomembranes 24 (6): 371–393.
doi:10.1016/j.geotexmem.2006.04.001
Brahim, A., A. Arab, M. Belkhatir, and I. Shahrour. 2016.
“Laboratory Study of Geotextiles Performance on
Reinforced Sandy Soil.” Journal of Earth Science 27:
1060. doi:10.1007/s12583-015-0621-0
Cerato AB, Lutenegger AJ (2006) Specimen size and scale
effects of direct shear box tests of sands. Geotech Test
J 29(6):1–10. doi:10.1520/GTJ100312
Choudhary AQ, Krishna AM (2016) Experimental
investigation of interface behaviour of different types
of granular soil/geosynthetics. Int J Geosynth Ground
Eng 2(1):1–11. doi:10. 1007/s40891-016-0044-8
Day, R.W., 2000, Geotechnical Engineer’s Portable
Handbook, Mc Graw Hill, New York
Dixon, N., and D. R. V. Jones. 2005. “Engineering
Properties of Municipal Solid Waste.” Geotextiles and
Geomembranes 23 (3): 205–233.
doi:10.1016/j.geotexmem.2004.11.002.
Hatami, K., and D. Esmaili. 2015. “Unsaturated Soil –
Woven Geotextile Interface Strength Properties from
Small-scale Pullout and Interface Tests.” Geosynthetics
International 22 (2): 161–172. doi:10.1680/
gein.15.00002.
Hossain B, Hossain Z, Sakai T (2012) Interaction properties
of geosynthetic with different backfill soils. Int J Geosci
3:1033–1039. doi:10.4236/ijg.2012.35104
Jewell RA, Wroth CP (1987) Direct shear tests and
reinforced sand. Ge´otech 37(1):53–68
Jewell, R.A., 1996, Soil Reinforcement with Geotextiles,
CIRIA, London
Jose D., Infante U., Martin GAM, Ariel P. Eberhardt M.,
(2016), Shear Strength Behavior of Different
Geosynthetic Reinforced Soil Structure from Direct
Shear Test, Int. J. of Geosynth. and Ground Eng. (2016)
2:17, Springer International Publishing Switzerland.
Kim D, Ha S (2014) Effects of particle size on the shear
behaviour of coarse grained soils reinforced with
geogrid. Mater 7:963–979. doi:10.3390/ma7020963
Liu CN, Ho YH, Huang JW (2009) Large scale direct shear
tests of soil/PET-yarn geogrid interfaces. Geotext
Geomembr 27:19–30
Lopes ML, Silvano R (2010) Soil/geotextile interface
behavior in direct shear and pullout movements.
Geotech Geol Eng 28:791–804
Moayedi H, Huat BBK, Kazemian S, Asadi A (2010)
Optimization of tension absorption of geosynthetics
through reinforced slope. Electron J Geotech Eng
15(2):93–104. Available at the website ejge.com at
http://www.ejge.com/2010/Ppr10.010/Ppr10.010.pdf
Omar AH, Samer R, Hussein dan Husam AQ. (2019).
Evaluating aqaba marine sand geotextile interface shear
strength, International Journal of Geotechnical
Engineering,
https://doi.org/10.1080/19386362.2019.1651985
Palmeira EM (1999) Execution and interpretation of
laboratory tests on geosynthetic material (in
Portuguese). In: Proceedings of the 1st south-American
symposium on geosynthetics, ABMSISSMGE, vol 1.
Rio de Janeiro, pp 87–108
Palmeira EM (2008) Soil-geosynthetic interaction:
modeling and analysis. Geotext Geomembr 27(5):368–
390
Punetha, P., P. Mohanty, and M. Samanta. 2017.
“Microstructural Investigation on Mechanical Behavior
of Soil-geosynthetic Interface in Direct Shear Test.”
Geotextiles and Geomembranes 45 (3): 197–210.
doi:10.1016/j.geotexmem.2017.02.001.
Rifa’i, A., (2003), Perilaku Interaksi Tanah-Geotekstil
Terhadap Parameter Kuat Geser, dinamika TEKNIK
SIPIL, Volume 9, Nomor 1, Januari 2009 : 92 – 100,
Yogyakarta.
Saya˜o ASFJ, Sieira ACCF (2012) Evaluation of direct
shear tests on geogrid reinforced soil. Soils Rocks
35(1):65–74
Takasumi DL, Green KR, Holtz R (1991) Soil–
geosynthetics interface strength characteristics: a
review of state-of the-art testing procedures. In:
proceedings of the geosynthetics’91 conference,
Atlanta 1:87–100
Tan SA, Chew SH, Wong WK (1998) Sand–geotextile
interface shear strength by torsional ring shear tests.
Geotext Geomembr 16(3):299–328
Tuna SC, Altun S (2012) Mechanical behaviour of sand–
geotextile interface. Sci Iran 19(4):1044–1051
Vangla P, Latha GM (2015) Influence of particle size on the
friction and interfacial shear strength of sands of similar
morphology. Int J Geosynth Ground Eng 1(6):1–12.
doi:10.1007/ s40891-014-0008-9
Vieira CS, Lopes ML (2013) Soil-geosynthetic interface
shear strength by simple and directshear tests. In:
Proceedings of the 18th international conference on soil
mechanics and geotechnical engineering, Paris 1:3497–
3500
Vieira, C. S., M. L. Lopes de, and L. Caldeira. 2015. “Sand-
nonwoven Geotextile Interfaces Shear Strength by
Direct Shear and Simple Shear Tests.” Geomechanics
and Engineering 9 (5): 601–618. doi:10.12989/
gae.2015.9.5.601.
Laboratory Study on Shear Strength of Soil using Woven and Non-woven Geotextiles
63

Wang, J., F. Y. Liu, P. Wang, and Y. Q. Cai. 2016. “Particle
Size Effects on Coarse Soil-geogrid Interface Response
in Cyclic and Post-cyclic Direct Shear Tests.”
Geotextiles and Geomembranes 44 (6): 854–861.
doi:10.1016/j.geotexmem.2016.06.011
ASAIS 2020 - Annual Southeast Asian International Seminar
64
