
The Effect of Fermented White Corn Flour and Wheat Flour
Formulation on the Quality of Cookies
Jessica Selvira
1
, Rahmawati Rahmawati
1
, Rijanti Rahaju Maulani
2
, Dase Hunaefi
3
and Dede Saputra
4
1
Study Program of Food Technology, Faculty of Food Techonology and Health, Sahid University, Jakarta, Indonesia
2
Study Program of Post-Harvest Technology, School of Life Science Technology, Institut Teknologi Bandung, Indonesia
3
Departement of Science and Food Technology, Faculty of Agricultural Technology, IPB University, Bogor, Indonesia
4
Departement Food Technology, Bina Nusantara University, Jakarta, Indonesia
Keywords: Fermented White Corn Flour, Wheat Flour, Cookies.
Abstract: Cookies are a type of cookie that is small, crispy, has a sweet taste and can be eaten by all ages. The thing to
consider in cookie processing is crispness. Fermented white corn flour as a result of the Response Surface
Method (RSM) optimization has a setback viscosity value close to wheat flour, so that when used as a raw
material to make cookies, it will increase its crispness. This research aims to study the effect of fermented
white corn flour and wheat flour formulation in cookie making. The formulations ratio of fermented white
corn flour and wheat flour tested were: 0:100; 20:80; 40:60; 60:40; and 80:20. The results showed that the
higher of the formulation of fermented white corn flour, the lower the hardness of cookies, ash content, and
protein content, because the moisture content tends to increase. Based on physical, chemical and organoleptic
tests, the formulation of fermented corn flour and wheat flour (20:80) is a formulation that can be produce
quality cookies. The quality characteristics of the cookie produced are 3462.42 gF texture, 1.47% moisture
content, 2.43% ash content, 7.29% protein content, 24.74% fat content, 64.08% carbohydrate content, and
1.34% crude fiber.
1 INTRODUCTION
Cookies are a type of cookie that is small, crispy, has
a sweet taste, is a popular food product that can be
consume by various consumer segments. According
to National Standardization Agency of Indonesia
(2011), cookies are a type of biscuit made from a soft
dough, crispy and when broken, the texture looks less
dense. Generally cookies are made from wheat flour,
sugar and egg. Cookies can be made by other types of
flour besides wheat flour. The research by Kausar et
al. (2018) showed that cookies with carrot pomace
powder 12% has sensory evaluation of 8,2 crispness
value and 8,4 overall acceptability, it means like very
much by panelists. The research by Alflen et al.
(2016) showed that cookies with taro flour 30% has a
preference level of 6,9 it means like moderately by
panelists. Singh et al. (2008) conducted a study on
sweet potato flour cookies, the best results with sweet
potato flour 40% has crispness value of 3,7 it means
fragile (breaks easily when consumed) and an overall
acceptability of 3,6 which is acceptable to the
panelists.
Another study conducted by Suarni (2005),
substitution wheat flour with 80% corn flour has
crispness value of 2,95 it means rather like by
panelists. The advantage of cookies made from 80%
corn flour has a higher fiber content (3,59%)
compared to cookies made from 100% corn flour
(0,98%) (Suarni, 2009). The research by Purnamasari
(2019) showed that fermented white corn flour as a
result of optimization of the Response Surface
Method (RSM) has the lowest setback viscosity value
among other fermentation treatments, that is 1039,00
cP. The low setback viscosity will increase its
crispness and texture of product not as hard as other
fermentation treatments, so that fermented corn flour
is suitable for use in making cookies. Therefore, the
thing that must be considered when processing
cookies is crispness (Widiantara et al., 2018).
Based on the description above, this research was
carried out on the effect of fermented white corn flour
as a result of optimization of the RSM and wheat flour
formulation in making cookies. The formulation
using fermented white corn flour as a result of
38
Selvira, J., Rahmawati, R., Maulani, R., Hunaefi, D. and Saputra, D.
The Effect of Fermented White Corn Flour and Wheat Flour Formulation on the Quality of Cookies.
DOI: 10.5220/0010513800003108
In Proceedings of the 6th Food Ingredient Asia Conference (6th FiAC 2020) - Food Science, Nutrition and Health, pages 38-46
ISBN: 978-989-758-540-1
Copyright
c
2022 by SCITEPRESS – Science and Technology Publications, Lda. All rights reserved
optimization of the RSM was chosen because it has a
low setback viscosity value.
2 MATERIALS AND METHODS
2.1 Materials
The ingredient used in making of cookies are
fermented white corn flour as a result of the
optimization RSM (Purnamasari, 2019), Kunci Biru
brand flour (8-9% protein content), Blueband
margarine, chicken egg, Dancow brand full cream
milk, sugar, baking soda (NaHCO
3
), and vanilla.
The chemicals used for protein content analysis
include concentrated sulfuric acid (H
2
SO
4
), mercury
oxide (HgO), potassium sulfate solution (K
2
SO
4
),
sodium hydroxide solution (NaOH), sodium
thiosulfate solution (Na
2
SO
3
), saturated boric acid
solution (H
3
BO
3
), hydrochloric acid solution (HCl).
The chemicals used for fat content analysis is hexane.
The chemicals used for crude fiber content analysis is
concentrated sulfuric acid (H
2
SO
4
), etc. The
chemicals used are materials that are in the Chemical
Laboratory of Bogor Agricultural Institute.
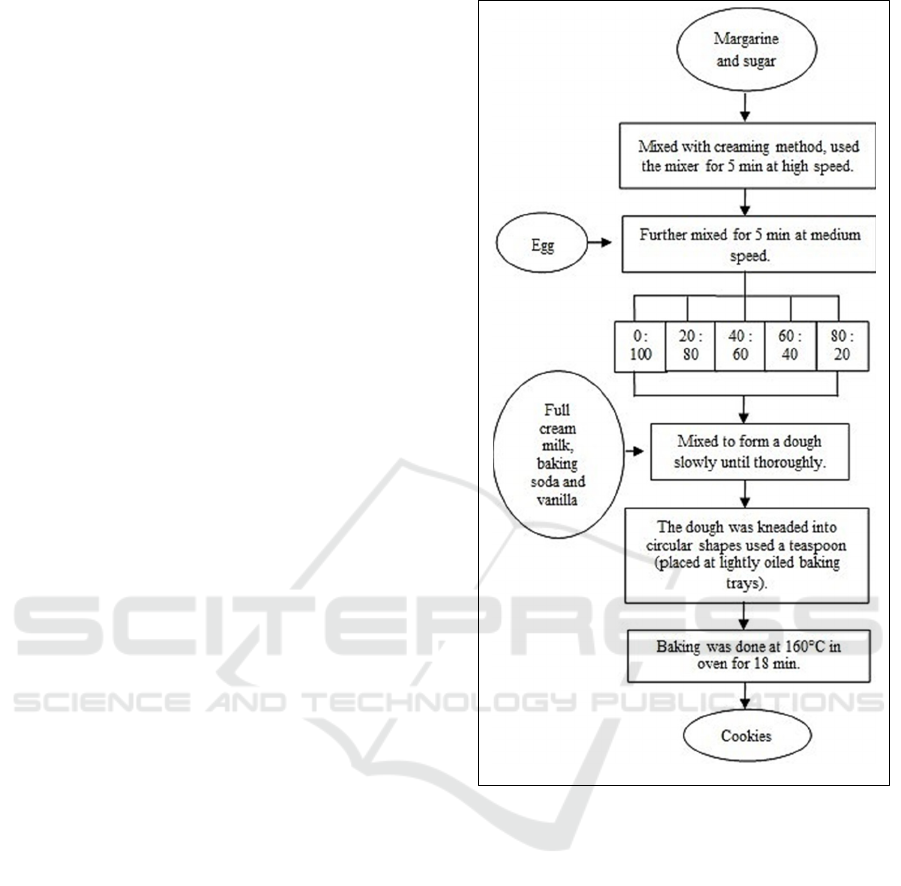
2.2 Methods
The process of making fermented white corn flour
cookies consists of 3 stages: mixing, molding, and
baking. The flowchart of the process making
fermented white corn flour cookies can be seen in
Figure 1.
2.2.1 Mixing
The first mixing are margarine and sugar, used the
mixer at high speed for 5 minutes until homogeneous
and creamy. After that, the second mixing with
addition of 1 egg and mixed at medium speed for 5
minutes.
The third stage of mixing is the addition of
fermented white corn flour and wheat flour
(formulation 0:100; 20:80; 40:60; 60:40; and 80:20),
full cream milk, baking soda, and vanilla, mixed to
form a dough slowly until thoroughly and can be
molded. The quantity of materials used can be seen in
Table 1.
Figure 1: Flowchart of making fermented white corn flour
cookies (modified) (Okpala & Ofoedu, 2018).
2.2.2 Molding
Molding was done by used the drop cookies method,
the dough was kneaded into circular shapes used a
teaspoon and then placed at lightly oiled baking trays.
2.2.3 Baking
The main purpose of the baking process is to improve
the quality of food (quality eating) of the raw
materials, as well as to add variety to foods. Cookies
that have been molded and placed at lightly oiled
baking trays are baked in the oven at 160°C for 18
minutes.
The Effect of Fermented White Corn Flour and Wheat Flour Formulation on the Quality of Cookies
39

Table 1: Composition of raw materials in the production of
fermented white corn flour cookies.
Raw Materials Quantit
y
(g) %
J : T 130,00 40,37
Suga
r
70,00 21,74
Mar
g
arine 63,00 19,57
Full cream
p
owdered mil
k
13,00 4,04
Baking soda 4,00 1,24
Vanilla 2,00 0,62
E
gg
40,00 12,42
Total 322,00 100,00
Note: J = Fermented white corn flour; T : Wheat flour
2.2.4 Testing Techniques
Quality testing of cookies was done through physical
quality (hardness) used a Texture Analyzer XT21
Stable Micro System, quality chemical include
moisture content with oven method (AOAC, 2006),
ash content with furnace method (AOAC, 2006),
protein content with Kjedahl method (AOAC, 2006),
fat content with soxhlet method (AOAC, 2006),
carbohydrate content (by difference) and crude fiber
content (SNI 01-2891-1992); organoleptic quality
(hedonic quality for color, aroma, taste and crispness;
and test ranking based on the overall level of
preference) (Permadi, et al., 2018 and
Ebookpangan.com, 2006).
3 RESULT AND DISCUSSION
3.1 Texture Physical Quality
(Hardness)
Hardness of cookies were tested used a Texture
Analyzer XT21 Stable Micro System. Hardness value
of cookies (gF) decrease along with the increase in
the substitution concentration of fermented corn
flour. The results of the analysis of variance showed
that the different formulations of fermented corn flour
and wheat flour did not significantly affect the
hardness value of cookies. The graph of average
hardness of cookies is presented in Figure 2.
Figure 2: The graph of average hardness (gf) cookies.
The smaller the value obtained, the softer the
texture of the cookies. The greater the value obtained,
the greater the hardness, meaning the texture of the
cookie is getting drier and crispy. Hardness value of
cookies with fermented corn flour substitution
highest in the treatment with a concentration of 20%
i.e 3462,42 gF and the lowest in the treatment with
fermented corn flour concentration of 80% i.e
2678,69 gF. This shows that the smaller the
composition of fermented corn flour to 20% can
increase the crispness of the cookies. According to
Wulandari et al. (2016), the moisture content, fat
content, carbohydrate, protein and all the ingredients
used can determine the texture of the cookies.
3.2 Chemical Quality
3.2.1 Moisture Content
The moisture content in a food item affects the
freshness and durability of food. Moisture content
also affects physical properties such as hardness. The
higher moisture content causes the cookies to be less
crispy (Widiantara et al., 2018). The moisture content
of cookies with fermented corn flour substitution is
highest in treatment with a concentration of 40% i.e
2,13% and the lowest in treatment with a
concentration of 20% i.e 1,47%. The moisture content
of cookies in this research fulfills the SNI 2973:2011
requirements, i.e maksimum of 5%. The graph of
average moistue content of cookies can be seen in
Figure 3.
6th FiAC 2020 - The Food Ingredient Asia Conference (FiAC)
40
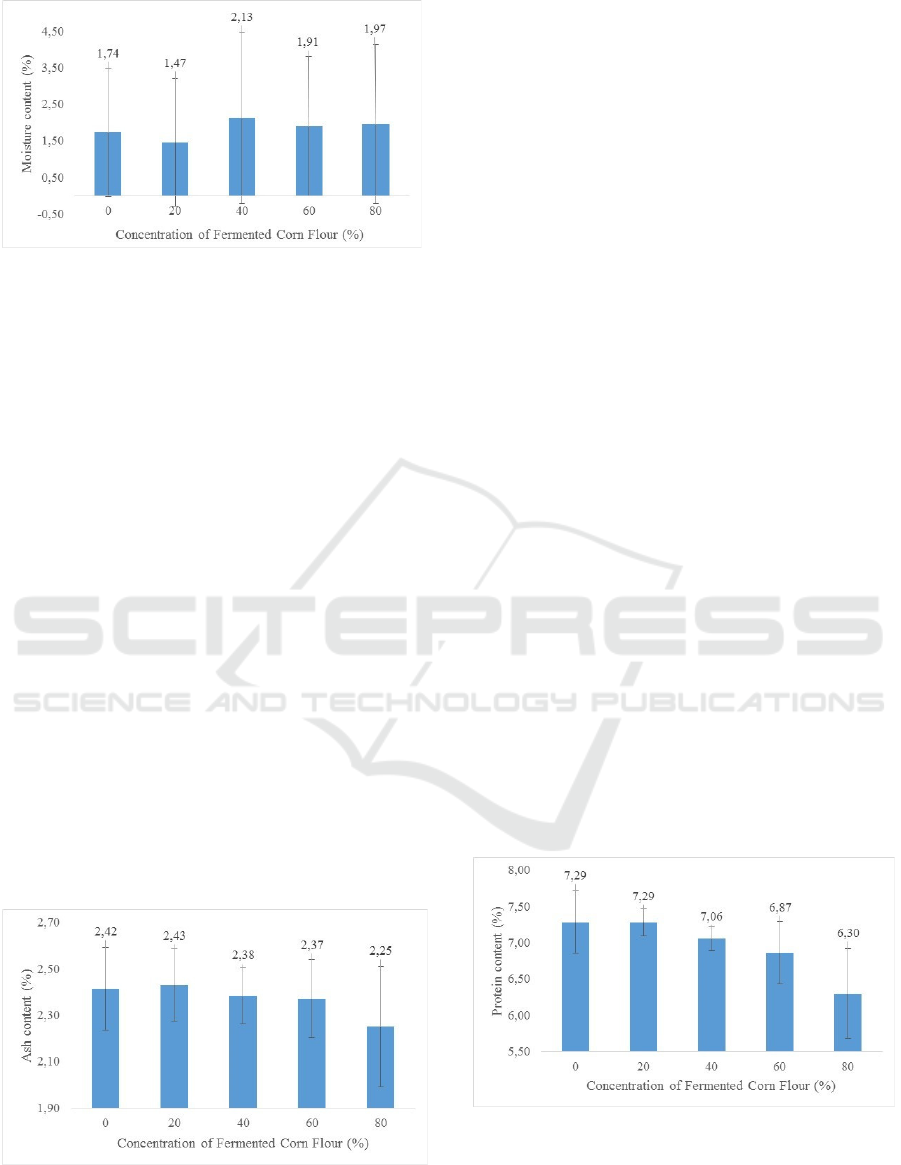
Figure 3: The graph of average moisture content of cookies.
Based on the graph, it can be seen that the
moisture content of cookies with fermented corn flour
concentration of 40, 60 and 80% tend higher than
cookies without fermented corn flour, although there
is no significant difference. The lowest the moisture
content, the higher of the hardness of cookies, it
makes the texture becomes crispy.
This is in accordance with the treatment with a
concentration of fermented corn flour of 20% which
indicates the lowest moisture content has the highest
hardness value. Cookies absorb water from the
surrounding air due to the hygroscopic nature of
wheat flour (Kausar et al., 2018).
3.2.2 Ash Content
The amount of minerals in the ingredients used in
making cookies will affect of the ash content value
(Wulandari et al., 2016)
.
The higher the mineral
content, the higher of the ash content value obtained.
The ash content of cookies with fermented corn flour
substitution is highest in treatment with a
concentration of 20% i.e 2,43% and the lowest in
treatment with a concentration of 80% i.e 2,25%. The
graph of average ash content of cookies can be seen
in Figure 4.
Figure 4: The graph of average ash content of cookies.
Based on the graph, it can be seen that the ash
content of cookies decrease with the increase in the
substitution concentration of fermented corn flour.
However, the results of the analysis of variance
showed that the different formulations of fermented
corn flour and wheat flour did not significantly affect
the ash content of cookies.
3.2.3 Protein Content
The protein in cookies is influenced by the
composition of the constituent ingredients, especially
the flour used because in this research the
composition of the flour used is different. Wheat flour
used is a type of low protein flour (8-9%) and the
fermented corn flour used has a protein content of
6,90%. So that by increasing the concentration of
fermented corn flour substitution will reduce the
protein content of cookies.
Protein content of cookies with fermented corn
flour substitution is highest in treatment with a
concentration of 0% and 20% i.e 7,29% and the
lowest in treatment with a concentration of 80% i.e
6,30%. Protein content of cookies in this research
fulfills the SNI 2973:2011 requirements, i.e minimum
of 5%. Graph of average protein content (%) cookies
can be seen in Figure 5.
Based on the graph, it can be seen that the higher
the concentration of fermented corn flour, the lower
the protein content, although the results of the
analysis of variance showed that the different
formulations of fermented corn flour and wheat flour
did not significantly affect the value of the protein
content of cookies. From the results of his research,
(Suarni, 2005) reported that the higher the
concentration of corn flour, the lower the portein
content in cookies.
Figure 5: The graph of average protein content of cookies.
3.2.4 Fat Content
Fat can improve the physical structure of cookies,
such as development, tenderness, texture, and aroma.
The Effect of Fermented White Corn Flour and Wheat Flour Formulation on the Quality of Cookies
41
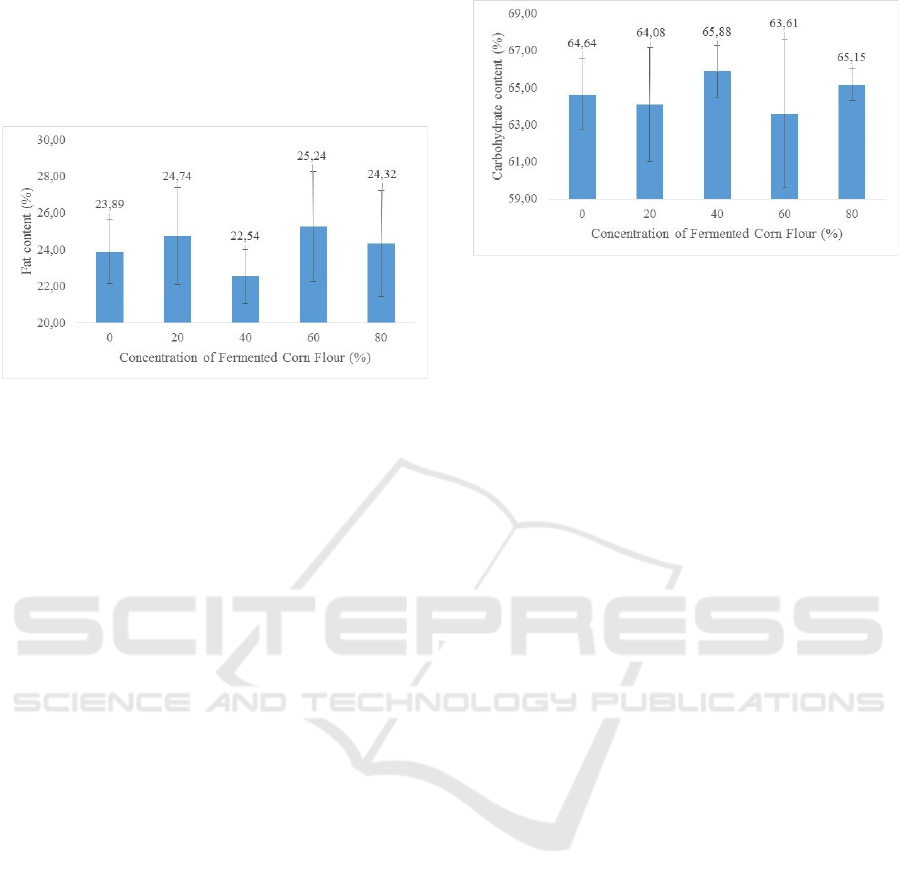
Based on the results of analysis of variance, the
different formulations of fermented corn flour and
wheat flour did not significantly affect the fat content
of cookies. The graph of average fat content of
cookies can be seen in Figure 6.
Figure 6: The graph of average fat content of cookies.
Based on the graph, it can be seen that the fat
content of cookies tends to fluctuate. Even so, the fat
content of cookies with the substitution of fermented
corn flour with a concentration of 60% tends to show
the highest value i.e 25,24% and the lowest at a
concnetration of 40% i.e 22,54%. According to
Wulandari et al. (2016), the fat content of cookies is
influenced by the addition of margarine and egg.
Margarine contains lipids that are bound as
lipoprotein and cause cookies to have a high fat
content when added with margarine. The results of
research Suarni (2005) showed that the fat content of
cookies was higher along with the increasing
concentration of corn flour substitution.
3.2.5 Carbohydrate Content
Carbohydrate can determining the characteristic of
food ingredients such as color, because carbohydrate
contain reducing sugars which when reacting to the
amino groups of the protein cause a non-enzymatic
browning reaction (Wulandari et al., 2016).
Carbohydrate are also a major source of calories. The
results of analysis of variance showed that the
different formulations of fermented corn flour and
wheat flour did not significantly affect the
carbohydrate content of cookies. The graph of
average carbohydrate content of cookies can be seen
in Figure 7.
Figure 7: The graph of average carbohydrate content of
cookies.
Based on the graph, it can be seen that the
carbohydrate content of cookies tends to fluctuate.
The carbohydrate content of cookies with fermented
corn flour substitution tends to have the highest value
in the treatment with a concentration of 40% i.e
65,88% and the lowest at a concentration of 60% i.e
63,61%.
The results of this research indicate that cookies
with the highest carbohydrate content (65,88%) at
40% fermented corn flour concentration has the
lowest fat content (22,54%) and cookies with the
lowest carbohydrate content (63,61%) at 60%
fermented corn flour concentration has the highest fat
content (25,24%). The carbohydrate content is
calculated by difference and is influenced by the
water, ash, protein and fat content . Wulandari et al.
(2016) states that the higher component of other
nutrients (water, ash, protein and fat) then
carbohydrates content decreases.
3.2.6 Crude Fiber Content
Crude fiber is needed by the body because it is good
for digestion. Crude fiber can prevent constipation
(difficulty defecating), so cookies with high crude
fiber contentare good for the body (Wulandari et al.,
2016). The results of analysis of variance showed that
the different formulations of fermented corn flour and
wheat flour did not significantly affect the crude fiber
content of cookies. The graph of average crude fiber
content of cookies can be seen in Figure 8.
6th FiAC 2020 - The Food Ingredient Asia Conference (FiAC)
42

Figure 8: The graph of average crude fiber content of
cookies.
Based on the graph, it can be seen that the value
of crude fiber of cookies with fermented corn flour
substitution of 20%, 40%, 60% and 80% tends to be
higher than cookies without fermented corn flour.
Crude fiber of cookies with fermented corn flour
substitution is highest in a treatment with a
concentration of 40% i.e 1,63% and the lowest at a
concentration of 0% i.e 1,02%. A similar trend was
observed by Suarni (2005) which states that corn
flour based cookies has a higher crude fiber than
cookies made from 100% wheat flour.
3.3 Organoleptic Quality
The organoleptic quality of cookies was determined
based on the hedonic quality test assesment and
ranking test with 25 semi-trained panelists. In the
hedonic quality test, the panelists expressed an
impression of good or bad about the product. In the
ranking test, panelists were asked to measure the
preference level of overall product. The parameters
used were color, aroma, taste and crispness. The
results of analysis of variance showed that the
different formulations of fermented corn flour and
wheat flour did not significantly affect the
organoleptic quality of cookies. The results of the
organoleptic quality analysis are shown in Table 2.
3.3.1 Color
The color produced by cookies is influenced by a non-
enzimatic browning reaction (Maillard reaction)
which is caused by a reaction between sugars and
amino groups of protein during the baking process
(Wulandari et al., 2016). The results of the hedonic
quality test of color parameters (Table 2), the
different formulations of fermented corn flour and
wheat flour showed a color scale ranged from 2,84 –
4,68 (light brown – brownish yellow).
There is a tendency that the higher the
concentration of fermented corn flour substitution,
the higher the assessment of the cookies color scale,
it means that the cookies produced has a yellowish
brown color. The color hedonic quality test of cookies
with fermented corn flour substitution is highest in
treatment with a concentration of 20% i.e 4,21
(yellowish brown) and the lowest in treatment
without fermented corn flour i.e 3,28 (light brown).
3.3.2 Aroma
The aroma parameter tested is the strength of the corn
aroma that still smells on the cookies produced. The
hedonic quality test of cookies aroma ranged from
3,08 – 3,64 (strong slightly – not strong) (Table 2).
The aroma of the cookies was determined by the
ingredients used in the cookies.
According to Suarni (2009), the aroma of the
cookies is influenced by the components of the
ingredients used and their comparisons, such as
margarine, egg, additives, and types of flour. So that
the different formulations of fermented corn flour and
wheat flour will affect the aroma of the cookies
produced.
This is confirmed by Sitohang et al. (2015) which
states that mixing margarine and egg can cause a
distinctive smell of dough and the baking process also
affect the aroma of cookies. The results of aroma
hedonic quality test showed a tendency that the higher
Table 2: Panelist preferences value for color, aroma, taste and crispness of cookies with different formulation of fermented
corn flour and wheat flour.
Formulation of fermented
corn flour and wheat flour
Hedonic Quality Scale
Color Aroma Taste Crispness
0 : 100 3,28±0,6 3,40±0,1 3,45±0,2 4,12±0,5
20 : 80 4,21±0,4 3,40±0,2 3,45±0,1 3,85±0,7
40 : 60 4,20±0,1 3,35±0,3 3,24±0,2 2,75±0,4
60 : 80 3,89±0,6 3,31±0,1 3,25±0,4 3,43±0,2
80 : 20 4,12±0,4 3,23±0,2 2,91±0,2 2,76±0,8
Notes:
Color Scale: 1 = blackish brown, 2 = brown, 3 = light brown, 4 = yellowish brown, 5 = brownish yellow.
Aroma and Taste Scale: 1 = very strong, 2 = strong, 3 = strong slightly, 4 = not strong, 5 = very not strong.
Crispness Scale: 1 = very not crispy, 2 = not crispy, 3 = crispy slightly, 4 = crispy, 5 = very crispy.
The Effect of Fermented White Corn Flour and Wheat Flour Formulation on the Quality of Cookies
43
substitution concentration of fermented flour, the less
aroma of cookies, it means that the cookies produced
has a strong slightly corn aroma.
The aroma hedonic quality test of cookies with
fermented corn flour substitution is highest in
treatment with a concentration of 0% and 20% i.e
3,40 and the lowest in treatment with a concentration
of 80% i.e 3,23 has the same aroma, that is strong
slightly. This is because the strong aroma of
fermented corn flour has been mixed with other
ingredients used, so the aroma of corn in the cookies
produced is not too strong.
3.3.3 Taste
The taste parameter tested on the panelists is the
strength of the taste corn on the cookies produced.
The taste hedonic quality test of cookies ranged from
2,80 – 3,64 (strong slightly – not strong) (Table 2).
The result of research by Suarni (2005) showed that
the higher substitution concentration of fermented
corn flour, the taste of the cookies produced was like
slightly by the panelists. This is because the taste of
the corn in the cookies can still be felt by the panelists.
The results of taste hedonic quality test showed a
tendency that the higher the substitution
concentration of fermented corn flour, the taste of
cookies will decrease, it means that the cookies
produced has a strong slightly corn taste. The taste
hedonic quality test of cookies with fermented corn
flour substitution is highest in treatment with a
concentration of 0% and 20% i.e 3,45 and the lowest
in treatment with a concentration of 80% i.e 2,91 has
the same taste, that is strong slightly.
3.3.4 Crispness
The crispness hedonic quality test of cookies ranged
from 2,12 – 4,56 (not crispy – crispy). The crispness
of the cookies is influenced by the wheat flour and
fermented corn flour use. Both of the flours contain
low protein. The lower the protein value, the
crispness will decrease. A similar tren was observed
by Wulandari et al. (2016) which states that the
crispness of substitution 30% breadfruit flour to
cookies is not crispy because breadfruit flour contains
a small amount of protein.
The results of crispness hedonic quality test
showed a tendency that at concentration of fermented
corn flour of 0% and 20% cookies are crispy at
concentration of 40%, 60% and 80% cookies are
crispy slightly. Moisture content also affects the
crispness of cookies.
The test results showed that the higher the
substitution concentration of fermented corn flour,
the hardness value of cookies decreases, the moisture
content tends to increase and the crispness hedonic
quality decreases (not crispy). This is in line with the
results of physical tests (texture) and chemical test
(moisture content) that have been conducted.
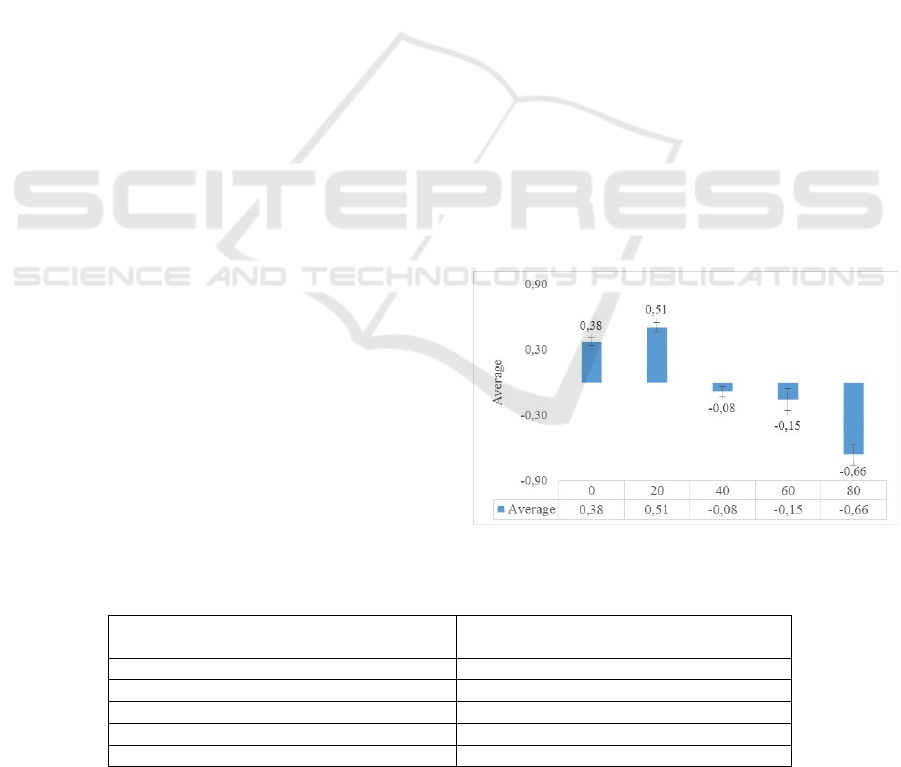
3.3.5 Ranking Test
The ranking test are performed based on overall
liking level. Panelists evaluate the sample from
number 1 the most preferred to number 5 the most
dislike. From the result, the sequence is converted
into Fischer and Yates table scores. The results of the
cookies ranking test in the treatment with fermented
corn flour concentrations of 0% and 20% obtained
positive values, while the concentrations of 40%,
60% and 80% obtained negative values. The results
of the ranking test are shown in Figure 9.
Figure 9: The graph of average of ranking test.
Table 3: Significance of the overall preference of fermented corn flour cookies.
Formulation of fermented corn flour and
wheat flou
r
Score of Average Ranking Test (*)
0 : 100 0,3800±0,0
b
20 : 80 0,5100±0,0
a
40 : 60 -0,0800±0,0
c
60 : 40 -0,1533±0,1
c
80 : 20 -0,6567±0,1
d
Note: *) Mean numbers followed by different letters indicate significant difference according
to the DMRT test at α = 0,05.
6th FiAC 2020 - The Food Ingredient Asia Conference (FiAC)
44

Based on the graph, it can be seen that the higher
the substitution concentration of fermented corn
flour, the lower the level of panelists preference for
overall cookies. The results of analysis of variance
showed that the different formulations of fermented
corn flour and wheat flour have a significantly affect
on the panelist assessment of the overall cookie
produced. The significance of differences is shown in
Table 3.
The data in Table 3 showed that the substitution
concentration of 80% fermented corn flour (80:20)
resulted in a lower panelists assessment and were
significantly different from other treatments. This is
because the higher the substitution concentration of
fermented corn flour, the physical test value of the
texture hardness of cookies decreases (the cookies is
softer) in line with the organoleptic quality of
crispness hedonic decreases (not crispy).
Thus, the panelists evaluated the overall dislike
along with the increased concentration of fermented
corn flour substitution. The result of ranking test
showed that the panelists liked the cookies with the
formulation of fermented corn flour and wheat flour
20:80).
4 CONCLUSION
From the results of the research it can be concluded
that different formualtions of fermented corn flour
and wheat flour did not significantly affect on the
parameters of physical quality of texture (hardness),
chemical quality (moisture, ash, protein, fat,
carbohydrate, and crude fiber content) and hedonic
quality (color, aroma, taste and crispness), but
significantly affect in the overall liking level
parameter.
Based on physical, chemical and oragnoleptic
tests, the formulation of fermented corn flour and
wheat flour (20:80) is a formulation that can be
produce quality cookies with the charachteristics:
hardness value 3462,42 gF; moisture content 1,47%;
ash content 2,43%; protein content 7,29%; fat content
24,74%; carbohydrate content 64,08%; crude fiber
content 1,34%. Based on the organoleptic tests, the
color is yeloowish brown, the aroma and taste of corn
is strong slightly and the texture is crispy.
ACKNOWLEDGEMENT
The authors are thankful to Ministry of Research and
Technology and Higher Education Republic of
Indonesia for research funding through the Primary
Reseacrh of Higher Education Program in 2019.
REFERENCES
Alflen, T. A., Quast, E., Bertan, L. C., and Bainy, E. M.
2016. Partial Substitution of Wheat Flour with Taro
(Colocasia esculenta) Flour on Cookie Quality. Revista
Ciencias Exatas e Naturais, 18(2): 202-212.
Association of Official Analytical Chemist. 2006. Official
Methods of Analysis of The Association of Analytical
Chemist. Washington DC: AOAC Inc.
Ebookpangan.com. 2006. Organoleptic Testing in the Food
Industry. Food Technology, Muhammadiyah
University, Semarang. http://tekpan.unimus.ac.id/wp-
content/uploads/2013/07/Pengujian-Organoleptik-
dalam-Industri-Pangan.pdf Accessed 28/6/20.
Kausar, H., Parveen, S., Aziz, M. M., and Saeed, S. 2018.
Production of Carrot Pomace Powder and Its
Utilization in Development of Wheat Flour Cookies.
Journal of Agricultural Research, 56(1): 49-56.
National Standardization Agency of Indonesia. 1992. Food
and Beverages Test. SNI 01-2891-1992.
National Standardization Agency of Indonesia. 2011.
Biscuits. SNI 2973:2011.
Okpala, L. C., and Ofoedu, P. I. 2018. Quality
Characteristics of Cookies Produced From Sweet
Potato and Wheat Flour Blend Fortified with Brewer’s
Spent Grain Flour. Current Research in Nutrition and
Food Science, 6(1): 113-119.
Permadi, M., Oktafa, H. and Agustianto, K. 2018. Design
of Food Sensorical Test System with Testing Preference
Test (Hedonic and Hedonic Quality), Bread Case Study
Tawar, Using Function Network Basis Radial
Algorithm. Mikrotik Journal, 8(1): 29-42.
Purnamasari, W. 2019. Effect of Fermentation Duration
and Amilolytic Culture Addition to Corn Flour Quality.
[Skripsi]. Sahid University, Jakarta.
Singh, S., Riar, C. S., and Saxena, D. C. 2008. Effect of
Incorporating Sweetpotato Flour to Wheat Flour on the
Quality Characteristics of Cookies. African Journal of
Food Science, 2: 65-72.
Sitohang, K. A. K., Lubis, Z., and Lubis, L. M. 2015. The
Effect of Comparison of Total Wheat Flour and
Breadfruit Flour with Stabilizer Types on the Quality of
Breadfruit Cookies. Journal of Food Engineering and
Agriculture, 3(3): 308-315.
Suarni. 2005. Development of Corn Flour Based Pastry
Products in the Framework of Supporting
Agroindustries. Proceedings of the National Seminar of
the Indonesian Agricultural Engineering Association,
Faculty of Agricultural Technology, Padjadjaran
University, LIPI, Bandung.
Suarni. 2009. Prospects of Using Corn Flour for Cookies.
Journal of Agricultural Research, 28(2): 63-71.
Widiantara, T., Arief, D. Z. and Yuniar E. 2018.
Comparative Study of Koro Sword Bean Flour
(Canavalia ensiformis) with Tapioca Flour and Egg
The Effect of Fermented White Corn Flour and Wheat Flour Formulation on the Quality of Cookies
45

Yolk Concentration on Characteristics of Koro
Cookies. Pasundan Food Technology Journal, 5(2):
146-153.
Wulandari, F., Setiani, B. E. and Susanti, S. 2016. Analysis
of Nutritional Content, Energy Value, and
Organoleptic Test of Rice Flour Cookies with
Breadfruit Flour Substitution. Journal of Food
Technology Applications, 5(3): 107-112.
6th FiAC 2020 - The Food Ingredient Asia Conference (FiAC)
46
