
Seismic Vulnerability of Existing Buildings in the Taroudant Urban
Area, Morocco, using Different Approaches
El Mehdi Nchiti
1a
, Abdellah El Hammoumi
1
, Aomar Iben Brahim
2
, Kamal Gueraoui
1
1
Faculty of Sciences, Mohammed V University in Rabat, Morocco
2
Geophysics & Natural Risks Laboratory, Scientific Institute, Mohammed V University in Rabat, Morocco
Keywords: Seismic vulnerability, fragility curves, Taroudant, deterministic approach, overall approach, GIS, Pushover
analysis.
Abstract: Due to its location at the extreme north-west of Africa, a zone of collision between the African and Eurasian
plates, Morocco is a country exposed to seismic risk. In the context of the Morocco National Integrated Risk
Management Strategy, with the objective of strengthening the resilience to hazards of the national territory,
this article presents a study in which we evaluate the seismic vulnerability of buildings in the Taroudant urban
area. This city falls within the seismic zone 2 with a peak ground acceleration of 14%g, which is the second
important seismic zone in Morocco. Taroudant building are clustered according to the European Macro-
seismic scale. We then analyze one category building using two seismic vulnerability assessment methods; a
deterministic and overall approach. The results are quite similar for damage probabilities obtained by the
deterministic approach and those evaluated by the overall approach for a seismic intensity scenario between
VIII and IX. Using these results along with a Geographic Information System, maps of the spatial distribution
of seismic building categories and vulnerabilities are produced. These maps provide a scientific and technical
support to the authorities for the assessment of potential risk points within Taroudant city.
1 INTRODUCTION
Morocco has experienced several destructive
earthquakes, particularly in many of its larger cities.
During the 20th century, the recorded seismicity was
relatively moderate (Iben brahim et al., 2003) . The
1960 Agadir earthquake, with a magnitude of 5.7 on
the Richter scale, was the most violent and deadly
event, with more than 12,000 victims and more than
two thirds of the city's buildings and infrastructures
disappeared. More recently, the 6.3 magnitude Al
Hoceima earthquake of 2004, resulted in a death toll
of 629 people (Mouraouah et al., 2004; Talhaoui et
al., 2005). The Al Hoceima earthquake of 24
February 2004 has further shown deficiencies related
to the socio-economic and environmental
vulnerability of basic infrastructures. It also showed
institutional, technical and organizational gaps in
managing natural disasters of this scale.
The issue is then to suggest simple models to help
address the problem of studying seismic
vulnerability, and to present a tool to help decision-
a
https://orcid.org/0000-0002-5375-6667
making in planning and seismic risk management.
Thus, for the Taroudant urban area, this paper focuses
mainly on assessing the seismic vulnerability of its
buildings.
There are several methods for the assessment of
seismic vulnerability. The selected method is made
according to the quality and quantity of available data
and the desired accuracy, i.e. whether we seek the
estimation of the seismic vulnerability of a single
building or a group of buildings. We can thus, cite the
ATC methods (Rojahn et al., 1988) then taken up by
FEMA ((US), 2017) in the United States, the GNDT
method (Petrini, 1993) in Italy and the European
project RISK-EU (Milutinovic & Trendafiloski,
2003). In this work, the vulnerabilities are assessed
based on the direct methodology described by the
RISK-EU project, namely the overall approach level
1 based on the vulnerability index, where a system of
building classifications are proposed to group them
under a similar vulnerability index VI. In addition, we
also use a level 2 approach based on the Pushover
analysis, which is the basis of the deterministic
method for the elaboration of fragility curves.
(Combescure et al., 2005; E, 2020; Hammoumi et al.,
2009; M. A. El Azreq, Moudrik, A. El Hammoumi,
A. Iben Brahim, K. Gueraoui, A. El Mouraouah, A.
Lbadaoui, M. Kerroum, M. Kasmi, 2012).
This article is structured as follows; the following
section provides an overview of the urban area of
Taroudant by introducing a description of its building
typology and construction methods. The spatial
distribution of these typologies is further mapped
using GIS (Geographic Information System) and is
discussed. Then, a type C building is analyzed using
the two above-mentioned methods of seismic
vulnerability. Finally, this paper presents probable
damage scenarios for our study area with a
comparison between the two assessment methods
adopted in this work.
2 DESCRIPTION OF THE STUDY
AREA, DATA AND RESOURCES
2.1 Study Area
Taroudant is a city located in the south-west
Morocco, this study concerns the overall urban area
of Taroudant, which covers an area of 13.3 Km². In
terms of seismicity, Taroudant occurs in seismic zone
two with a peak velocity PVA = 0.10 m/s and a peak
ground acceleration PGA=0.14g according to the
Moroccan Seismic Code (RPS2000, 2011). This zone
is the second most important seismic zone in
Morocco.
2.2 Building Typology and
Construction Procedures
For seismic vulnerability assessment, buildings in the
Taroudant urban area are grouped into five standard
typologies. These are selected such that each
building-type reflects a distinct vulnerability class
with respect to seismic hazard. The selection of the
classes is based on the EMS 98 scale (Grünthal, 1998)
and is completed by taking into account the state of
dilapidation, the materials and quality of
construction, the irregularity shape of the building,
the seismic design level etc. These criteria are also
used to assign to each class a basic vulnerability
index.
2.2.1 Types and Age of Housing
Data from the General Census of Population and
Housing of Morocco (RGPH 2014, 2014), shows that
the most common type of housing is the Moroccan
house 80.5%, apartments account for only 13.4%, the
proportion of villas is 2.3% while the parts of rural
and basic type housing only exceed 1.6% and 0.9%
respectively. Similarly, an analysis of data on the age
of housing shows that about half of urban houses were
less than 50 years old, compared with 22.8% of
houses between 10 and 19 years of age, 15.8% less
than 10 years old, and 13.8% are 50 years-old and
over.
In fact, the performances of the buildings appear
opposite. On one hand, older buildings perform
poorly, due to the lack of a building code and its
application, as well as the degradation of materials
and the need to repair them. On the other hand,
younger buildings are constructed or rehabilitated
with an acceptable level of seismic design, which
means that they are rather earthquake-resistant
buildings.
2.2.2 Definition of Typologies and the
Associated Vulnerability Class
The data we collected and analyzed from various
government sources does not contain detailed
information on building methods in the Taroudant
urban area. Thus, in order to collect information on
the different local construction methods and to rank
the housing stock in our study area, we conducted an
on-site data collection in February 2020. During this
visit, more than a hundred photos were taken and
georeferenced using GPS positions and the GIS
geographic information system. The results of the
survey helped identify five categories of buildings
based on different building materials and types of
structures “Table 1”.
This data set made it possible to define different
vulnerability classes based on the European macro-
seismic scale (EMS 98) and to map them. The
following pictures show examples of buildings that
can be considered as representative of the building
stock in our study area “Table 1” (Grünthal, 1998;
Ningthoujam & Nanda, 2018; RGPH 2014, 2014).
A GIS database of geographical maps defining the
different types of building structures and
vulnerability classes in our study area has been
elaborated “Figure 1” (Grünthal, 1998; Ningthoujam
& Nanda, 2018; RGPH 2014, 2014).
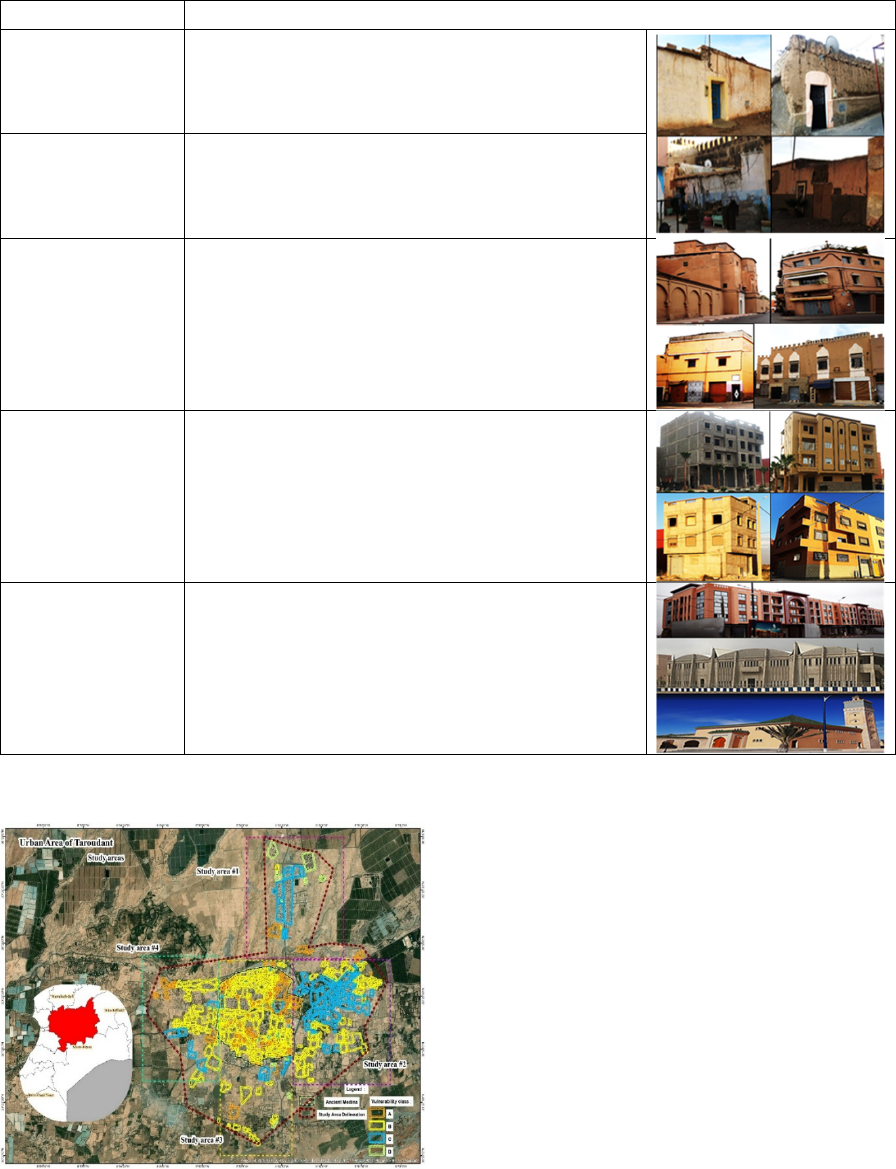
Table 1: Illustration of the selected building classification.
Vulnerability class Description
A (Type_1):
Unreinforced
constructions
- Constructed using a basic construction method with walls
consisting of small elements of adobe or mud bricks, arranged
irregularly.
- Floors are generally made of mixed materials (wood, earth,
zinc...).
A (Type_2):
Unreinforced masonry
constructions as a
whole
- made of masonry in rough rubble, dressed stone or mud
bricks and arranged regularly.
- Traditional floors generally built in wood on top of thick
walls and sometimes built out of an improved concrete slab.
- Non-homo
g
eneous an
d
condensed s
p
atial as
p
ect.
B (Type_3):
Reinforced masonry
constructions as a
whole
- Constructed mostly out of brick masonry walls and
reinforced concrete floors,
- Constructed without taking into account seismic rules of the
Morocco seismic code (RPS 2000),
- Are of one, two, three or four storeys types and generally
regular in plane and elevation. These buildings are in direct
contact against each other.
- Geometrically rectangular or square spatial appearance.
C (Type_4):
Buildings with
columns / beams and
unreinforced hollow
brick infill walls
- Constructed mostly out of brick masonry walls and
reinforced concrete floors.
- Constructed with an acceptable level of seismic design
according to the RPS 2000 code, even though the rules of
construction in seismic zones are not perfectly respected,
- Are of type three or four storeys and generally regular in
plane and elevation.
- Homogeneous Spatial aspect.
D (Type_5):
Reinforced concrete
buildings: concrete
gantries and walls
- Constructed mostly with brick masonry walls and reinforced
concrete floors,
- Constructed with a medium level of seismic design
according to the RPS 2000 code,
- Spatial aspect geometrically rectangular or square and easy
to identify.
Figure 1: Geographical distribution of building-classes in
the Taroudant urban area.
3 METHODOLOGY SEISMIC
VULNERABILITY
ASSESSMENT AND DAMAGE
ESTIMATION
The procedures used to assess vulnerability or
construct vulnerability curves depend on the nature,
quantity of data collected, and the anticipated
purpose, i.e. whether we are concerned with an
estimate of seismic vulnerability for a single structure
or a group of buildings. In the following, a distinction
should be made between deterministic methods based
on numerical simulations for a structure defined by a
specific model, and probabilistic or statistical
methods developed based on statistical data that
group several typologies of structures with similar
structural properties, which may undergo similar
damages under a given seismic loading. For this
purpose, this work uses these two approaches as
techniques for estimating the vulnerability of a type
C structure as well as on a large scale (Combescure et
al., 2005; Dang, 2014; Hammoumi et al., 2009).
3.1 Seismic Vulnerability by a
Deterministic Approach
This approach, defined as the set of methods used to
accurately estimate damages caused by a seismic
event, is based on two models. A seismic
demand/capacity model obtained by dynamic
modelling of structures subjected to seismic loading,
and a model for calculating the probability of
damages using fragility curves in the form of a
probability distribution function of the log-normal
distribution (Bendada et al., 2017; Nchiti, El
Hammoumi, Gueraoui, Ibenbrahim, et al., 2020).
In the following, we will discuss in more detail a
procedure proposed by the European project RISK-
EU; namely the LM2 Method (Benjabrou et al., 2017;
E, 2020; El Azreq et al., 2010, 2011).
3.1.1 Case Study
We thus, apply the LM2 method for the analysis of a
type C building, which represents the Moroccan
house and apartments which are more common in the
Taroudant area. In addition, the mode of construction
of these types of buildings is currently the most
adopted one in our study area. The building we
consider is a four floors frame structure with columns,
beams and infill walls made out of unreinforced
hollow bricks as shown in “Figure 2”.
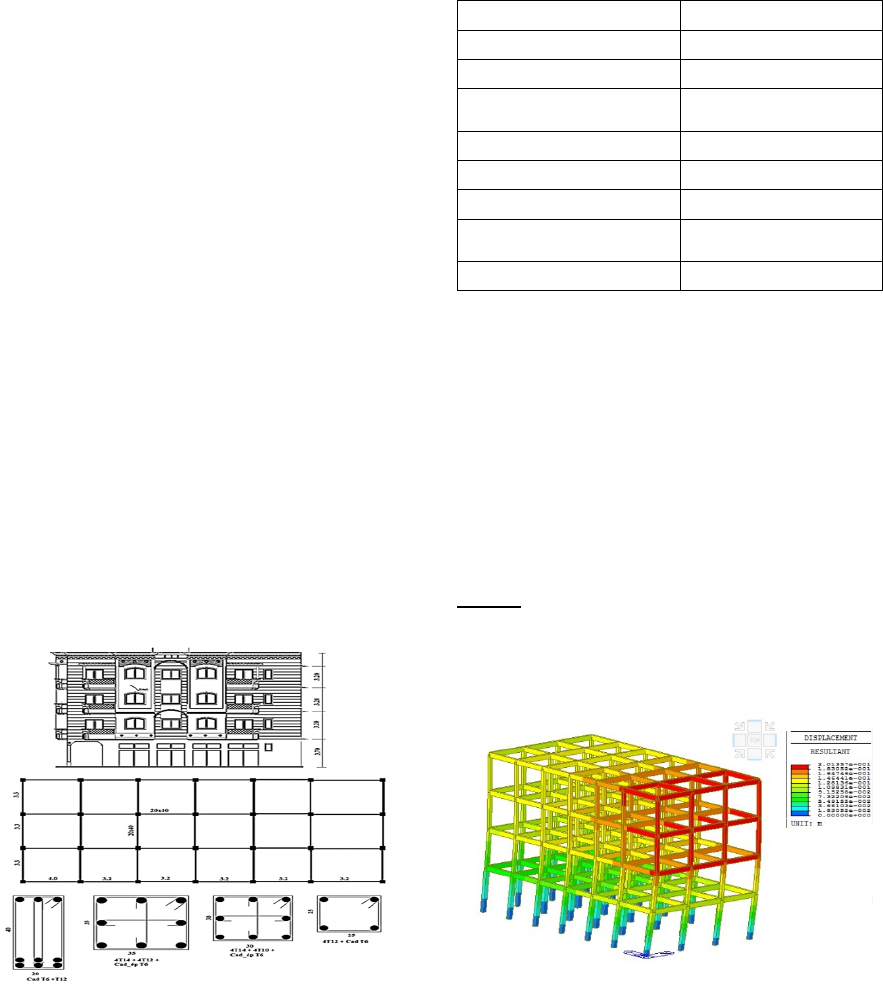
Figure 2: Plan, elevation views and details of the selected
Type C building.
The dimensions of the structural design are 9.90×20
m
2
and this structure is modelled using the
MIDASGEN finite element design software, while
the seismic lateral loading was appraised based on the
RPS2000 “Table 2”.
Table 2: Seismic parameters of the selected building
according to the seismic code RPS2000 version 2011.
Seismic parameters Style name:
Structural systems Frames
Structure classification III
Fundamental period of
vibration
T=0.075xH
3/4
=0.52s
Amplification spectrum Za/Zv ˃ 1
Ductility class ND1
Behavior factor 2
Seismic zoning
PVA = 0.10m/s
PGA=0.14
g
Site Influence S1
3.1.2 Pushover Analysis
Pushover analysis is a non-linear static analysis of a
structural element or structure under monotonous
loading to describe the relationship between shear
force and roof displacement (Ghobadi & Yavari,
2020; Mosleh et al., 2016). The method investigated
in part of this work is the spectrum response-capacity
method of Chopra & Goel (1999) (Chopra & Goel,
1999). According to Freeman's studies this method
consists of the following steps (S A Freeman, 1975;
Sigmund A Freeman, 1978) :
Step 1: Synthesis of a curve of shear force vs.
displacement at the root, under monotonic lateral
loading, is obtained by means of a finite element
modeling of the structure, called the Push-over curve
(V-∆R) “Figure 3”.
Figure 3: Numerical simulation and the resulting
displacement of the selected building computed using the
pushover analysis.
Step 2: Converting the capacity curve (V-∆R) into a
capacity spectrum (A-D), based on the following
formulations:
1
V
A
W.
(1)
2
N
ii,1
i1
1
NN
2
iii,1
i1 i1
m
mm
(2)
R
11,R
D
PF
(3)
N
ii,1
i1
1
N
2
ii,1
i1
m
PF
m
(4)
A / D: Acceleration / spectral displacement;
W: Total mass of the structure;
m
i
: The per-story mass concentrated at the ith floor
level;
ϕ
i,1
: Amplitudes of the first eigen-mode on the ith
floor;
α
1
: Coefficient of the modal mass of the first Eigen-
mode ;
ϕ
R,1
: Amplitude of the first Eigen-mode at the roof
level (Nth floor);
PF1: Modal participation factor corresponding to the
first vibration mode;
Step 3:
Transformation of the normalized elastic
response spectrum (A-T) to pseudo-acceleration (A-
D).
The Moroccan seismic regulation RPS2000, proposes
an elastic spectrum that represents an idealization of
the envelope for various normalized response spectra.
It defines the dynamic amplification factor (D) of the
response in function of the fundamental period of the
structure (T). Then the definition of the elastic
spectrum (A-T) is made via the dynamic
amplification factor D (T) by:
max
A(T) (A / g) / D(T)A
(5
)
Where A
max
is the peak ground acceleration and g is
the acceleration of gravity.
The inelastic response spectrum is obtained by the
introduction of the reduction factor K. The spectral
displacement is D = (T/2π
2
) A (Belmouden, 2004;
Fajfar, 2000).
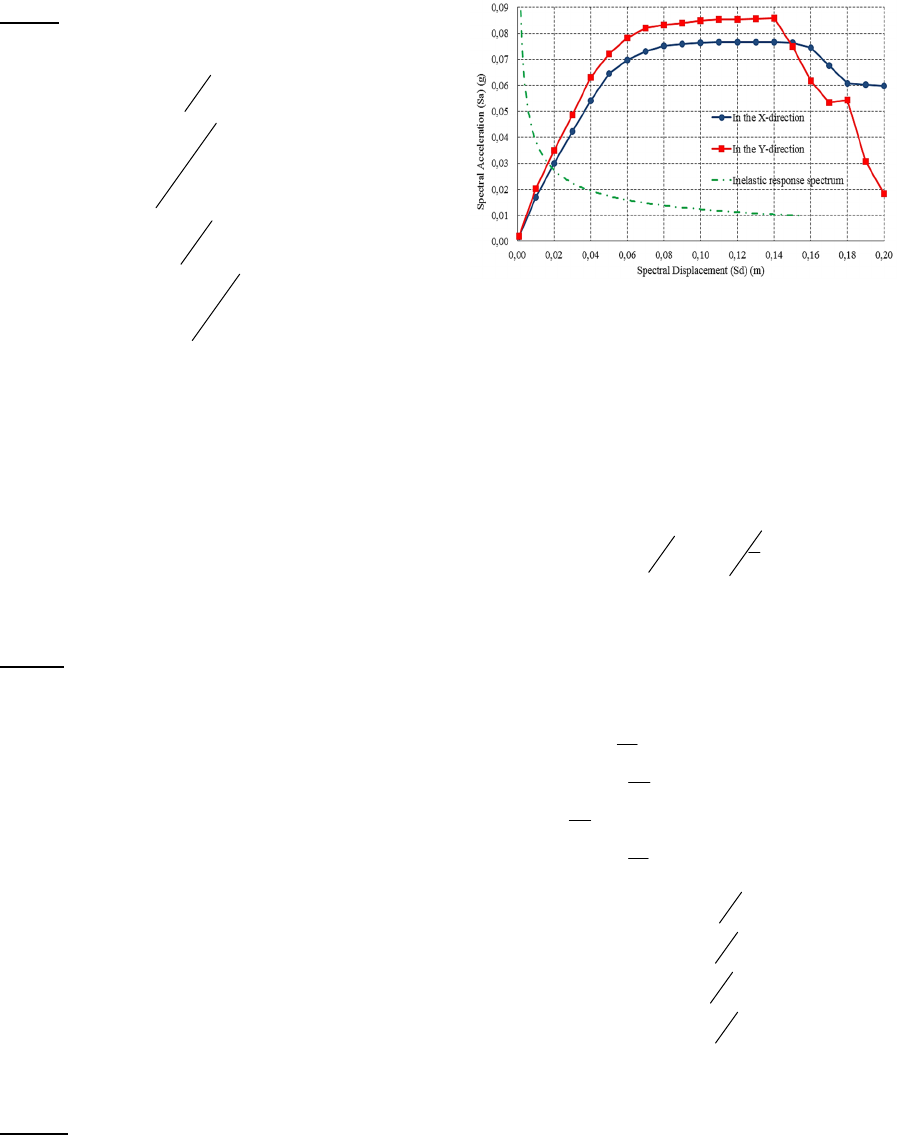
Step 4:
Combining the capacity and response
spectrum and determining the performance point,
“Figure 4” shows the combination of the capacity
spectrum with the response spectrum in order to
obtain the performance point.
Figure 4: Combination of Capacity and Response Spectra.
3.1.3 Fragility Curves
For the development of fragility curves, all previous
work uses a log-normal cumulative distribution
model as a statistical distribution model to represent
the fragility curves of a structure. (Kumar & Samanta,
2020; Maio et al., 2020; Milutinovic & Trendafiloski,
2003):
,
1
/ln
d
d
ds
dds
S
Pds S
S
(6
)
Where:
Sd is the parameter related to seismic hazard;
S
,
is the median and β
ds
is the standard deviation of
the spectral displacement for the building attaining a
certain degree of damage ds:
1
y
Sd =0.7D
(7
)
2
y
=DSd
(8
)
3
yuy
=D +0.25(D -D )Sd
(9
)
4
u
Sd =D
(10
)
Sd1
β =0.25+0.07ln( )
u
y
D
D
(11
)
u
D
Sd2
β =0.2+0.18ln( )
y
D
(12
)
u
Sd3
β =0.1+0.4ln( )
y
D
D
(13
)
u
D
Sd4
β =0.15+0.5ln( )
y
D
(14
)
Φ is the probability distribution function of the
normal distribution;
Du is the ultimate point of spectral displacement;
Dy is the elastic yield point of spectral displacement;
“Table 3” presents the definitions of these states as a
function of spectral displacements derived from
capacitance spectra.
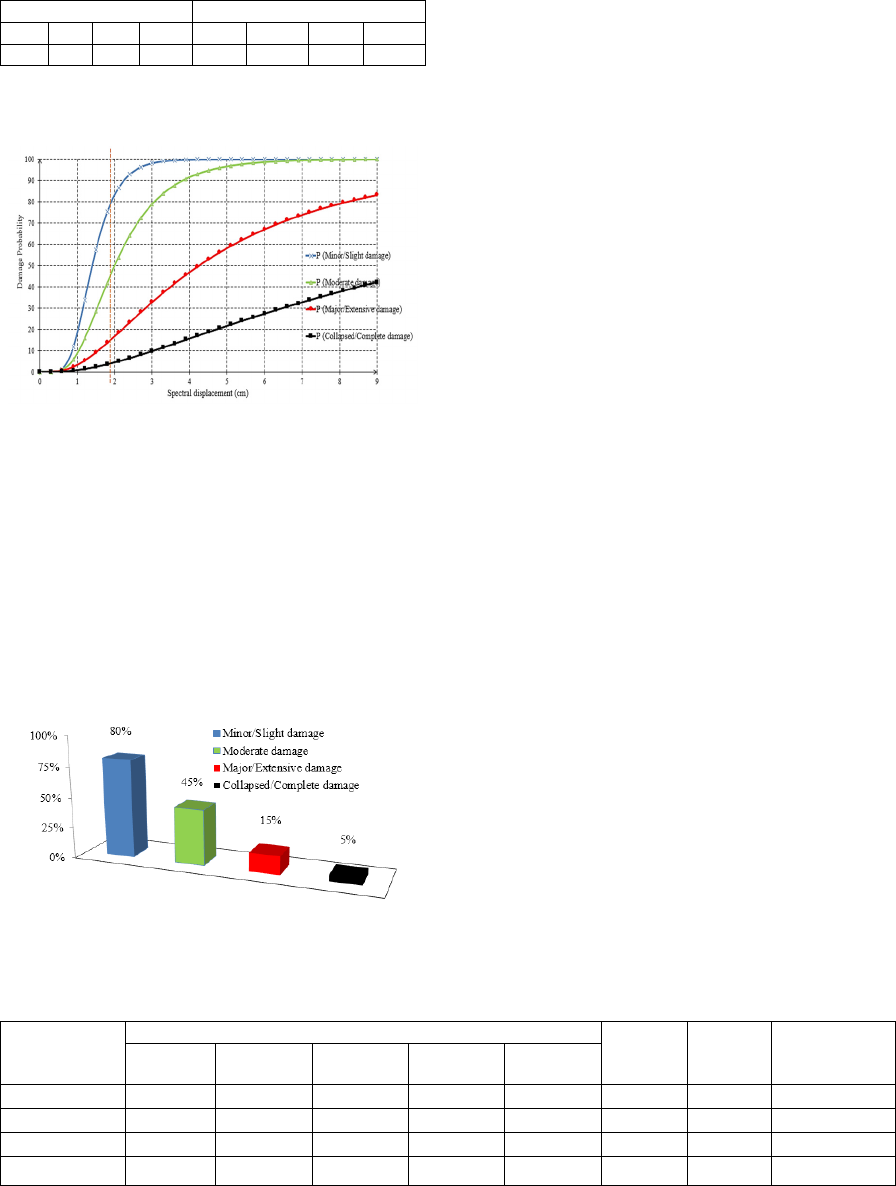
Table 3: Definition of limit states as a function of spectral
displacements (cm).
Sd,ds βds
S
d,1
1.4 S
d,3
4.25 β
Sd,1
0.369 β
Sd,3
0.782
S
d,2
2.0 S
d,4
11.0 β
Sd,2
0.507 β
Sd,4
1.002
“Figure 5” shows the fragility curves obtained from
the lognormal distribution hypothesis of the C-type
structure presented in “Figure 2”.
Figure 5: Derived fragility curves for our Type C building.
In addition, it is possible to identify the levels of
damage on the analyzed structure by means of
fragility curves and the value of the maximum
spectral displacement that can be obtained from the
point of performance, which is determined by the
intersection of the capacity curve with the inelastic
response spectrum. As shown in “Figure 4”, by
intersection with the fragility curves, the spectral
displacement occurs at 1.9 cm in “Figure 5”. The
statistical distribution of the obtained damage is given
in the histogram of “Figure 6”.
Figure 6: Summary of the fragility probabilities for the
selected building.
3.2 Seismic Vulnerability by the
Overall Approach
The overall approach is used for large-scale
vulnerability analyses using a collection of
geographical data to define a differentiation of
structures into vulnerability classes according to the
European macro-seismic scale (EMS 98) (Grünthal,
1998) as shown in “Table 1”.
3.2.1 Vulnerability Index Method
The RISK-EU project suggests a semi-empirical
method (LM1 Method) by which semi-empirical
mean vulnerability functions are defined that relate
the mean degree of damage μ
D
to the macroseismic
intensity I and vulnerability index V
I
. This method
proposes a system of building classifications to group
them into similar vulnerability index V
I
values
ranging from 0 (less vulnerable building) to 1 (more
vulnerable building) (Nchiti, El Hammoumi,
Gueraoui, & Iben Brahim, 2020). For each type of
building, RISK-EU gives the most probable V
I
*
value, [V
I
-
; V
I
+
] the possible range and [V
I
min
; V
I
max
]
maximum and minimum limits of the vulnerability
index value V
I
. For each seismic class, these values
are evaluated according to the percentage of different
types of buildings identified in the chosen class
“Table 4”. The basic vulnerability index V
I
*
associated with the typology will then be amplified in
accordance with the constructive parameters specific
to each structure (Rezaei Ranjbar & Naderpour,
2020).
3.2.2 Fragility Curves
In order to obtain the damage probability of our
seismic class C building , it is necessary to define,
first of all, the mean degree of damage for different
intensities as follows (Nchiti, El Hammoumi,
Gueraoui, & Iben Brahim, 2020; Rezaei Ranjbar &
Naderpour, 2020) :
Table 4: Vulnerability index for different classes of buildings in our study area.
Vulnerability
class
V
c
V
I
re
p
resentative values
∆V
m
∆V
f
Vulnerability
index
V
I
V
I
min
V
I
-
V
I
*
V
I
+
V
I
max
A 0.50 0.659 0.767 0.895 0.980 0.02 0.04 0.827
B 0.3 0.49 0.627 0.817 0.883 0.02 0.04 0.688
C -0.02 0.007 0.402 0.76 0.98 0.1 0.04 0.542
D -0.02 0.047 0.386 0.67 0.86 0.05 0.04 0.476
I
D
I 6.25V 13.1
2.5 1 tanh
2.3
(15)
Subsequently, it is possible to calculate the damage
distribution for each seismic class, using probability
density and cumulative distribution equations:
tq1
qt
t1
(x a) b x
(t)
p(x)
(q) (t q)
(b a)
(16)
b
a
Pp(z)dz
(17)
Where a=0, b=6, t and
32
DD D
q t(0.007 0.052 0.2875 )are the
distribution factors, and x is the continuous variable
in the interval [a,b]. The discrete beta density
probability function is calculated from the
probabilities associated with damage states k and k+1
(k = 0, 1, 2, 3, 4, 5), as follows:
k
pP(k1)P(k)
(18)
k
P(D D ) 1 P (k)
(19)
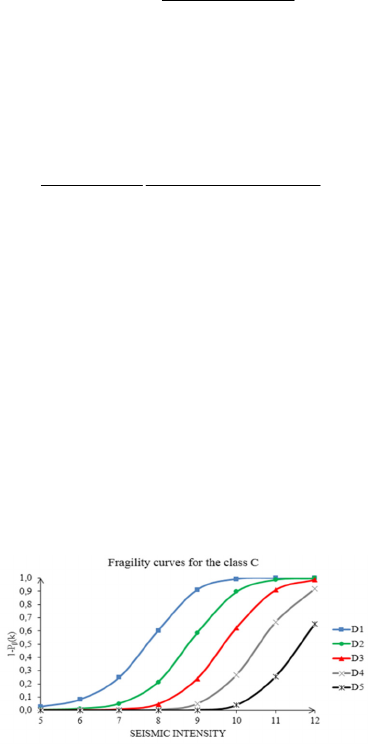
Figure 1: Summary of the fragility probabilities for the
selected building.
Based on the fragility curves shown in “Figure 7”, it
is possible to deduce the state of damage for a given
seismic intensity. For a scenario of seismic intensity
between VIII and IX, class C buildings will suffer
78% of negligible to slight damage, 40% of moderate
damage, 12% of significant to important damage, 2%
of very important damage. These results show a good
agreement with those evaluated by the deterministic
approach “Figure 6” for a type C building within the
urban area of Taroudant under a seismic intensity
VIII.
4 CONCLUSIONS
In this paper, two models for assessing the seismic
vulnerability of buildings are developed for typical
structures in the urban area of Taroudant, in particular
for type C buildings which are more abundant in this
city. The first model is based on a seismic
vulnerability index system for buildings. Then, a
reference model is developed according to a more
precise method, the non-linear static analysis, for
comparison of the damage assessed by the two
methods. Maps of the spatial distribution of seismic
building categories are developed.
For type C buildings and for a seismic intensity
scenario between VIII to IX, the results turn-out to be
quite similar between the damage probabilities
obtained by the deterministic approach and those
evaluated by the overall approach.
Based on these results and the maps of the spatial
distribution of seismic building categories, this study
provides a valuable technical support to the
authorities for the identification and assessment of
potential risk sites.
Future research on the development of seismic
vulnerability assessment models for buildings can
take this work as a standard and unified procedure for
studying vulnerable areas on a national scale.
REFERENCES
(US), F. E. M. A. (2017). Rapid visual screening of
buildings for potential seismic hazards: A handbook.
Government Printing Office.
Belmouden, Y. (2004). Analyse spectrale non itérative des
oscillateurs simples sous l ’ action des tremblements de
terre. 1–10.
Bendada, A., El Hammoumi, A., Gueraoui, K., Sammouda,
M., & Ibenbrahim, A. (2017). Vulnerability analysis of
a school building under tsunami loading in the gulf of
Cadiz. International Review of Civil Engineering, 8(1),
11–18. https://doi.org/10.15866/irece.v8i1.10912
Benjabrou, M., Zeggwagh, G., Gueraoui, K., Sammouda,
M., & Driouich, M. (2017). Evaluation of Seismic
Vulnerability of Existing Reinforced Concrete
Structure by Non-Iterative Spectral Method Using
Pushover Analysis with Interpretation of Fragility
Curves by RISK UE,(2017). International Review of
Civil Engineering (IRECE), 8(4), 177–186.
Chopra, A., & Goel, R. (1999). Capacity-Demand-Diagram
Methods for Estimating Seismic Deformation of
Inelastic Structures: SDF Systems. Pacific Earthquake
Engineering Research Center, April.
Combescure, D., Guéguen, P., & Lebrun, B. (2005).
Vulnérabilité sismique du bâti existant: approche
d’ensemble.
Dang, C.-T. (2014). Méthodes de construction des courbes
de fragilité sismique par simulations numériques.
E, N. (2020). Assessment of Tsunami and Seismic
Vulnerability of Buildings in the Agadir Bay Area,
Morocco. Journal of Advanced Research in Dynamical
and Control Systems, 12(SP4), 1727–1737.
https://doi.org/10.5373/JARDCS/V12SP4/20201655
El Azreq, M. A., El Hammoumi, A., Brahim, A. I.,
Gueraoui, K., El Mouraouah, A., Lbadaoui, A.,
Kerroum, M., Kasmi, M., Birouk, A., & El Harrouni,
K. (2011). Seismic Vulnerability of Traditional Earthen
Buildings.
El Azreq, M. A., El Hammoumi, A., Iben Brahim, A., El
Mouraouah, A., Kerroum, M., Gueraoui, M., Kasmi,
M., & Birouk, A. (2010). Spectrum response of earthen
buildings. International Review of Civil Engineering,
1(4), 266–274.
Fajfar, P. (2000). A nonlinear analysis method for
performance-based seismic design. Earthquake
Spectra, 16(3), 573–592.
Freeman, S A. (1975). Evaluations of existing buildings for
seismic risk-A case study of Puget Sound Naval
Shipyard. Proc. 1st US Nat. Conf. on Earthquake
Engrg., Bremerton, Washington, 1975, 113–122.
Freeman, Sigmund A. (1978). Prediction of response of
concrete buildings to severe earthquake motion. Special
Publication, 55, 589–606.
Ghobadi, M. S., & Yavari, H. (2020). Progressive collapse
vulnerability assessment of irregular voided buildings
located in Seismic-Prone areas. Structures, 25, 785–
797.
Grünthal, G. (1998). European macroseismic scale 1998.
European Seismological Commission (ESC).
Hammoumi, A. E. L., Brahim, A. I., Birouk, A., Toto, E.
A., Mouraouah, M. K., Gueraoui, K., & Kasmi, M.
(2009). Assessment of Seismic Vulnerability of Urban
Buildings in Morocco. Assessment.
Iben brahim, A., Mouraouah, A. El, Kasmi, M., & Birouk,
A. (2003). A preliminary Instrumental Seismicity
Catalog for the Western Mediterranean Region,
Proceedings of the Workshop on "la Sismicité et la
Gestion du Risque Sismique dans la Région Euro-
Méditerranéenne. Le Centre Euroméditerranéen de
Prévention Du Risque Sismique (CEPRIS), 49–55.
Kumar, P., & Samanta, A. (2020). Seismic fragility
assessment of existing reinforced concrete buildings in
Patna, India. Structures, 27, 54–69.
M. A. El Azreq, Moudrik, A. El Hammoumi, A. Iben
Brahim, K. Gueraoui, A. El Mouraouah, A. Lbadaoui,
M. Kerroum, M. Kasmi, K. E. H. (2012). Seismic
Vulnerability of Traditional Buildings in the Medina of
Fez. International Review of Civil Engineering, Vol.
3(n. 2), 206–217.
Maio, R., Estêvão, J. M. C., Ferreira, T. M., & Vicente, R.
(2020). Casting a new light on the seismic risk
assessment of stone masonry buildings located within
historic centres. Structures, 25, 578–592.
Milutinovic, Z. V, & Trendafiloski, G. S. (2003). Risk-UE
An advanced approach to earthquake risk scenarios
with applications to different european towns.
Contract: EVK4-CT-2000-00014, WP4: Vulnerability
of Current Buildings.
Mosleh, A., Rodrigues, H., Varum, H., Costa, A., & Arêde,
A. (2016). Seismic behavior of RC building structures
designed according to current codes. Structures, 7, 1–
13.
Mouraouah, A. El, Iben brahim, A., Kasmi, M., Birouk, A.,
El Mrabet, T., & zouine. (2004). Le séisme d’Al
Hoceima du 24 Février 2004 : Surveillance sismique et
analyse préliminaire : situation au 31 mai 2004 : Edition
Du CNRST-CEPRIS, 162.
Nchiti, E., El Hammoumi, A., Gueraoui, K., & Iben
Brahim, A. (2020). A Comparative Study of Seismic
and Tsunami Vulnerability of Structures Located in the
Coastal Area of Rabat-Salé, Morocco. International
Review of Mechanical Engineering (IREME); Vol 14,
No 4 (2020).
https://doi.org/https://doi.org/10.15866/ireme.v14i4.18
159
Nchiti, E., El Hammoumi, A., Gueraoui, K., Ibenbrahim,
A., & Bendada, A. (2020). Simulated Tsunami and
Earthquake Impact on RC Structures: a Comparative
Study. International Review of Civil Engineering
(IRECE); Vol 11, No 5 (2020).
https://doi.org/10.15866/irece.v11i5.18106
Ningthoujam, M. C., & Nanda, R. P. (2018). A GIS system
integrated with earthquake vulnerability assessment of
RC building. Structures, 15, 329–340.
Petrini, V. (1993). Rischio sismico di edifici pubblici, parte
I, Aspetti metodologici. Pubblicazione Del GNDT-
CNR, Roma, Italia, 0, 2.
Rezaei Ranjbar, P., & Naderpour, H. (2020). Probabilistic
evaluation of seismic resilience for typical vital
buildings in terms of vulnerability curves. Structures,
23, 314–323.
https://doi.org/10.1016/j.istruc.2019.10.017
RGPH 2014. (2014). General Census of Population and
Housing. http://rgphentableaux.hcp.ma/
Rojahn, C., Poland, C. D., & Scawthorn, C. (1988). Rapid
Visual Screening of Buildings for Potential Seismic
Hazards: A Handbook (Vol. 21). Applied Technology
Council.
RPS2000, S. code. (2011). RPS 2000—version 2011.
Ministère de l’Habitat et de La Politique de La Ville.
Rabat, Morocco.
Talhaoui, A., Aberkan, M., Brahim, I., & El Mouraouah, A.
(2005). Risques géologiques et activité sismique dans
la région d’{Al} {Hoceima} ({Maroc}): {Approche} de
la quantification des facteurs responsables du
déclenchement des instabilités de terrain {Geological}
hazards and seismic activity within the area of {Al} {H.
