
Predicting Covid-19 Cases using CNN Model
Paul Menounga Mbilong
1a
, Asmae El Kassiri
1
, Fatima-Zahra Belouadha
1
and El Bhiri Brahim
2
1
AMIPS Research Team, Ecole Mohammadia d’Ingénieurs, Mohammed V University in Rabat
2
SMARTLIB, Ecole Marocaine des Sciences de l'Ingénieur Rabat, Morocco
Keywords: The COVID-19, CNN, LSTM, Deep Learning, Time-series forecasting.
Abstract: The prediction of COVD-19 confirmed cases is a complex time-series problem. In the literature, Long Short
Time Memory (LSTM) has proven its efficiency to resolve issues related to the time series problems. However,
Convolution neural network (CNN) did not been widely used in this aim and is considered as more suitable
for imaging processing. Therefore, in this paper, we use it to predict COVID-19 cases and compared it with
LSTM in the context of Morocco during the period of confinement. The obtained results which we present
and discuss in this article are very promising.
1 INTRODUCTION
Reported first in December 2019, in Wuhan, China,
Coronavirus 2019 (COVID-19), caused by the strain
of coronavirus named “Severe Acute Respiratory
Syndrome Coronavirus 2 (SARS-CoV-2)”, has
become now, according to the World Health
Organization WHO, an international epidemic having
caused 17 660 523 infected cases, and 680 894 deaths
on August 03, 2020 (Organization, 2020).
Since the first cases were reported, multiple
academic and medical works have explored various
approaches to find a solution for the COVID-19
epidemic in different search areas including the
Machine Learning (ML). Some ML, and especially
Deep Learning (DL), work interested in COVID-19
are oriented to help medical staff to efficiently
diagnostic infected people (Singh, Kumar, Vaishali,
& Kaur, Coronavirus (COVID-19) Classification
using CT Images by Machine Learning Methods,
2020) (Wang, et al., 2020) (Gozes, et al., 2020)
(Metsky, Freije, Kosoko-Thoroddsen, & Myhrvold,
2020), and others are directed to analyze the
pandemic situation like predicting new patients to
contribute to local hospital arrangement (Alimadadi,
et al., 2020) (Bouhamed, 2020) (Chimmula & Zhang,
2020) (Pinter, Felde, MOSAVI, Ghamisi, &
Gloaguen, 2020).
In general, a lot of work applied ML and DL to
predict COVID-19 new cases use time-series
a
https://orcid.org/0000-0001-5464-4803
forecasting models (Chimmula & Zhang, 2020)
(Zeroual, Harrou, Dairid, & Sun, 2020) (Azarafza,
Azarafza, & Tanha, 2020) (Punn, Sonbhadra, &
Agarwal, 2020). Actually, Recurrent Neural
Networks (RNN) architecture are adopted by several
searchers thanks to their capacity in handling time-
dependent datasets, and hence they were widely used
in the context of predicting COVID-19 new cases.
Moreover, other Neural Networks (NN) architectures
were used for this objective.
The objective of this work is to use Convolution
Neural Network (CNN) architecture in time-series
forecasting to predict the COVID-19 new cases in
Morocco. We compare our results with a Long Short-
Term Memory (LSTM) neural network explored in
the same context by another work conducted by our
research team.
This paper is constituted of five sections. The
second one explores the related work, which is
relative to CNN architectures and their use in Time-
series forecasting, especially in the context of
COVID-19. The third section is about Materials and
Method used to perform our experimental studies. We
present and discuss the results in the fourth section,
and finally we conclude in the fifth section.
2 RELATED WORK
Most often, a time-series is a succession of points
equidistant in time. It can be thought of as sequence
of vectors s(t), with t between 0 to n, where t denotes
the spent time, x is a value varying with t, and n is the
max value of t. The problem of forecasting future
values of s from values of s up to the current time can
be stated as finding a function f : ℝ
→ ℝ such as to
estimate s at time t + d, from the N time steps back
from time t (Frank, Davey, & Hunt, 2001):
s (t + d) = f(s(t), s (t − 1), . . ., s (t − N + 1)) (1)
In the literature, RNN architectures were
considered the most suitable for solving problems that
involve sequential data (Ganatra & Patel, 2018).
LSTM is a special type of recurrent neural
network with long and short term memory cells
(Kamal, Bae, Sunghyun, & Yun, 2020). It was proven
that it has good accuracy in the context of COVID-19
prediction. In (Azarafza, Azarafza, & Tanha, 2020),
LSTM was more efficient than RNN in predicting
infections in Iran, while LSTM learning has given
good RMSE and suggested that the epidemic's
expected outcome will be reached in the period of
June 2020 in (Chimmula & Zhang, 2020) but the
actual situation proves that it was not true. We think
it is because of the small size of the analyzed data set
(confirmed cases until March 31, 2020).
Nevertheless, comparing LSTM, RNN, GRU, and
Variational AutoEncoder VAE have proven the
efficiency of VAE (Zeroual, Harrou, Dairid, & Sun,
2020).
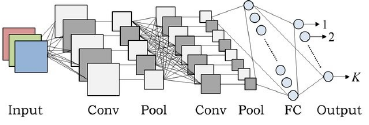
The CNN architectures as shown in Figure 1, in
the other side, were basically designed to extract local
relationships that are invariant across spatial
dimensions. Commonly they have three types of
layers; including fully-connected layer, pooling layer,
convolutional and non-linearity layers (Abiodunab, et
al., 2018).
Figure 1: An example of CNN architecture (Hidaka &
Kurita, 2017).
To adapt CNNs to time-series datasets,
researchers use multiple layers of causal convolutions
(Oord, et al., 2016) (Bai, Kolter, & Koltun, 2018).
For an intermediate feature at hidden layer l, each
causal convolutional filter takes the form below (Lim
& Zohren, 20):
ℎ
𝐴
𝑊 ∗ ℎ𝑙,𝑡
(2)
𝑊∗ℎ
𝑙,𝑡
𝑤𝑙,𝜏ℎ
(3)
where ℎ
∈ ℝ
H
in
is an intermediate state at
layer l at time t, ∗ is the convolution operator, W(l, τ
) ∈ ℝ
is a fixed filter weight at layer l, and
A(.) is an activation function representing any
architecture-specific non- processing. In practice, the
one-dimensional 1-D CNN architecture is used to
classify and predict future time-series values.
In the context of COVID-19 analysis, the CNN
architectures were widely used to detect it from X-ray
or Computed Tomography CT images. On the X-ray
images side, authors in (Apostolopoulos & Mpesiana,
2020) utilized a dataset of X-beam pictures from
patients with regular bacterial pneumonia, affirmed
Covid-19 sickness, and ordinary occurrences to
distinguish the COVID-19 infection. Similarly, in
(Ozturk, et al., 2020), the authors use a dataset of raw
chest X-ray images with the DarkNet model (based
on CNN architecture) to give exact diagnostics,
classify people with the COVID for those who don't
have the COVID-19 and for multi-class classification
between COVID contaminated people, healthy
individuals and persons with pneumonia. Authors in
(Minaee, Kafieh, Sonka, Yazdani, & Soufie, 2020)
used a transfer learning on a subset of 2000 x-ray
images to learn four successful CNNs models ,
comprising ResNet18, ResNet50, SqueezeNet, and
DenseNet-121, to recognize COVID-19 illness in a
chest image dataset collected from the publicly
available datasets, and images exhibiting COVID-19
disease presence were identified by board-certified
radiologist. While authors in (Islam & Asraf, 2020)
use a dataset of 4575 X-ray images, including 1525
images of COVID-19, the CNN to extract for deep
feature and LSTM to detect COVID-19 using the
extracted feature. On the other side, authors (Singh,
Kumar, Vaishali, & Kaur, Classification of COVID-
19 patients from chest CT images using multi-
objective differential evolution–based convolutional
neural networks, 2020) use a dataset of chest CT
images and a CNN model to assign COVID-19
infected patients as infected and uninfected in another
case. They calibrated the settings of CNN based on
the multi-objective differential evolution. Similarly,
authors in (Wang, et al., 2020) use a dataset of 1,065
CT images of pathogen-confirmed COVID-19 cases
(325 images) along with those previously diagnosed
with typical viral pneumonia (740 images) and a
transfer-learning model to train a CNN model
followed by an internal and an external validation.
The CNN did not have the same popularity in the
context of time-series forecasting of COVID-19
cases. Up to day, there are only four works that have
exploited the CNN architectures to predict COVID-
19, in the literature. The first one is (Amo-Boateng,
2020) where 1D-CNN is used on the chronological
data records of known COVID-19 positive cases in
order to predict the steps for reporting countries and
territories. The second one is (Barman, 2020) that
explores the performance of Auto-Regressive
Integrated Moving Average (ARIMA) model and
several LSTM models, including the CNN-LSTM, in
forecasting the number of confirmed COVID-19
cases. According to the authors, ARIMA marked
better results. The third one is (Dutta,
Bandyopadhyay, & Kim, 2020) a study that
investigates the forecast of the growth of COVID-19
at a close later time in the world through the CNN and
CNN-LSTM models. The results demonstrate that the
mixed CNN-LSTM framework is more efficient than
the rest of the models. The last one is (Huang, Chen,
Ma, & Kuo, 2020) that proposes a CNN model to
analysed and predict the number of confirmed cases
in several cities with the most confirmed cases in
China. The findings of the research stated that, in
comparison to a number of alternative deep learning
methods (Multilayer perceptron (MLP), LSTM, and
Gate Recurrent Unit (GRU)), the CNN model
proposed in this study is promising.
As seen in the previous works, to predict COVID-
19 cases, some works pretend that LSTM fits better
than CNN, while others pretend the contrary. In this
present work, we will use the CNN model in this
context and compare our results with another
submitted work investigating the efficiency of LSTM
for the same objective on the same dataset.
3 MATERIALS AND METHODS
The approach consists in three principle tasks. The
first one is a data pre-processing to prepare data to be
analysed. The second, the third and the last one,
respectively, are the model parametrization, training
and testing. Those tasks are recursive according to the
evaluation metrics until finding the best-fitted model.
The retained model is then used for the prediction.
3.1 Data Set
This For our study, we have decided to explore data
from Our World in Data that uses three statistical
resources on the COVID-19 pandemic published by
the European Center for Disease Prevention and
Control (ECDC). The dataset contains aggregated
data from countries around the world that are
available on GitHub. The variables represent data
related to confirmed cases, deaths, and testing, as well
as other variables of potential interest. The columns
are: iso code, continent, location, date, total cases,
new cases, total deaths, new deaths, total cases per
million, new cases per million, total deaths per
million, new deaths per million, total tests, new tests,
new tests smoothed, total tests per thousand, new tests
per thousand, new tests smoothed per thousand, tests
units, stringency index, population, population
density, median age, aged 65 older, aged 70 older,
gdp per capital, extreme poverty, cardiovascular
death rate, diabetes prevalence, female smokers, male
smokers, handwashing facilities, hospital beds per
thousand, life expectancy. Note that the analysed data
belong to the period from March 02, 2020 to June 15,
2020.
3.2 Pre-processing
The collected data were then processed by a Python
project using the libraries Pandas, NumPy, SciPy and
Matplotlib in a jupyter notebook.
We have first filtered data concerning Morocco,
and then selected the features 'total_cases',
'population', 'total_deaths', and 'new_deaths. We have
retained the last feature ‘new_cases’ because it is the
target of our predictions. The features concerning the
total of deaths and cases are useful for the prediction
because the contamination can arise from infected
people that are always alive.
The third task was the feature scaling to normalize
the range of independent variables or features of data
so that each feature contributes approximately and
proportionately in the ML algorithm. We have then
applied the Min-Max scaler that transforms all values
between the range 0 and 1. The fourth task of the pre-
processing process is adapting our model to learn
from the past time-steps in order to predict the positive
COVID-19 cases for the future 7 time-steps, where we
split the dataset into 80% of the training set and 20%
of the testing set. The model uses two days lags as
inputs to predict seven days as outputs.
3.3 Parameters
The choice of the activation function, the optimizer,
and the number of layers were fixed at the beginning,
while the number of filters in the CNN layers were
updated recursively according to the evaluation steps
to enhance the performance of the trained model. The
best performance was obtained by 127 filters. The
amount of days to return by the model depends on the
number of outputs in last layer, in our paper, that is
set to 7.
In this work, we have opted for the activation
function ReLu and the Adam Optimizer belonging to
the stochastic gradient descent SGD category.
In a neural network, the activation function takes
in the output signal from the previous cell and
converts it into some form that can be taken as input
to the next cell. Similarly, in an artificial neural
network (ANN), it transforms the summed weighted
input from the node into the output for that input. The
rectified linear activation function ReLU is a linear
function that outputs the input directly if it is positive,
otherwise, it will output zero. It is especially when
using CNN, a widely used activation function and
easy to compute which does not saturate, and prevents
the Vanishing Gradient Problem.
The optimizer is a basic algorithm responsible for
making neural networks converge, it controls the
weights updating of the network, to shift towards the
optimum of the cost function. On the basis of this, we
have two basic types of gradient descent algorithms.
The BGD, batch gradient descent and the SGD,
stochastic gradient descent. The main distinction
between the both is that the SGD will compute the
cost of only one example in each step, when the BGD
will determine the cost of all the training instances in
the dataset.
The SGD formula is employed to adjust the
weights in a neural network through the use
backpropagation to calculate the gradient ∇ Hansen,
2019:
𝜃
𝜃
η
.∇
𝐽𝜃;𝑥,𝑦
(4)
- θ (theta) is the variable to be modified during
the optimization of a model, it can be weights,
biases and activations. Notice that a single
weight is updated for the neural network here,
- η is the learning rate (eta),
- ∇ is the gradient (nabla),
- J has formally been known as an objective
function, but most often it is called a cost
function or loss function.
- J (θ; x, y) basically implies that we insert the θ
parameter along with a training example and
label.
Adaptive Moment Estimation (Adam) is the most
frequently used optimizer and certainly the top
performer on general average.
3.4 Evaluation Metrics
MSE (Mean Square Error). It is used as a default
metric for evaluation of the performance of most
regression algorithms (Kathuria, 2019). It computes
the average of the squared errors, defined as the mean
difference between the real values y and the estimated
y (Binieli, 2018). A large MSE means a large error.
RMSE (Root Mean Square Error) has been used
as a standard statistical metric to measure model
performance in meteorology, air quality, and climate
research studies (Chai & Draxler, 2014). It
corresponds to the square root of the mean of the
squared difference between the observed y and the
predicted values y (Bratsas, et al., 2020).
Max Error is a metric which calculates the
maximum residual error. It expresses the worst case
error between the predicted value and the true value.
Its interpretation is very simple.
R2 (R-Square) is a metric that varies between 0
and 1. It is also known as the Coefficient of
Determination. Sometimes, the closer to 1 it is, the
better the model is (Vedova, 2018).
MAE (Mean Absolute Error) is the averaged on
the test instance for absolute differences between the
forecast and the true observation where all individual
errors were given the same weight.
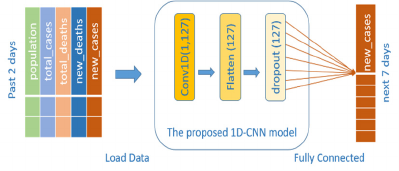
3.5 1D-CNN Architecture
The 1D-CNN structure proposed in this study is
illustrated in Figure 2 The design of the input layer
uses two-time sequences that are based on factors
influencing the number of new cases. The structure of
the convolutional layer contains a single layer with
127 filters.
Figure 2: Structure of proposed CNN model.
The convolution process can be expressed in
Equation (5). Let call f our input vector and g our
filter, and say that f has length n, and g has length m.
The convolution f ∗ g of f and g is defined as:
y
σ w
x
⋯ w
x
(5)
The idea behind the fully connected layer
architecture can be formulated by equation (5). Let x
∈ ℝ
m
represent the input to a fully connected layer.
Let y
i
∈ ℝ be the i-th output from the fully connected
layer. Then y
i
∈ ℝ is computed as follows:
𝑥
f
∗g
i
∑
g𝑖 ∗
f
i j
(6)
Here, σ is a nonlinear function (in this case is
ReLu), and the w
i
are learnable weights (thanks to the
optimizer) in the network. The result of the
convolution layer can generate a 1D vector through
flattened technique. Then the vectors are plugged into
the fully connected (dense) layer to obtain a 1D vector
output.
4 RESULTS AND DISCUSSION
In this section, we compare and discuss the results of
the proposed CNN model and the best-fitted LSTM
model developed by our research team. The two
models were trained and tested on the same dataset.
Table 1 shows the evaluations from the proposed
CNN using the MSE, RMSE, MAE, R2, and
MaxError metrics. As seen, the model converges well
to a small error of the training loss with an MSE of
267.23, an RMSE of 16.35, an MAE of 11.74, and an
R2 of 0.68. Actually, the model continues to well
converge to a small error in the test stage with an
MSE of 723.95, an RMSE of 26.91, an MAE of
20.06, and an R2 of 0.15.
Table 2 shows the experiment results of the best-
fitted model among the LSTM ones that our research
team has developed. It shows that the LSTM model
converges slightly better than the proposed CNN
model, in the test stage with an MSE of 658.65, an
RMSE of 25.66, an MAE of 19.95, and an R2 of 0.23.
Taking into consideration that the best-fitted LSTM
model implements three LSTM layers, while the
proposed CNN model implements only one CNN
layer. It must be admitted that the proposed model is
very promising.
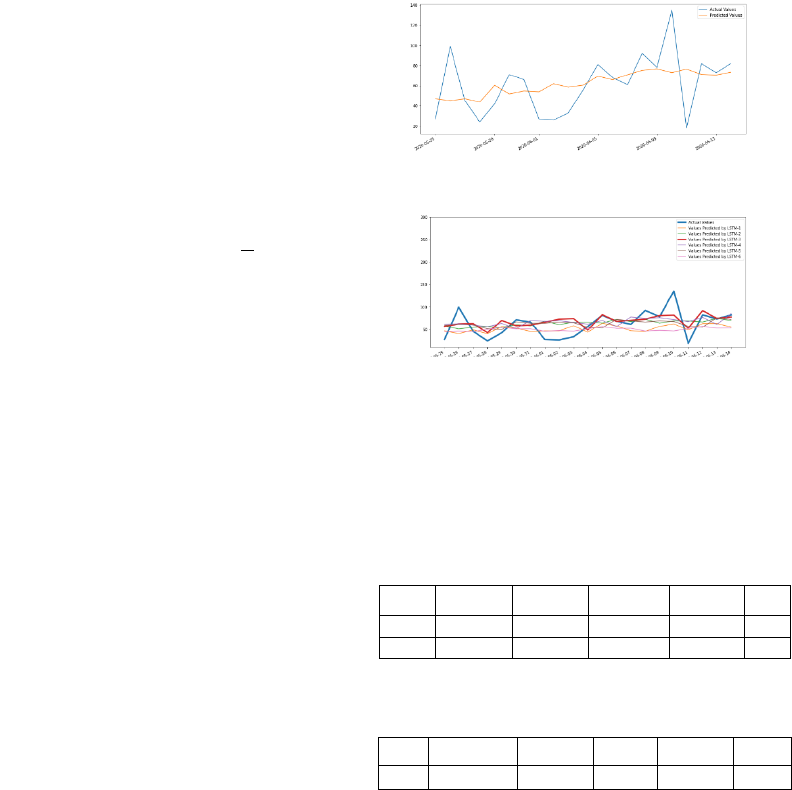
Figure 3:Curve of the CNN test.
Figure 4:Test curves from research team LSTM models.
Examining these curves for the purpose of the
comparison between real values and predicted values
using the proposed CNN model (Figure 3) and the
LSTM model (red one on Figure 4), we can notice
that the two models are very close.
Table 1: Evaluation of the proposed CNN model.
Model MSE RMSE MAE R2
Train CNN 267.23 16.35 11.74 0.68
Test CNN 723.95 26.91 20.06 0.15
Table 2: Test results of our research team best-fitted LSTM
model.
Model MSE RMSE MAE R2
Test
LSTM-3 658.65 25.66 19.95 0.23
5 CONCLUSIONS
In this work, we explore the efficiency of CNN model
to predict new cases in Morocco using a dataset of
time series data from March 02, 2020 to June 15,
2020. The experiments showed that a CNN model
with a single CNN layer is almost as efficient as an
LSTM model with three LSTM layers. It allows a
good prediction accuracy with an RMSE of 26.91.
Our findings and conclusions are demonstrated and
enhanced by various illustrations we provide in this
paper.
The results of the proposed CNN are very
promising and show that CNN can be a potentially
good alternative to LSTM model for similar problem.
This indeed encourages exploring its efficiency with
other settings such as more layers and more features.
ACKNOWLEDGEMENTS
This paper was written within the scope of a COVID-
19 project supported by the supervisory ministry
MENFPESRS and the CNRST of Morocco with the
aim of prevention and forecast the spread of the
COVID-19 pandemic.
REFERENCES
Abiodunab, O. I., Jantana, A., Omolarac, A. E., Dadad, K.
V., Mohamede, N. A., & Arshad, H. (2018). State-of-
the-art in artificial neural network applications: A
survey. Heliyon, 4(11), No e00938.
Alimadadi, A., Aryal, S., Manandhar, I., Munroe, P. B., Joe,
B., & Cheng, X. (2020). AI and Machine Learning for
Understanding Biological Processes. Physiological
Genomics, 52(4), 200-202.
Amo-Boateng, M. (2020). Tracking and Classifying Global
COVID-19 Cases by using 1D Deep Convolution
Neural Network. medRxiv, No 2020.06.09.20126565.
Apostolopoulos, I. D., & Mpesiana, T. A. (2020). Covid-19:
automatic detection from X-ray images utilizing
transfer learning with convolutional neural networks.
Physical and Engineering Sciences in Medicine, 43,
635–640.
Azarafza, M., Azarafza, M., & Tanha, J. (2020). COVID-
19 Infection Forecasting based on Deep Learning in
Iran. medRxiv.
doi:https://doi.org/10.1101/2020.05.16.20104182
Bai, S., Kolter, J. Z., & Koltun, V. (2018). An Empirical
Evaluation of Generic Convolutional and Recurrent
Networks for Sequence Modeling. arXiv, No
arXiv:1803.01271 .
Barman, A. (2020). Time Series Analysis and Forecasting
of COVID-19 Cases Using LSTM and ARIMA
Models. arXiv, No 2006.13852.
Binieli, M. (2018, 10 16). Machine learning: an
introduction to mean squared error and regression
lines. Retrieved 08 02, 2020, from
https://www.freecodecamp.org/news/machine-
learning-mean-squared-error-regression-line-
c7dde9a26b93/
Bouhamed, H. (2020). Covid-19 Cases and Recovery
Previsions with Deep Learning Nested Sequence
Prediction Models with Long Short-Term Memory
(LSTM) Architecture. International Journal of
Scientific Research in Computer Science and
Engineering, 8(2), 10-15.
Bratsas, C., Koupidis, K., Grau, J. M., Giannakopoulos, K.,
Kaloudis, A., & Aifadopoulou, G. (2020). A
Comparison of Machine Learning Methods for the
Prediction of Traffic Speed in Urban Places.
Sustainability , 12(1), No 142.
Chai, T., & Draxler, R. R. (2014). Root mean square error
(RMSE) or mean absolute error (MAE)? – Arguments
against avoiding RMSE in the literature. Geoscientific
Model Development, 7(3), 1247-1250.
Chimmula, V. K., & Zhang, L. (2020). Time series
forecasting of COVID-19 transmission in Canada using
LSTM networks. Chaos Solitons Fractals, 135, No
109864.
Dutta, S., Bandyopadhyay, S., & Kim, T.-H. (2020). CNN-
LSTM Model for Verifying Predictions of Covid-19
Cases. Asian Journal of Computer Science and
Information Technology, 5(4), 25-32.
Frank, R. J., Davey, N., & Hunt, S. P. (2001). Time Series
Prediction and Neural Networks. Journal of Intelligent
and Robotic Systems, 31, 91–103.
Ganatra, N., & Patel, A. (2018). A Comprehensive Study of
Deep Learning Architectures, Applications and Tools.
INTERNATIONAL JOURNAL OF COMPUTER
SCIENCES AND ENGINEERING, 6(12), 701-705.
Gozes, O., Frid-Adar, M., Greenspan, H., Browning, P.,
Zhang, H., Ji, W., . . . Siegel, E. (2020). Rapid AI
Development Cycle for the Coronavirus (COVID-19)
Pandemic: Initial Results for Automated Detection &
Patient Monitoring using Deep Learning CT Image
Analysis. arXiv, No arXiv2003.05037.
Hansen, C. (2019, 10 16). Optimizers Explained - Adam,
Momentum and Stochastic Gradient Descent. Retrieved
08 25, 2020, from
https://mlfromscratch.com/optimizers-explained/#/
Hidaka, A., & Kurita, T. (2017). Consecutive
Dimensionality Reduction by Canonical Correlation
Analysis for Visualization of Convolutional Neural
Networks. Proceedings of the ISCIE International
Symposium on Stochastic Systems Theory and its
Applications, 160-167.
Huang, C.-J., Chen, Y.-H., Ma, Y., & Kuo, P.-H. (2020).
Multiple-Input Deep Convolutional Neural Network
Model for COVID-19 Forecasting in China. medRxiv,
https://doi.org/10.1101/2020.03.23.20041608.
Islam, M. Z., & Asraf, A. (2020). A combined deep CNN-
LSTM network for the detection of novel coronavirus
(COVID-19) using X-ray images. Informatics in
Medicine Unlocked, 20, No 100412.
Kamal, I. M., Bae, H., Sunghyun, S., & Yun, H. (2020).
DERN: Deep Ensemble Learning Model for Short- and
Long-Term Prediction of Baltic Dry Index. Applied
Sciences, 10(4), No 1504.
Kathuria, C. (2019, 12 5). Regression — Why Mean Square
Error? Retrieved 08 02, 2020, from
https://towardsdatascience.com/https-medium-com-
chayankathuria-regression-why-mean-square-error-
a8cad2a1c96f
Lim, B., & Zohren, S. (20). Time Series Forecasting With
Deep Learning: A Survey. arXiv, No
arXiv:2004.13408.
Metsky, H., Freije, C., Kosoko-Thoroddsen, T.-S. S., &
Myhrvold, C. (2020). CRISPR-based COVID-19
surveillance using a genomically-comprehensive
machine learning approach. bioRxiv, No
bioRxiv2020.02.26.967026.
Minaee, S., Kafieh, R., Sonka, M., Yazdani, S., & Soufie,
G. J. (2020). Deep-COVID: Predicting COVID-19
from chest X-ray images using deep transfer learning.
Medical Image Analysis, 65, No 101794.
Oord, A. v., Dieleman, S., Zen, H., Simonyan, K., Vinyals,
O., Graves, A., . . . Kavukcuoglu, K. (2016). WaveNet:
A Generative Model for Raw Audio. arXiv, No
arXiv:1609.03499.
Organization, W. H. (2020, 08 02). Coronavirus disease
Situation Report – 138. Retrieved 08 03, 2020, from
https://www.who.int/docs/default-
source/coronaviruse/situation-reports/20200606-covid-
19-sitrep-138.pdf?sfvrsn=c8abfb17_4
Ozturk, T., Talo, M., Yildirim, E. A., Baloglu, U. B.,
Yildirime, O., & Acharya, U. (2020). Automated
detection of COVID-19 cases using deep neural
networks with X-ray images. Computers in Biology and
Medicine, 121, No 103792.
Pinter, G., Felde, I., MOSAVI, A., Ghamisi, P., &
Gloaguen, R. (2020). COVID-19 Pandemic Prediction
for Hungary; a Hybrid Machine Learning Approach.
medRxiv: The preprint Server for Health Sciences,
medRxiv 2020.05.02.20088427.
doi:https://doi.org/10.1101/2020.05.02.20088427
Punn, N. S., Sonbhadra, S. K., & Agarwal, S. (2020).
COVID-19 Epidemic Analysis using Machine Learning
and Deep Learning Algorithms. medRxiv, No medRxiv
2020.04.08.20057679.
Singh, D., Kumar, V., Vaishali, & Kaur, M. (2020).
Classification of COVID-19 patients from chest CT
images using multi-objective differential evolution–
based convolutional neural networks. European
Journal of Clinical Microbiology & Infectious Diseases
, 39, 1379–1389.
Singh, D., Kumar, V., Vaishali, & Kaur, M. (2020).
Coronavirus (COVID-19) Classification using CT
Images by Machine Learning Methods. European
Journal of Clinical Microbiology & Infectious
Diseases, 39, 1379–1389.
doi:https://doi.org/10.1007/s10096-020-03901-z
Vedova, C. D. (2018, 07 31). Régression linéaire simple :
le R2, info ou intox ? Retrieved 08 02, 2020, from
https://statistique-et-logiciel-r.com/regression-lineaire-
simple-le-r%C2%B2-info-ou-intox/
Wang, S., Kang, B., Ma, J., Zeng, X., Xiao, M., Guo, J., . .
. Xu, B. (2020). A deep learning algorithm using CT
images to screen for Corona Virus Disease (COVID-
19). medRxiv,
https://doi.org/10.1101/2020.02.14.20023028.
Wang, Y., Hu, M., Li, Q., Zhang, X.-P., Zhai, G., & Yao,
N. (2020). Abnormal respiratory patterns classifier may
contribute to large-scale screening of people infected
with COVID-19 in an accurate and unobtrusive
manner. arXiv, No arXiv2002.05534.
Zeroual, A., Harrou, F., Dairid, A., & Sun, Y. (2020). Deep
learning methods for forecasting COVID-19 time-
Series data: A Comparative study. Chaos, Solitons &
Fractals, 140, No. 110121.
