
An Employing Embedded Weather System for Self-driving Vehicles
Sahar Y. Mohammed
1
and Hamsa M. Ahmed
2a
1
Computer Science Department, Al-Maarif University College, Iraq
2
College of Computer and Information Technology, Computer Sciences Department, University of Anbar, Iraq
Keywords: Weather Station, Temperature, Self-driving Cars, Semi Self-driving Cars.
Abstract: Throughout daily life, control of the atmosphere plays a significant part and includes understanding the
atmosphere environment. This system is a compact, low-cost weather data collection device that allows data
to be collected, processed, and transmitted. The proposal for a smart weather station is a weather reporting
system over the local networking. Weather station system is a hardware and software program that reads the
status of the weather from the real-time temperature and humidity, which is an IoT that is a wirelessly
connected. The client can directly access via local IP from any device connected in the same local network.
It also shows the result on the front web application, as well as supports API routes. A weather station is also
a tool that uses two sensors to collect weather and environment-related data. That means we need a weather
station to make weather forecasts and collect weather-related data. Climate influences the actions of the car.
The efficiency of vehicles, surface traction, and road structures raise the likelihood of crashes. While
automated vehicles (AVs) are already on the road, in adverse conditions, they do not function very well. High
temperature leads to the driver losing control of the vehicle and a crash.
1 INTRODUCTION
Nearly 100,000 fatalities each year were triggered by
tropical weather. Most of these fatalities arise in areas
system. Sensors in the base of operations.
Consequently, the users have been provided the
approximate weather details. (T. M. Bumbary et al.,
2017). Monitoring the atmosphere can help to
monitor different climate practices, including air
temperature (T. Sung et al., 2014). There are several
examples of the significance of al-ecological
forecasting. In order to sustain strong crop growth and
to ensure a healthy working atmosphere in the
industry, environmental conditions must be tracked,
etc. Owing to technological progress, the way to read
environmental parameters has become easier than in
recent days. (A. Sharma et al., 2016). By
automatically activating such behaviour and
monitoring the other equipment depending on the
controlled values of temperature and humidity, this
program may be applied to an automation network in
your house. The real-time weather forecasting
network is a valuable resource for tracking
agricultural climatic factors, as an excellent
a
https://orcid.org/0000-0002-5911-9682
knowledge of the local environmental environment
allows many agricultural problems to be solved (S.
Tenzin at al., 2017). Thanks to its low prices, high
accuracy, and simple user experience with relatively
small maintenance costs, the proposed device is
handy (H. Saini et al, 2016).
In varying environmental environments and various
periods of days, the performance of individual
sensors shifts drastically. A LIDAR is very well
performing under bright circumstances, but its
sensitivity in rainy or snowy environments
dramatically decreases. To render autonomous
vehicles internationally appropriate in any nation and
throughout each region throughout addition to
operating with the same accuracy during the day, a lot
of work and development needs to be performed here.
Different climates have seen their results in the same
location. A trained model will be consistent quite
differently with others in every form of environment
picture. There has been a lot of work and. (S. Bag.
2017). Many obstacles for automated vehicles in
these areas include poor weather, especially because
the general lack of road maintenance often demands
improved danger identification, such as potholes, if
speeds advised must be sustained, in particular (J. P.
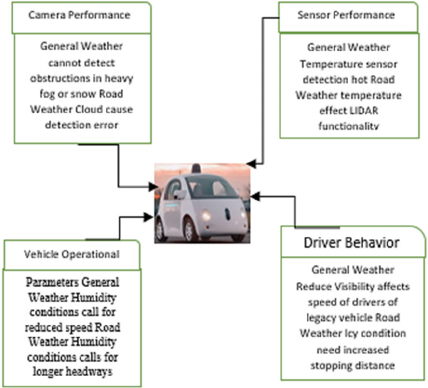
Sipani, et al., 2017). As shown in Figure 1, to ensure
safe road and efficient driving, Self-Driving Vehicles
to operate rainy or foggy, there will be a speed limit
so that the vehicle does not run at over speed. To
detect lane in bad weather or at night. (M. Daily et al.,
2017).
Figure 1: The relationship of self-driving cars with weather.
2 RELATED WORK
Although auto-driving cars need all the same
embedded systems as your car today, other methods
are much more important, critical for driving self-
driving vehicles. Self-driving cars need all the
technologies to make them completely aware of their
surroundings and able to respond to environmental
changes. The best reactions to villagers, other
vehicles on the road, road obstructions, and other road
hazards are essential for these automobiles. You will
have to take account of environmental changes. For
example, a self-driving car needs to know precisely
what it takes to drive in this area if a sudden rainstorm
or snowstorm occurs.
Dlnya Abdul had Aziz. 2018, illustrated the
stable, friendly, and structured design of control
systems with low-cost constraints. Due to its
implementation in various fields, the project charms
the (IoT) features in particular as a weather
monitoring device to match navigation; Selecting
transport routes, such as sailing, riding or flying, and
planting the seed in farms under specific conditions,
this work proved a sensible decision to implant the
device in the agricultural fields.
Greco, Luca et al., 2018, designed a new
microcontroller pick. The design of the device
involves a secret aim of achieving a low-power
consumable solution.
In addition to all remaining sensors, the
microcontroller will consume too little power
consumption. Sensor data is typically obtained as
integer values, representing the parameter value of
the setting. Sensor data is generally collected as
integer values, representing the parameter value of
the environment. For consumers to grasp, it will be in
a graphical image. The details hosting on the own site
page are more expensive and must be leased. To-the
expense of the program. This weather station
provides many benefits, including high precision,
high reliability, easy maintenance, low power
consumption, easy to extend, and remote monitoring
in real-time. The device is simple to construct,
compact, cost-effective, energy-effective, and
dependable. The hardware architecture and data
collection methods were illustrated-data of 4 months
with variability altitude and timing of weather
parameters.
M. Nsabagwa, M. Byamukama, E. Kondela, and
J. S. Otim, 2018, proposed an automatic weather
stations are important for the management of weather
information because they provide accurate and timely
data, however, if AWSs are inexpensive or not robust,
it is difficult to achieve timeliness and precision.
Because of our assessment in relation to the key non-
functional categories i.e., this paper has been
presented. Project attributes and constraints on
efficiency. There are several prototype issues that need
to be improved to get an affordable and sturdy AWS.
There are several prototype issues that need to be/
improved in order to achieve an affordable and robust
AWS. Power consumption. The prototype can
minimize power consumption by flipping the gateway,
The Pi Raspberry. The design of the power supply is
important for battery-powered AWS components such
as sensor nodes and microcontrollers with low power
gateways. Transmission of data. The first-generation
AWS prototype uses raspbian, an operating system
similar to that of Linux. A number of communication
devices are supported at the gateway. Environment
parameters. The first-generation AWS prototype lacks
rainfall measurements, which are particularly
important for East Africa. First-generation AWS
prototype is missing. Reliability. The correlations
between temperature data were non-linear, particularly
for July. This was due to the fact that the AWS
prototype temperature sensor was not enclosed in the
radiation shield, which caused the sensor to be heated
by direct sunlight and increased the reading values.
3 PROPOSED SYSTEM
Using the data cable to connect the Arduino Uno
board to the CPU. The breadboard is fitted with a
DHT 11 temperature and humidity sensor. The sensor
is again attached by the serial communication cables
to the Arduino Uno board. Later, the correct software
is imported into Arduino Software and the humidity
and temperature measurements are displayed in a
serial monitor. Arduino is the weather station's brain,
which gathers several data from sensor DH11. This
can calculate temperature and humidity from the
climate, as its name implies. The planned weather
station project is built around and process and view
them on the computer by using the web-based
Interface of the weather station to track data in real-
time. Users will view data anytime in real-time, the
intended outcome of this effort. This ensures that
consumers will view details in real-time if they decide
to learn what the temperature is. Then there are real-
time updates that allow users to schedule the day.
Awareness of such alarms that help prevent
emergencies. All modules have been planned, and all
components have been assembled. The growing
module has successfully been checked (see figures 2,
3, and 4). In a safe setting, the sensor readings were
effectively retrieved. More experiments in
environments more similar to real weather conditions
are therefore needed.
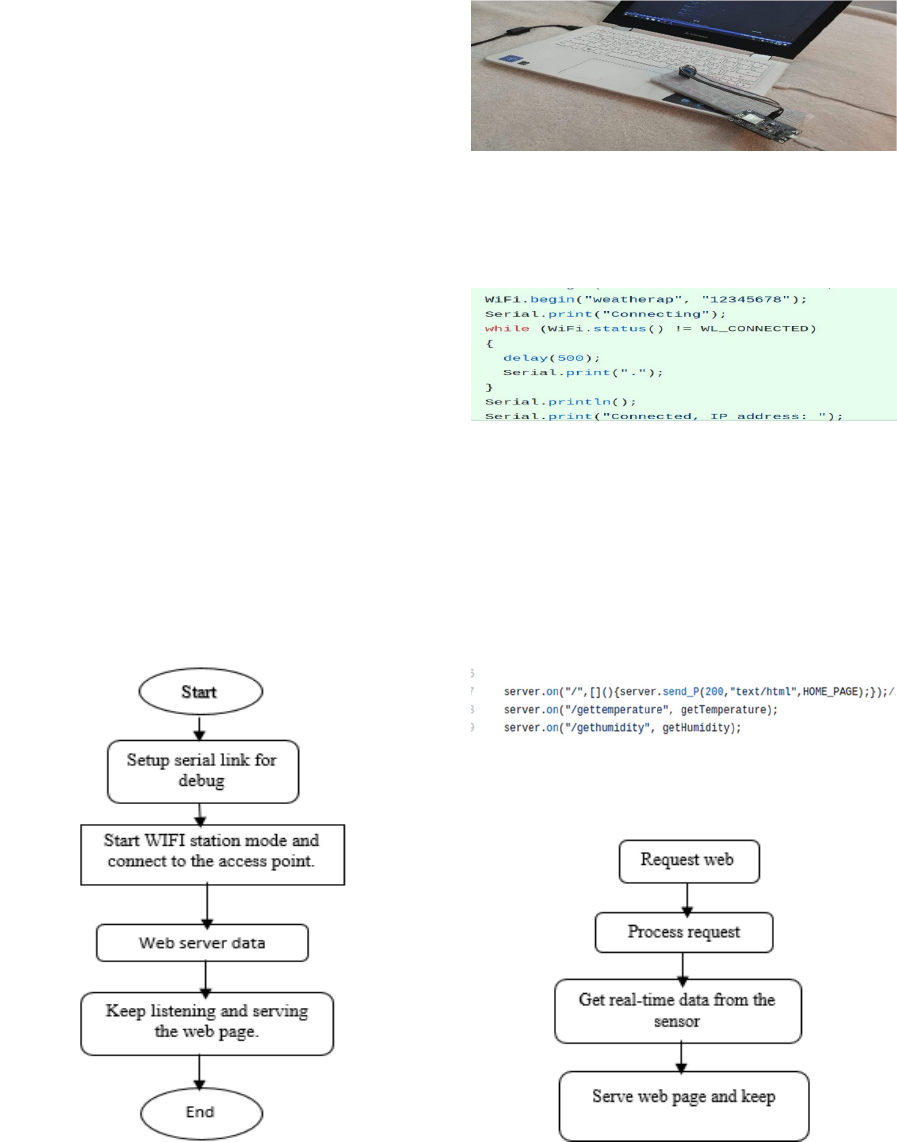
3.1 Code Mechanism
Figure 2: Code Mechanism.
The ESP8266 functions like an Access Point. We first
create a hotspot Wi-Fi link system (Access Point),
make web server, and handled it.
Figure 3: Connecting weather station components.
Setting up ESP8266 as an AP with the following
commands as a password using the Custom SSID
(WIFI AS) command.
Figure 4: WI-FI station mode and connect to the access
point.
As shown in figure 5, the centralized SDN controller
is responsible for “slice”. The infrastructure include
all physical network that consist some parts: “RAN
nodes”, devices, “transport network”, and “storage”,
then, connecting all the components to each sensor in
order to a breadboard and the connected jumper
wires.
Figure 5: Web -server data.
3.2 User Interaction with Architecture
Figure 6: User Interaction architecture.
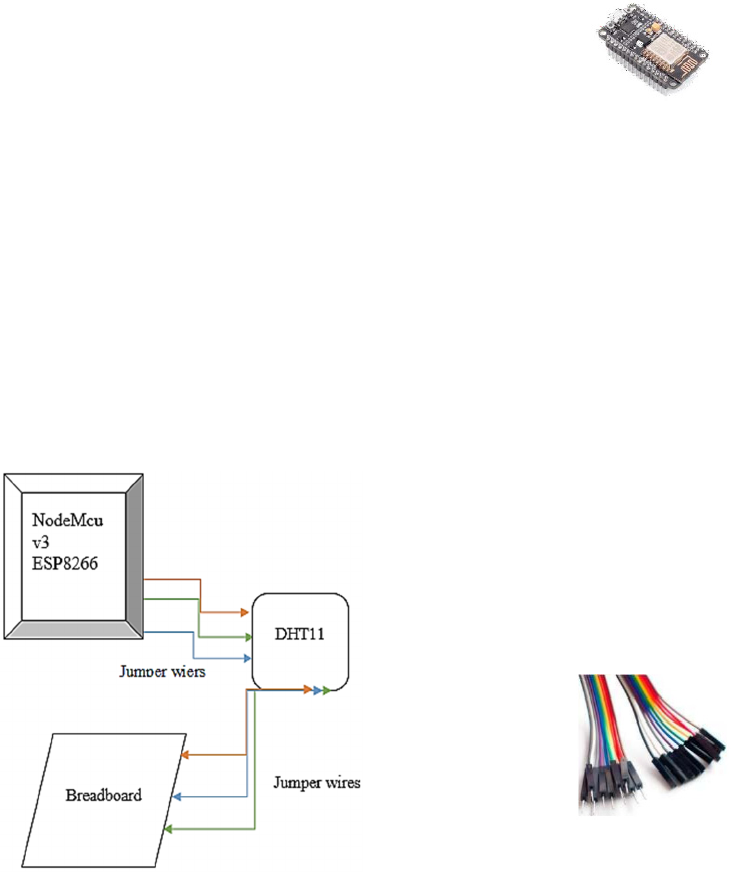
Figure 6 shows that the when take mobile and Turn
on Wi-Fi and in Wi-Fi configuration Search for hot
spot, and will find the hot-spot "ESP6822”
Webserver" with password provided in the software.
Open a web browser and enter the dynamic ip address
after connecting to the ESP hotspot. The DHT11
sensor display.
4 SYSTEM DESIGN
This paper introduces a weather station model based
on a microcontroller and a sensor. The system is
designed to be scalable and easy to set up and extend.
It is based on a powerful microcontroller (NodeMcu
v3 ESP8266) that manages the whole system and
sensor (DH11) for temperature and humidity (see
figures 7. For the observation and measurement of the
environment or the location.
4.1 NodeMCU V3 ESP8266
The ESP8266 contains a Wi-Fi transceiver. It not only
binds to and communicates with a Wi-Fi network, but
it even creates a system itself. There are many
microcontroller modules on the market, but the blades
are produced with minimal equipment as low as
practicable.
Figure 7: System design.
As in the module ESP6288, which only has one
analog signal (D. A. Aziz, 2018); (L. Greco et al.,
2016). NodeMCU is an open-source IoT program
operated by the ESP8266 Wi-Fi chip-based network.
Version 3 of NodeMCU is supported by an ESP-11E
(ESP8266MOD), a simple-to-use USB adapter built
on the CH340 g module and a micro USB connector,
with an analog and digital button. Arduino has
recently started to build a new microcontroller. This
war came about when a new ESP8266 Node MCU
module was developed and popularly recognized. As
shown in figure 8, the module is independent of the
AVR processors and partially similar to the Arduino
MCU (A. Al Dahoud and M. Fezari, 2018).
Figure 8: NodeMcu v3 ESP8266 (A. Al Dahoud and M.
Fezari, 2018).
4.2 Jumper Wires
Such quality jumper wires have a total of six (150
mm) and a 'line' of 40 (4 bits in each of ten rainbow
colors); on one end of them, It has 0.1 'male header
contacts and 0.1' contacts on the male header on the
other. The best thing is they are equipped with a 40-
pin belt cord. The ribbon wires may be taken off to
create an independent jumper or held together to
make entirely connected wires. Such male to female
jumpers is robotic and embedded system designs.
Electrical wiring is the electrical construction in a
system of the fence and the associated devices, such
as buttons, boards, and connectors. Cables are subject
to construction and implementation protection
requirements. Arduino Uno and breadboards have
three essential forms of jumper wires (R. Vijay et al.,
2017); (M. Kashyap et al., 2018), see figure 9:
• Male to male jumper wires.
• Male to female jumper wires.
• Female to female jumper wires
Figure 9: Jumper Wires (M. Kashyap et al., 2018)
Jumpers can be omitted or connected to other device
output solutions, including on/off switches. A jumper
is constructed of electricity transmitting materials and
is coated with a non-conducting membrane to avoid
unintended short circuits. The key benefit of the
jumper is its one-time configuration, rendering it less
vulnerable than firmware to manipulation or power
loss. (K. Chidhambaram et al., 2019).
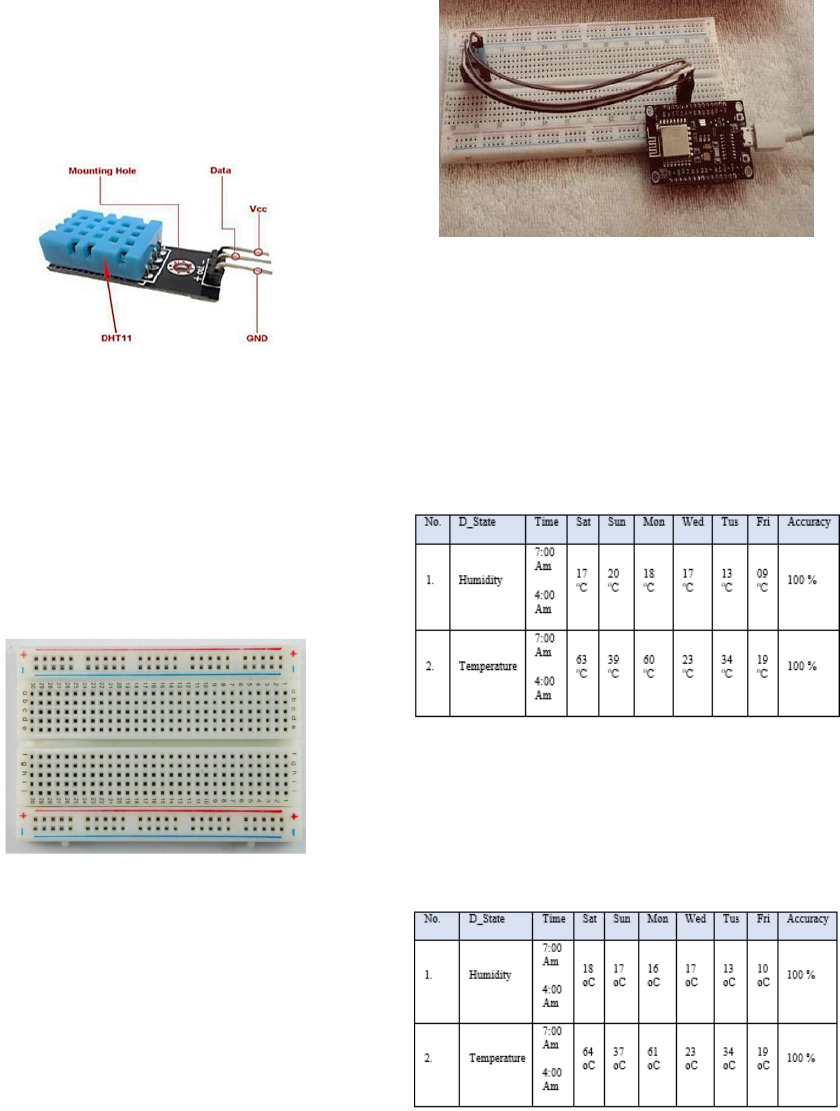
4.3 DHT11
DHT11 is an inexpensive, moisture and temperature-
sensitive sensor. We attached the DHT11 sensor to
the Arduino's digital pin seven during this
phase.There are three pins from Vcc, Data, and NC
(not linked) and GND from left to right. There are
primarily three buttons. DH11 is Connects the soil on
Arduino and Vcc soil to Arduino 5V production (E.
P. Uagbae, et al., 2018). DHT11 is a low-cost wireless
system for temperature control and air humidity
calculation (M. Katyal et al., 2018), see figure 10.
Figure 10: DHT11 (M. Katyal et al., 2018).
4.4 Breadboard
As depicts in figure 11, the breadboard had been a
useful tool for basic electronic experiments. The
breadboard can still survive for another ten years.
Nonetheless, a complicated wiring job can be a
nightmare during the trial except for an expert person.
Requires not only time to wires, but even a non-
logical error may arise where a loose connection
occurs between the jump.
Figure 11: Breadboard.
5 EXPERIMENTAL RESULT AND
DISCUSSION
A full system check was carried out prior to the start
of the experiment to ensure that the transmitter and
receiver system did not encounter a minimal error.
Every sensor has successfully been tested. The
experiment takes place by the receiver system
connected to a device see figure 12. The results are
the minimal error in sensor readings. The Interface
was installed, developed and installed to view the
data.
Figure 12: Hardware implementation.
Within the current weather method, realistic
enhanced data reliability outcomes are calculated.
The findings produced while the station operated
twice a day (7:00 a.m. to 4:00 p.m.) in six reading
periods (temp, hum) from the broadcaster node in
Ramadi Iraq between 1-April-2020 and 7 -April-2020
were seen in table1:
Table 1: Weather data from the proposed weather station.
The difference between reading from Table 1
(www.weather.com) and the reading from Table 2
(proposed weather station) is minimum. The
difference in temperature is about 2
o
C, the difference
in humidity is about 3%, were seen in table2:
Table 2: Weather data from the weather station.
A comparison between weather measurements
from air stations and weather.com, the results are
matched. Weather Station Accuracy 95.2 %. After
connecting the weather station to the wireless access
point, we use a networking tool to get the IP address
assigned to it by the access point DHCP service and
use this IP address to access the weather station's
web-based GUI for real-time data monitoring. And
we can use the same IP address with postfix
'/temperature' or '/humidity' and implement these as
an API to use with other apps that utilize our weather
station's service. All modules have been planned, and
all components have been assembled. Each module
had been successfully tested. The sensor readings
were recovered effectively in a safe environment and
the results are returned to the user for viewing through
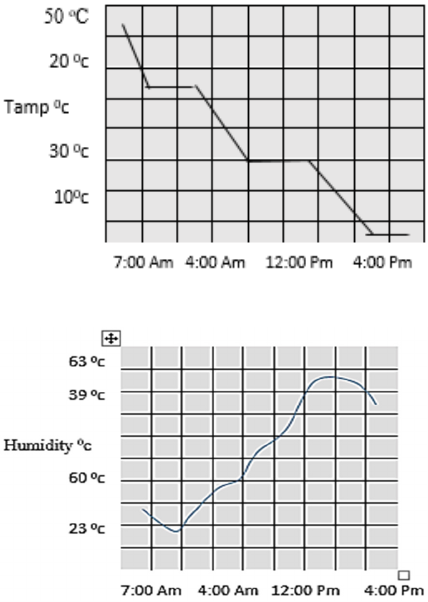
a web page. We then plotted graphical charts.
Using the data that offered a nice weather pattern
analytical view based on sensor readings. And the
evaluation process was completed. This study was
carried out in a controlled fashion. Curve of
performance of the findings obtained in the
experiments are below (see figures 13 and 14).
Figure 13: Temperature.
Figure 14: Humidity.
6 CONCLUSION AND FUTURE
SCOPE
This prototype offers a practical and low-cost
approach for continuous monitoring. Fast repair, low
power usage, natural expanding, and remote con troll
in real-time. The only drawback of this sensor is that
you can get current data from it every second or two
seconds. But, despite its efficiency and size, you can't
talk about it. As expected, one of the potential fields
of mobile apps is consistent with some core data
input. The unique feature to be included as an idea in
this device is that it can be used for any vital
environments or local area rather than. Costly
weather stations that can work on a full scale. Such
operate on public wireless networks to a limited
degree. The machine is built for (humidity,
temperature, air pressure, wind speed) direction, and
in the real-time calculation of the current values. The
algorithm for short- term weather forecasting can be
applied based on the juxtaposition of historical data
and actual calculated information, established
methods of weather forecasting, and the
determination of the relationship between produced
meteorological quantities. The device may be used to
measure temperature and humidity in space or
business. People with asthma, pregnancy, old age
need to have different temperature and humidity. The
heat and thickness of the goal region should be
experienced, not in a town or village.
Even when self-driving vehicles also
optimistically forecast temperatures at entry, the
development of the system is used in warm
environments with the first hardware. Nonetheless,
sunny weather conditions may hinder the
implementation of autonomous vehicles, or create
issues if it is deployed too rapidly in cold weather. In
the near term, some of these Motor vehicles will
secretly calculate, track and distribute direct road and
air condition (pressure, temperature) and indirect
(e.g., wiper, anti-locking, and vehicle stability control
system status) measurement and distribution.
Weather conditions play a significant role in affecting
self-driving cars, which are still under development
with advanced digital sensors and cameras to read
weather changes, such as temperature, precipitation,
and fog. Soon, we will work to develop this weather
monitoring to stop the self-driving car driving in the
event of high heat or humidity to avoid accidents. Bad
weather is an unusual natural occurrence. But a
defensive response may be performed to alert citizens
about adverse weather hazards on roads or deteriorate
the environment. Yet drivers may be admonished by
utilizing the weather station program on environment
and road conditions in real-time.
In the future, we can add a number of different
Sensors such as earthquakes detection sensor, rain
Rate sensor, light sensor and send data to the server
and to the cloud. User will communicate with the
device using the app.in the future, we will work to
develop this weather monitoring to stop the self-
driving car. Driving in the event of high heat or
humidity to avoid accidents.
ACKNOWLEDGEMENTS
First of all, praise and our appreciation to God who
facilitated this research. We would like to express our
appreciation and thank you very much for your help.
Ali Alshekarchee and Dr. Khattab M. Ali Alheeti
speech to teach values and patience
REFERENCES
T. M. Bumbary, “Utilizing a network of wireless weather
stations to forecast weather in developing countries,”
ISEC 2017 - Proc. 7th IEEE Integr. STEM Educ. Conf.,
vol. 00, no. c, pp. 109–111, 2017, doi:
10.1109/ISECon.2017.7910223.
W. T. Sung, J. H. Chen, C. L. Hsiao, and J. S. Lin, “Multi-
sensors data fusion based on arduino board and XBee
module technology,” Proc. - 2014 Int. Symp. Comput.
Consum. Control. IS3C 2014, pp. 422–425, 2014, doi:
10.1109/IS3C.2014.117.
A. Sharma, G. Tiwari, and D. Singh, “Low cost Solution for
Temperature and Humidity monitoring and control
System using Touch Screen Technology,” vol. 2, no. 1,
pp. 10–14, 2016.
C. S. Real-time, “Environmental Monitoring System Using
IoT and Environmental Monitoring System Using IoT
and Cloud Service at Real-Time,” 2019.
S. Tenzin, S. Siyang, T. Pobkrut, and T. Kerdcharoen,
“Low cost weather station for climate-smart
agriculture,” 2017 9th Int. Conf. Knowl. Smart
Technol. Crunching Inf. Everything, KST 2017, pp.
172–177, 2017, doi: 10.1109/KST.2017.7886085.
H. Saini, A. Thakur, S. Ahuja, N. Sabharwal, and N.
Kumar, “Arduino based automatic wireless weather
station with remote graphical application and alerts,”
3rd Int. Conf. Signal Process. Integr. Networks, SPIN
2016, pp. 605–609, 2016, doi: 10.1109/SPIN.2016.75
66768
S. Bag, “Deep Learning Localization for Self-driving
Cars,” ProQuest Diss. Theses, p. 104, 2017, [Online].
Available:
https://search.proquest.com/docview/1880508671?acc
ountid=49007%0Ahttp://www.yidu.edu.cn/educhina/e
duchina.do?artifact=&svalue=Deep+Learning+Localiz
ation+for+Self
J. P. Sipani, R. H. Patel, T. Upadhyaya, and V. T. Patel,
“Temperature & Humidity Monitoring & Control
System Based on Arduino and Sim900a Gsm Shield,”
Int. J. Electr. Electron. Data Commun., vol. 5, no. 11,
pp. 2320–2084, 2017, [Online]. Available:ACM Int.
Conf. Proceeding Ser., pp. 3–6, 2020, doi:
10.1145/3377049.3377121.
driving+Cars&stype=2&s=on%0Ahttp://sfx.cceu.org.c
n:3410/bisu? url_ver=Z39.88-2004&rft_val_fmt=.
M. Daily, S. Medasani, R. Behringer, and M. Trivedi, “Self-
Driving Cars,” Computer (Long. Beach. Calif)., vol. 50,
no. 12, pp. 18–23, 2017, doi: 10.1109/MC.20
17.4451204.
R. Chowdhury, Z. Islam, S. D. Rozario, Z. Mohammad, and
M. I. Ema, “Automated self driving car following lane
with emergency braking system,”
D. A. Aziz, “Webserver Based Smart Monitoring System
Using ESP8266 Node MCU Module,” Int. J. Sci. Eng.
Res., vol. 9, no. 6, pp. 801–808, 2018.
L. Greco, P. Ritrovato, T. Tiropanis, and F. Xhafa, “IoT
disasters,” Concurr. Comput. , vol. 30, no. 21, pp. 1–9,
2018, doi: 10.1002/cpe.4789.
A. Al Dahoud and M. Fezari, “NodeMCU V3 For Fast IoT
Application Development,” Notes, no. October, p. 5,
2018.
R. Vijay, T. Sainag, and V. Krishna, “Smart Home Wireless
Automation Technology using Arduino based on IOT
1,” vol. 8, pp. 38–45, 2017, [Online]. Available:
http://www.iject.org/vol8/issue4/7-rampeesa-vijay.pdf.
M. Kashyap, V. Sharma, and N. Gupta, “Taking MQTT and
NodeMcu to IOT: Communication in Internet of
Things,” Procedia Comput. Sci., vol. 132, no. Iccids,
pp. 1611–1618, 2018, doi: 10.1016/j.procs.20
18.05.126.
K. Chidhambaram, S. A. Kumar, T. M. Kumar, and D.
Dhanasekar, “Design Analysis of Land Surveying
Robot Using Arduino Uno,” no. May, pp. 6208–6214,
2019.
E. P. Uagbae, V. Eshiet, and U. Godwin, “Arduino-Based
Weather Monitoring System Arduino-Based Weather
Monitoring System,” no. February, pp. 835–846, 2018.
M. Katyal, Amber; Yadav, Ravi; Pandey, “Wireless
Arduino Based Weather Station,” Int. J. Eng. Sci. Res.
Technol., vol. 5, no. 4, pp. 238–240, 2019, doi:
10.5281/zenodo.2636956.
