
Citrus Orchards Monitoring based on Remote Sensing and Artificial
Intelligence Techniques: A Review of the Literature
Abdellatif Moussaid
1,2
, Sanaa El Fkihi
1
and Yahya Zennayi
2
1
IRDA Laboratory, ENSIAS, Mohammed V University, Rabat, Morocco
2
ESAI department, MAScIR, Rabat, Morocco
Keywords:
Smart agriculture, artificial intelligence, citrus monitoring, remote sensing, machine learning, deep learning.
Abstract:
In recent years, with the emergence of new technologies, in particular artificial intelligence techniques and
remote sensing data, agriculture has become intelligent. These technologies have helped us to improve the
quality and quantity of yield, and to facilitate many difficult tasks for farmers. In this paper, we will present
an extensive review of the techniques and themes used in the field of agriculture in general, and citrus crop in
particular, through the realization of a bibliometric and bibliographic study based on several published articles
over the last years. Through an in-depth analysis of several works, we have found that there are several factors
that are very interesting in this field. In fact, we have many parameters related to trees such as detection and
counting; canopy or crown size; tree location; detection of individual trees and missing trees, etc. We have also
the effect of vegetation indices such as normalized difference vegetation index(NDVI),normalized difference
red edge index(NDRE),modified chlorophyll absorption ratio index(MCARI), etc. Which are strongly corre-
lated with fruit production. In addition, monitoring tree health and water stress is very interesting. All these
factors and more can be obtained from high-resolution spectral images, using machine learning algorithms,
remote sensing techniques, and image processing. The purpose of this study is to explain how we can control
the situation of orchards to have better yield.
1 INTRODUCTION
In recent years, most scientific researchers in sev-
eral fields use artificial intelligence techniques in their
projects to get good results and to develop new ap-
proaches based on data. In fact, the field of agriculture
presents a lot of data every season. These data can be
external such as climatic or internal such as soil analy-
sis and tree monitoring. Thus, many of these data can
be extracted from spectral images in several bands,
which makes it possible to provide information on
vegetation, water stress, etc. In the electromagnetic
spectrum, we find several electromagnetic waves with
frequencies of different levels. In the field of remote
sensing, there is the visible part which contains the
RGB bands. These bands are the normal images that
we can see with the naked eye. Apart from this part,
there is the SWIR(Short-wave infrared ) part and the
LWIR(long wavelength infrared) part, which present
other spectral bands like multispectral images with 8
bands in the SWIR and 6 bands in the LWIR in addi-
tion to the RGB and panchromatic bands. There are
also the hyperspectral images that contain hundreds
of bands and the ultraspectral images with thousands
of bands. The presence of several bands allows us
to have more information and get several factors to
improve the field of agriculture, especially the citrus
crop which we are interested in. Since multispectral
or hyperspectral images provide interesting datasets,
whether imagery or digital, the presence of artificial
intelligence, especially machine learning algorithms
can help us predict the factors that will improve and
facilitate the agriculture monitoring.
The goal of this paper is to present a global vision
about the exploitation of spectral images as input data
for machine learning algorithms to extract and pre-
dict several factors which are very important to obtain
good yield and to facilitate several tasks for farmers.
The remaining of this article is structured as fol-
lows: section II gives an overview about the use of the
scientific mapping method to select the most useful
papers, and get an idea of the keywords most corre-
lated with our goals. Section III present a global syn-
thesis with comparisons on the factors and the works
which deal with the problematic of citrus tree moni-
toring based on remote sensing and/or artificial intel-
ligence. Finally, the conclusion is drawn in section
IV.
2 SCIENCE MAPPING
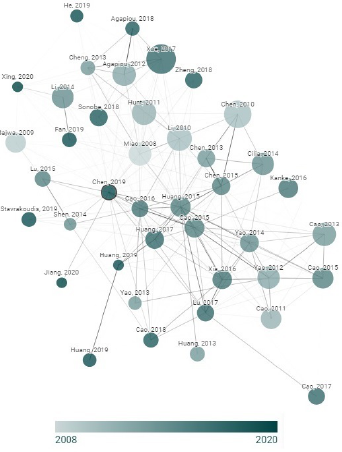
Figure 1: connected papers.
The goal of science mapping is to obtain a lot of
information and to select the best papers based on
citation, keywords, abstracts,etc. There are several
open source softwares used for scientific mapping.
In our case, we used SciMAT software (Cobo et al.,
2012)(open-source software tool developed to per-
form a science mapping analysis under a longitudinal
framework) to obtain several graphs based on list of
keywords with document number by each keyword,
papers citation and h-index. In our case, after ob-
taining and analyzing these graphs, we get a clear
vision of the papers which are strongly correlated to
our problem and which have a good quality. We also
get a good idea about the trends of artificial intelli-
gence techniques and remote sensing in agriculture,
especially the citrus cultivation. We also used an-
other software to obtain more documents correlated
to our problem. This software called connectedpa-
pers(LLC, ). It gives a graph composed of circles
with several links between them. The size of cir-
cles signify the number of citations. The thickness
of lines measures the correlation between the papers
based on keywords and abstracts. Finally, the visibil-
ity of the circles’ color indicates the age of the paper.
The graph in figure 1 is an example of graphs pro-
vided by connectedpapers software. The used key-
words are: ”smart agriculture, remote sensing, satel-
lite images, UAV images, spectral images, tree seg-
mentation, tree detection, tree canopy, tree crown, cit-
rus orchard monitoring, image processing, vegetation
index, water stress index, artificial intelligence, ma-
chine learning and deep learning”. The figure 1 shows
that we obtained a reasonable number of papers that
are correlated to the input paper and we can select the
best ones based on the citation, the correlation, and
the age.
3 CITRUS ORCHARD
MONITORING
The Citrus orchards need specific monitoring to give
good yield. In fact, this monitoring starts at the be-
ginning of the agricultural year and continues until
the harvest period, and concerns several parameters
that are very important to obtain good quality and
quantity of fruits. this monitoring also depends on
the phenological cycle of citrus as shown in figure 2
(Pons et al., 2012). In fact, all citrus species start with
the initiation phase when the small branch begins to
develop, the flowering period with two phases from
the beginning of flowers until full, after that we have
the fruit period with 4 phases: start with the initia-
tion of fruits, fruit development, coloration, and the
maturation phase when the fruits are ready to be har-
vested. Finally, after the harvest period, we have a
winter phase when the trees need rest. So, each citrus
orchard requires specific monitoring at each phase.
we have clear and well-known factors such as ir-
rigation and nutrition. So we all agree that without
these two parameters, we cannot get yield. The culti-
vation of citrus fruits requires fertilization which con-
tains the product necessary for each soil, and it also
needs good irrigation with then appropriate dosing
and at the best moment. Other important factors must
be under control as well. One of these latter is the
phytosanitary treatment against diseases that attack
citrus. Another important factor is the pruning op-
eration which is very important in each citrus orchard
to remove dead and broken branches to keep the best
size of trees. In addition, we have many very inter-
esting factors in each citrus orchard such as the cli-
mate (temperature, humidity, light ...), flowering, and
also the canopy and the size of the trees. So all these
factors and others can be extracted from multispectral
and hyperspectral images. Through the use of artifi-
cial intelligence techniques that exploit this data, we
can obtain an important follow-up of citrus orchards
during the agricultural year. In the next, we will give
more details about each factors.
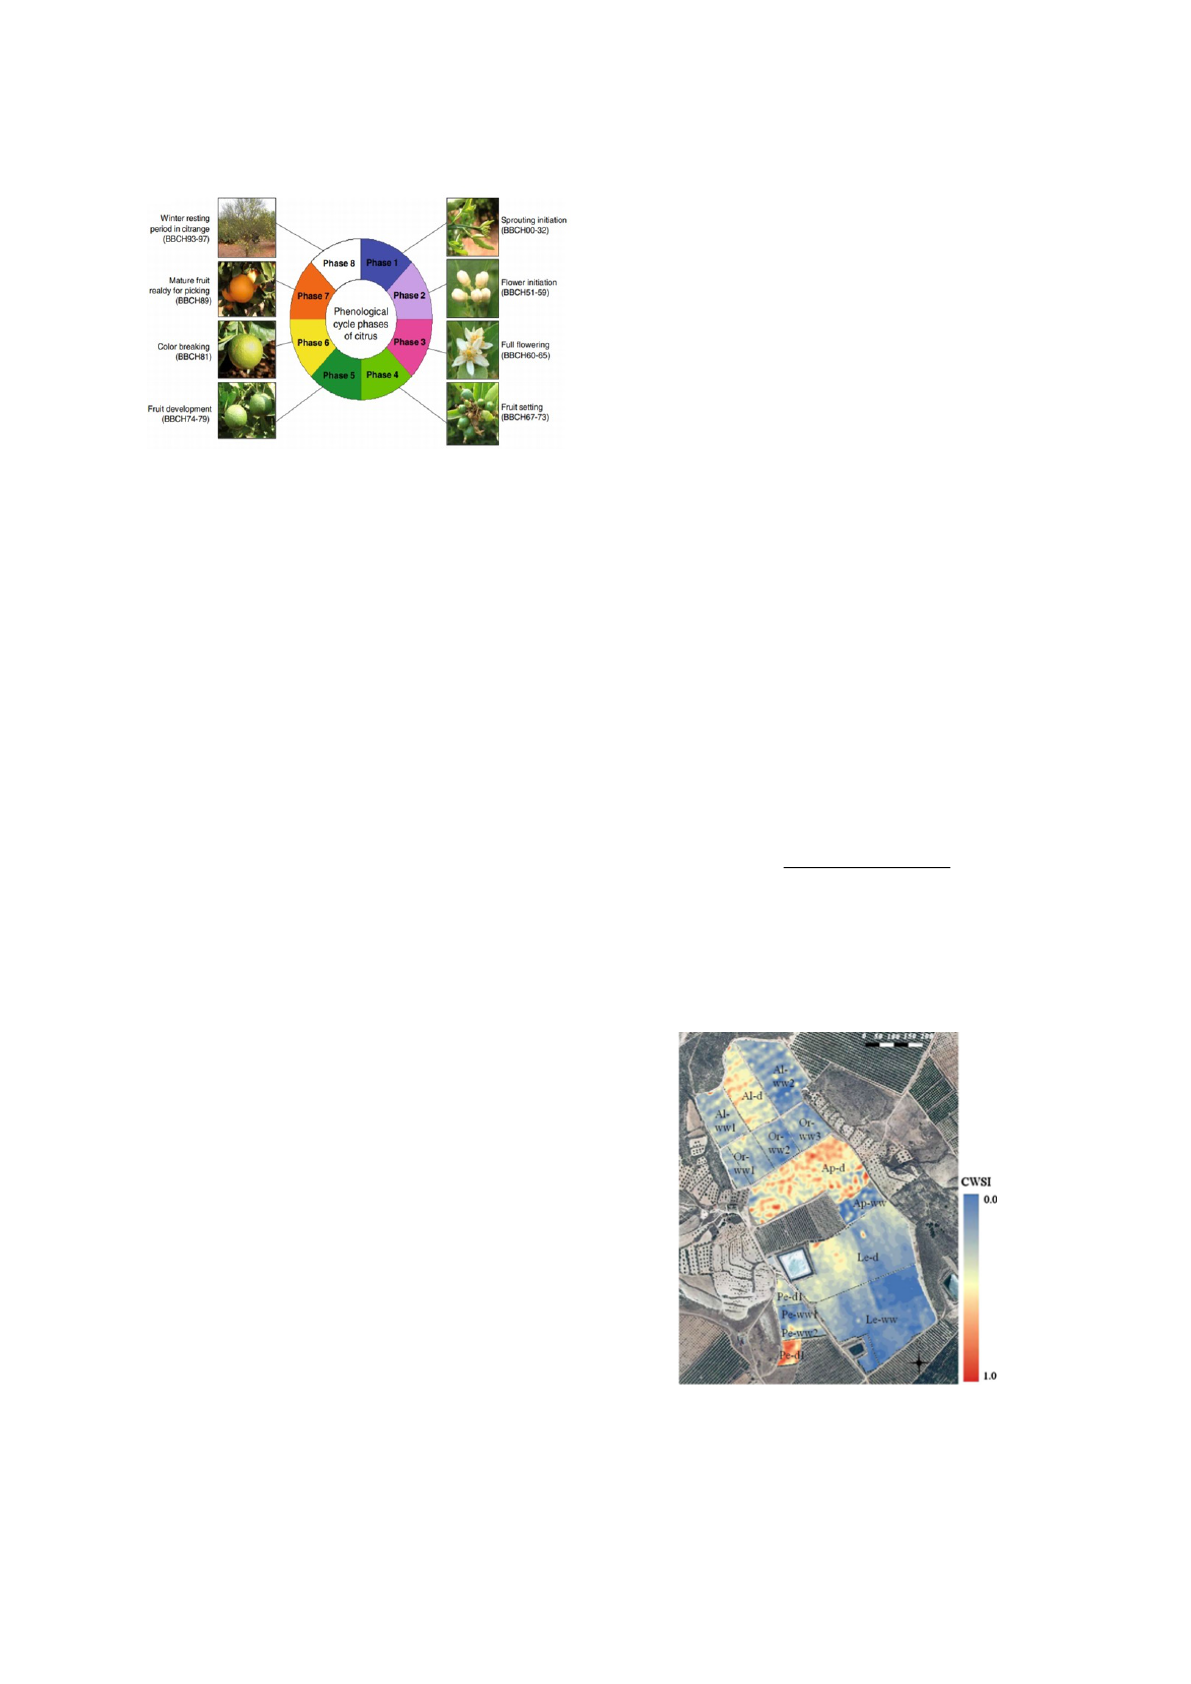
Figure 2: phenological cycle of citrus.
3.1 Irrigation and Nutrition
At the beginning of each crop year, citrus orchards
need a soil and tree test. These analyzes cover several
factors such as phosphorus which is very important
for the transfer of energy and the transport of the prod-
uct of photosynthesis, potassium for the regulation
of osmotic pressure, nitrogen for tree growth, mag-
nesium for fruit ripening and calcium which is also
important for the strength of the branches. All these
chemical elements are very important, and through to
laboratory analysis, we can control them at each pe-
riod of time to maximize or minimize the phytosani-
tary dose required(Obreza and Morgan, 2008). Along
with nutrition, there is irrigation, which is one of the
most important factors for producing good yield of
quality citrus. In fact, good irrigation consists of
knowing the quantity of water depending on differ-
ent areas in an orchard. Therefore, irrigation has a
direct impact on the health of trees as well as on the
yield, size and quality of fruits(Zarco-Tejada et al.,
2012). Thomas A. and al (Obreza and Morgan, 2008)
conducted several tests over different months on or-
ange trees and their soil in Florida. They discov-
ered that during the agricultural year, there are chemi-
cal compositions decrease such as potassium, magne-
sium, and nitrogen, and others increase like calcium.
So it is necessary to add other products or do what-
ever is necessary to balance these main factors. Also
in their work, they presented a recommendation on
the quantity of each chemical composition needed by
the soil and trees.
Salvatore Meli and al (Meli et al., 2002), say that
the period of good irrigation in the Mediterranean re-
gion begins in May and after a month the soil shows
an increase in microbial parameters.
However, soil and plants analysis in the labora-
tory is expensive and cannot be done several times a
year. There are other methods for determining wa-
ter stress and nutritional status based on imagery. For
example, multispectral and hyperspectral images pro-
vided by satellites or drones can give several signs
to vegetation and water stress which are very impor-
tant for analyzing the condition of the parcels and
for adding the necessary irrigation or nutrition. Cur-
rently, there are several projects for monitoring veg-
etation and water stress in orchards based on im-
agery and they are giving good results. Indeed, in
(Zhang et al., 2019) authors. It used multispectral im-
ages collected by an UAV to mapping water stress for
maize. In the last work, authors calculate a crop wa-
ter stress index (CWSI) by extracting several vegeta-
tion indices such as normalized difference vegetation
index (NDVI))(Rouse Jr, 1974) , renormalized dif-
ference vegetation index (RDVI)(Zarco-Tejada et al.,
2013), soil-adjusted vegetation index (SAVI)(Jackson
et al., 1981) , optimization of soil-adjusted vegeta-
tion index (OSAVI)(Haboudane et al., 2002) , and
transformed chlorophyll absorption in reflectance in-
dex (TCARI)(Haboudane et al., 2002).An example of
a mapping CWSI, is given in figure 3. It shows dis-
tribution of water stress; hence, he/she can decide the
accurate needed dosing water of each zone. Actually,
the CWSI can be calculated based on weather condi-
tions, but authors of (Zhang et al., 2019) demonstrate
that the CWSI extracted from multispectral images is
more efficient and cheaper.
The formula of CWSI is:
CW SI =
T (canopy) − T (wet)
T (dry) − T (wet)
(1)
where T(canopy) is the surface temperature of the
canopy, and T(wet) and T(dry) are reference surfaces
that are completely wet or dry to simulate maximum
and minimal leaf transpiration under the exposed en-
vironmental conditions.
Figure 3: Water stress index map
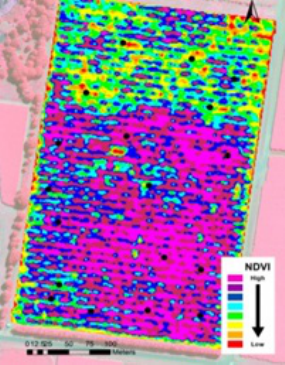
Another very important work (Gonzalez-Dugo et al.,
2013) explores the UAV thermal imagery to assess the
variability in the water status. The results of this work
is illustrated in figure 3 which consists of a map that
shows the distribution of CWSI by color. Thus, this
map helps us to define the regions that need water eas-
ily.
3.2 Phytosanitary Treatment
Citrus diseases are fatal for some species. However,
there are useful treatments for these diseases. In the
normal case, there is a follow-up by periodic visits to
the orchards in order to monitor the health of trees and
to initiate the necessary treatment at the beginning of
the disease. Nonetheless, if there are large parcels, it
is difficult to be controlled by humans, and sometimes
there is a delay in the detection of the diseases, which
negatively influences the fruits. For this reason, the
use of remote sensing images to detect a disease or
its limitations is very interesting. Actually, the use of
remote sensing images in agriculture is not a new field
in the sense that many projects have been conducted
by it. In the next, we will give some examples:
Several spectroscopes and imaging techniques
have been studied to detect diseases such: (Bravo
et al., 2004; Moshou et al., 2004; Chaerle
et al., 2007) that are based on fluorescence imag-
ing technique,(Sevick-Muraca and Paithankar, 1999;
Shafri and Hamdan, 2009; Qin et al., 2009) used spec-
tral imaging.while (Spinelli et al., 2004) and (Purcell
et al., 2009) use infrared spectroscop, and (Yang et al.,
2007; Delalieux et al., 2007; Chen et al., 2007) use the
visible/multiband spectroscopy.
The idea of remote sensing is to provide images
with several bands with frequencies that exceed the
visible spectrum and is able to find some differences
in the structure of plants and trees in order to decide
if there are changes by diseases. Sometimes these
changes occur in the vegetation. through the expe-
rience of researchers in this field, it has appeared that
there are specific changes in certain bands such as
near-infrared and infrared because of diseases. Au-
thors of(Hahn, 2009) says that the Sensors for disease
detection and food quality will evolve over the next
years with the help of nanotechnology. In fact, flu-
orescence and vision sensors can detect the quality
of fruit and predict diseases more accurately than our
eyes. The spectral range of the sensor is wider than
the spectral response of the naked eye and the sensors
are capable of detecting polarized light. Nanotechnol-
ogy is able to capture gases in bubbles creating inter-
nal reactions without affecting the quality of fruits or
vegetables. Thus, with these technologies, we man-
age and minimize the use of phytosanitary products,
and with artificial intelligence algorithms, we can col-
lect historical data to predict and control the disease
before it occurs.
3.3 Vegetation and Canopy
Among the very interesting factors in the monitoring
of citrus orchards, there is the condition of the vegeta-
tion. This vegetation helps the farmer to know every
place or every tree that needs more care. In fact, the
vegetation index can be extracted from RGB images,
multispectral images, and hyperspectral images, but
the precision will be different. in fact, hyperspectral
images contain hundreds of bands which can get more
information, and if we have a good spatial resolution,
we can extract a vegetation index from each tree or
from each part of the orchard.
In table 1 we present some vegetation indexes.
Figure 4: Exemple of NDVI classification map.
As we can see in figure 4, authors of (Robson et al.,
2017) control the situation of orchard by extracting
several vegetation indexes from worldview-3 multi-
spectral images, and select the most important index
based on PCA(principal component analysis)(Wold
et al., 1987) approach to map the vegetation of yield
in each part of orchard.
In addition, the detection, segmentation, and
counting of trees are very important in the monitor-
ing of each orchard. These factors can be produced
using deep learning and machine learning algorithms
(Koirala et al., 2019; Zou et al., 2019).
Actually with data science approaches, especially
deep learning architectures like U-net, RCNN, faster
RCNN, Yolo, retinanet.etc, the scientific researchers
improve the result of object segmentation. With these
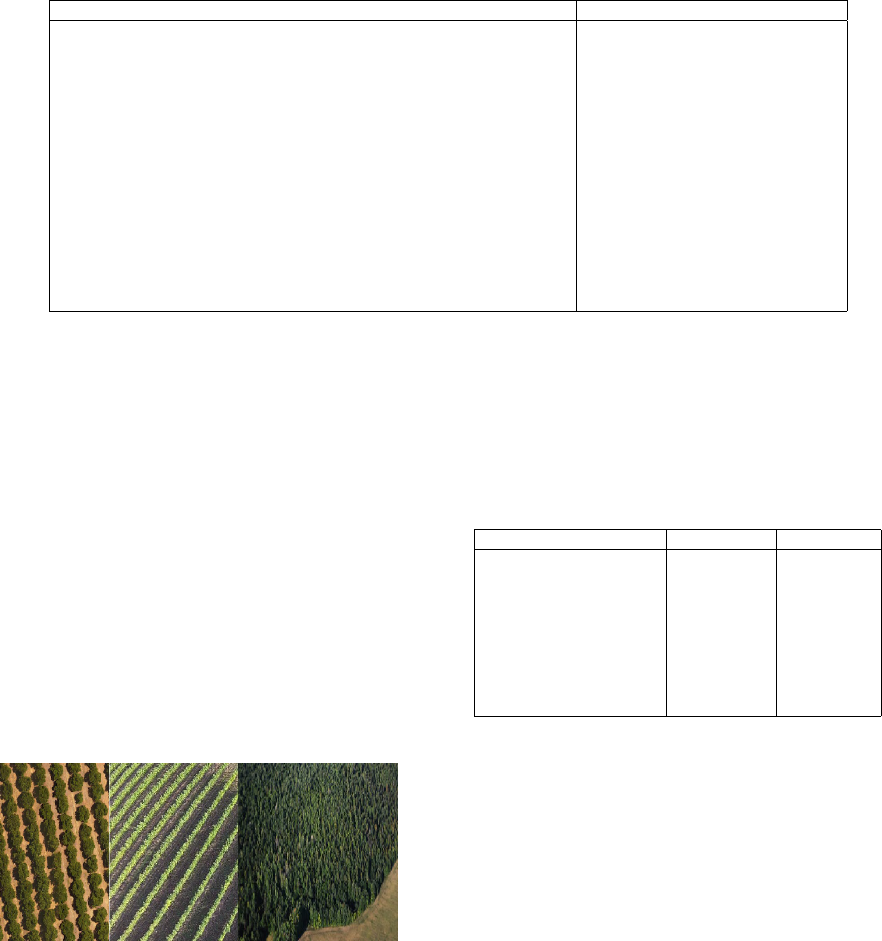
Table 1: Vegetation indexes by formula.
Vegetation Index Formula
Normalized Difference Rededge/Red (NDVI rededge)(Gobron et al., 2000) (RE - R) / (RE + R)
Transformed Chlorophyll Absorption in Reflectance Index (TCARI)(Haboudane et al., 2002) 3 × ((RE - R) - 0.2 x (RE - G) × (RE/R))
Structure Insensitive Pigment Index (SIPI)(Penuelas et al., 1995) (NIR1 - B) / (NIR1 + R)
Coastal Blue Structure Insensitive Pigment Index (CB SIPI)(Penuelas et al., 1995) (NIR1 - CB) / (NIR1 + CB)
Normalized difference Red/Red-edge index (R / RENDVI(Gitelson et al., 1996b) (NIR1 - R) / (NIR1 + RE)
Normalized difference Red/NIR2 index (R / N2NDVI)(Robson et al., 2014) (NIR1 - R) / (NIR1 + NIR2)
Green normalized difference vegetation index (GNDVI)(Gitelson et al., 1996a) (NIR1 - G) / (NIR1 + G)
Modified Simple Ratio (MSR)(Chen, 1996) (NIR1/R - 1)/(SQRT((NIR1 / R) + 1))
Ratio Vegetation Index (RVI)(Jordan, 1969) NIR1/R
Normalized Difference Vegetation Index (N1NDVI)(Rouse Jr et al., 1974) (NIR1 - R) / (NIR1 + R)
Normalized Difference Vegetation Index (N2NDVI)(Rouse Jr et al., 1974) (NIR2 - R) / (NIR2 + R)
Normalized difference red edge index 1 (RENDVI1)(Fitzgerald et al., 2010) (NIR1 - RE) / (NIR1 + RE)
Normalized difference red edge index 2 (RENDVI2)(Fitzgerald et al., 2010) (NIR2 - RE) / (NIR2 + RE)
Transformed difference vegetation index (TDVI)(Bannari et al., 2002) 1.5 x ((NIR1 - R) / (SQRT(NIR1
2
+ R + 0.5))
Transformed difference vegetation index 2 (TDVI2)(Bannari et al., 2002) 1.5 x ((NIR2 - R)/(SQRT(NIR2
2
+ R + 0.5))
1
R: red band(631–689 nm), RE: red edge band(703–742 nm), G : green band(516–578 nm), B : blue band(407–448 nm), CB: coastal blue (407–448 nm),
NIR1: near infra-red 1 band(774–874 nm), NIR2: near infra-red 2 band(869–958 nm).
new technologies, We achieved a control of the tree
state or each small part in the orchard. In this case,
we have a lot of challenges to do some segmentation
of trees.
Three types of trees can be distinguished:(1) the
orchards that are not condensed and we can see the
space between the trees and between the parcels. (2)
is the case where we have a very condensed rows of
trees which cannot be separated, but we can see the
space between the rows. Therefore, we can do some
segmentation based on these rows. In the last type
(3) orchards are overcrowded; we cannot separate the
trees or the rows. In this case, we can make a seg-
mentation by defining a fixed area, and detecting the
spaces in orchards. Figure 5 give an example of the
overcrowded orchards.
Figure 5: Overcrowding of trees.
Many examples of projects use the crown or canopy
of the tree to control the state of trees, parcels or or-
chards. Authors of(Zortea et al., 2018) collect large
data that contain citrus trees images with a good res-
olution using a drone. Then they classify each part of
32 * 32 pixels to know whether it is a tree or not. In
fact, their model with 17 layers and trained to 56000
images gave a good result with 94% in accuracy.
Table II presents a list of works with results that use
trees segmentation. and as we can see, the deep learn-
ing approaches such as CNN and Mask R-CNN gives
a good score compared to the other methods. In ad-
dition, the image data provided by UAV with good
resolution, help the model to be perfect.
Table 2: Trees segmentation approaches and results
Approach Results Data
CNN(Zortea et al., 2018) 94(accuracy) UAV
VF(Gougeon, 1995) 81(accuracy) Aerial image
LMF(Nelson et al., 2005) 13.67 (Z-score) Satellite images
WS(Wang et al., 2004) 75.6(percentage) Aerial imagery
LM(Santoro et al., 2013) 0.8(RMSE) Satellite images
OBD(Ardila et al., 2012) 0.8(R
2
) Satellite images
PBP(Ok and Ozdarici-Ok, 2018) 91(accuracy) Satellite images
U-Net(Zhao et al., 2018) 61.2 (accuracy) UAV
MRCNN(Zhao et al., 2018) 98.5(accuracy) UAV
2
CNN: convolutional neural network,
VF: Valley following,
LMF : Local maximum filtering,
WS : Watershed segmentation,
OBD: Object-based detection,
PBP: Pixel-based performance,
U-NET: Convolutional Networks for Biomedical Image Segmentation,
MRCNN: mask Region-based Convolutional Neural Networks.
4 CONCLUSION
The Citrus crop requires special monitoring to obtain
good performance in terms of quality and quantity.
In fact, several parameters are responsible for it, such
as climate, nutrition, irrigation, drop of flowers and
fruits, rootstock operation, and the size of the tree
canopy, etc. In this case, the spectral images provide
a lot of historical data about all these parameters and
other. Indeed, with remote sensing techniques, we can
control vegetation, water stress, and diseases in cit-
rus orchards at any time of the year. Also, with data
science approaches, in particular deep learning, we
use spectral images to make several segmentation’s
of trees or rows and to do several classifications by
size, by vegetation and also by water stress. In this
sense, several works have given a good score greater
than 98% in precision. But these works are based
on UAV images that have a very high resolution and
in orchards that contain non-condensed trees. More-
over, the spectral images provided by satellite they
don’t have a very high resolution (the highest reso-
lution is 0.31m in worldview3), so when we have an
overcrowded orchard, it is difficult to get a good re-
sult. In addition, the deep learning algorithms need
big data in training to give good precision. In fact,
if we compare drone and satellite images we can say
that the satellite offers historical images with a good
resolution, but to produce very high resolution im-
ages, we need to use the drone every year and wait
a few years to collect them. Also to make predic-
tions about yield and disease, machine learning al-
gorithms need the maximum amount of data. In this
case, smart agriculture needs an information system
capable to follow-up the orchards and collecting data
at any time. Finally, With all these technologies, we
can get several factors which are very important to fa-
cilitate several tasks for the farmers and to develop the
yield.
ACKNOWLEDGEMENTS
This work is part of the Multispectral satellite
imagery, data mining and agricultural applications
project, funded by the academy Hassan II of Science
and Technology.
REFERENCES
Ardila, J. P., Bijker, W., Tolpekin, V. A., and Stein, A.
(2012). Multitemporal change detection of urban trees
using localized region-based active contours in vhr
images. Remote sensing of environment, 124:413–
426.
Bannari, A., Asalhi, H., and Teillet, P. M. (2002). Trans-
formed difference vegetation index (tdvi) for vege-
tation cover mapping. In IEEE International geo-
science and remote sensing symposium, volume 5,
pages 3053–3055. IEEE.
Bravo, C., Moshou, D., Oberti, R., West, J., McCartney,
A., Bodria, L., and Ramon, H. (2004). Foliar disease
detection in the field using optical sensor fusion.
Chaerle, L., Lenk, S., Hagenbeek, D., Buschmann, C., and
Van Der Straeten, D. (2007). Multicolor fluorescence
imaging for early detection of the hypersensitive reac-
tion to tobacco mosaic virus. Journal of plant physi-
ology, 164(3):253–262.
Chen, B., Wang, K., Li, S., Wang, J., Bai, J., Xiao, C.,
and Lai, J. (2007). Spectrum characteristics of cot-
ton canopy infected with verticillium wilt and inver-
sion of severity level. In International Conference
on Computer and Computing Technologies in Agricul-
ture, pages 1169–1180. Springer.
Chen, J. M. (1996). Evaluation of vegetation indices and a
modified simple ratio for boreal applications. Cana-
dian Journal of Remote Sensing, 22(3):229–242.
Cobo, M. J., L
´
opez-Herrera, A. G., Herrera-Viedma, E.,
and Herrera, F. (2012). Scimat: A new science map-
ping analysis software tool. Journal of the Ameri-
can Society for Information Science and Technology,
63(8):1609–1630.
Delalieux, S., Van Aardt, J., Keulemans, W., Schrevens, E.,
and Coppin, P. (2007). Detection of biotic stress (ven-
turia inaequalis) in apple trees using hyperspectral
data: Non-parametric statistical approaches and phys-
iological implications. European Journal of Agron-
omy, 27(1):130–143.
Fitzgerald, G., Rodriguez, D., and O’Leary, G. (2010).
Measuring and predicting canopy nitrogen nutrition
in wheat using a spectral index—the canopy chloro-
phyll content index (ccci). Field Crops Research,
116(3):318–324.
Gitelson, A. A., Kaufman, Y. J., Merzlyak, M. N., et al.
(1996a). Use of a green channel in remote sensing of
global vegetation from eos-modis. Remote sensing of
Environment, 58(3):289–298.
Gitelson, A. A., Merzlyak, M. N., and Lichtenthaler, H. K.
(1996b). Detection of red edge position and chloro-
phyll content by reflectance measurements near 700
nm. Journal of plant physiology, 148(3-4):501–508.
Gobron, N., Pinty, B., Verstraete, M. M., and Widlowski,
J.-L. (2000). Advanced vegetation indices optimized
for up-coming sensors: Design, performance, and ap-
plications. IEEE Transactions on Geoscience and Re-
mote Sensing, 38(6):2489–2505.
Gonzalez-Dugo, V., Zarco-Tejada, P., Nicol
´
as, E., Nortes,
P. A., Alarc
´
on, J., Intrigliolo, D. S., and Fereres, E.
(2013). Using high resolution uav thermal imagery to
assess the variability in the water status of five fruit
tree species within a commercial orchard. Precision
Agriculture, 14(6):660–678.
Gougeon, F. A. (1995). A crown-following approach to
the automatic delineation of individual tree crowns in
high spatial resolution aerial images. Canadian jour-
nal of remote sensing, 21(3):274–284.
Haboudane, D., Miller, J. R., Tremblay, N., Zarco-Tejada,
P. J., and Dextraze, L. (2002). Integrated narrow-band
vegetation indices for prediction of crop chlorophyll
content for application to precision agriculture. Re-
mote sensing of environment, 81(2-3):416–426.
Hahn, F. (2009). Actual pathogen detection: sensors and
algorithms-a review. Algorithms, 2(1):301–338.
Jackson, R. D., Idso, S., Reginato, R., and Pinter Jr, P.
(1981). Canopy temperature as a crop water stress in-
dicator. Water resources research, 17(4):1133–1138.
Jordan, C. F. (1969). Derivation of leaf-area index
from quality of light on the forest floor. Ecology,
50(4):663–666.
Koirala, A., Walsh, K. B., Wang, Z., and McCarthy, C.
(2019). Deep learning–method overview and review
of use for fruit detection and yield estimation. Com-
puters and Electronics in Agriculture, 162:219–234.
LLC, M. connectedpapers.com.
Meli, S., Porto, M., Belligno, A., Bufo, S. A., Mazzatura,
A., and Scopa, A. (2002). Influence of irrigation with
lagooned urban wastewater on chemical and micro-
biological soil parameters in a citrus orchard under
mediterranean condition. Science of the total environ-
ment, 285(1-3):69–77.
Moshou, D., Bravo, C., West, J., Wahlen, S., McCartney,
A., and Ramon, H. (2004). Automatic detection of
‘yellow rust’in wheat using reflectance measurements
and neural networks. Computers and electronics in
agriculture, 44(3):173–188.
Nelson, T., Boots, B., and Wulder, M. A. (2005). Tech-
niques for accuracy assessment of tree locations ex-
tracted from remotely sensed imagery. Journal of en-
vironmental management, 74(3):265–271.
Obreza, T. T. and Morgan, K. T. (2008). Nutrition of florida
citrus trees. EDIS, 2008(2).
Ok, A. O. and Ozdarici-Ok, A. (2018). 2-d delineation
of individual citrus trees from uav-based dense pho-
togrammetric surface models. International Journal
of Digital Earth, 11(6):583–608.
Penuelas, J., Baret, F., and Filella, I. (1995). Semi-empirical
indices to assess carotenoids/chlorophyll a ratio from
leaf spectral reflectance. Photosynthetica, 31(2):221–
230.
Pons, E., Peris, J. E., and Pe
˜
na, L. (2012). Field perfor-
mance of transgenic citrus trees: Assessment of the
long-term expression of uida and nptiitransgenes and
its impact on relevant agronomic and phenotypic char-
acteristics. BMC biotechnology, 12(1):41.
Purcell, D. E., O’Shea, M. G., Johnson, R. A., and Kokot, S.
(2009). Near-infrared spectroscopy for the prediction
of disease ratings for fiji leaf gall in sugarcane clones.
Applied Spectroscopy, 63(4):450–457.
Qin, J., Burks, T. F., Ritenour, M. A., and Bonn, W. G.
(2009). Detection of citrus canker using hyperspectral
reflectance imaging with spectral information diver-
gence. Journal of food engineering, 93(2):183–191.
Robson, A., Petty, J., Joyce, D., Marques, J., and Hofman,
P. (2014). High resolution remote sensing, gis and
google earth for avocado fruit quality mapping and
tree number auditing. In XXIX International Horti-
cultural Congress on Horticulture: Sustaining Lives,
Livelihoods and Landscapes (IHC2014): 1130, pages
589–596.
Robson, A., Rahman, M. M., and Muir, J. (2017). Using
worldview satellite imagery to map yield in avocado
(persea americana): a case study in bundaberg, aus-
tralia. Remote Sensing, 9(12):1223.
Rouse Jr, J. (1974). Monitoring the vernal advancement
and retrogradation (green wave effect) of natural veg-
etation.
Rouse Jr, J., Haas, R., Schell, J., and Deering, D. (1974).
Paper a 20. In Third Earth Resources Technology
Satellite-1 Symposium: The Proceedings of a Sympo-
sium Held by Goddard Space Flight Center at Wash-
ington, DC on December 10-14, 1973: Prepared at
Goddard Space Flight Center, volume 351, page 309.
Scientific and Technical Information Office, National
Aeronautics and Space . . . .
Santoro, F., Tarantino, E., Figorito, B., Gualano, S., and
D’Onghia, A. M. (2013). A tree counting algorithm
for precision agriculture tasks. International Journal
of Digital Earth, 6(1):94–102.
Sevick-Muraca, E. M. and Paithankar, D. Y. (1999). Flu-
orescence imaging system and method. US Patent
5,865,754.
Shafri, H. Z. and Hamdan, N. (2009). Hyperspectral im-
agery for mapping disease infection in oil palm planta-
tionusing vegetation indices and red edge techniques.
American Journal of Applied Sciences, 6(6):1031.
Spinelli, F., Noferini, M., and Costa, G. (2004). Near in-
frared spectroscopy (nirs): perspective of fire blight
detection in asymptomatic plant material. In X Inter-
national Workshop on Fire Blight 704, pages 87–90.
Wang, L., Gong, P., and Biging, G. S. (2004). Individual
tree-crown delineation and treetop detection in high-
spatial-resolution aerial imagery. Photogrammetric
Engineering & Remote Sensing, 70(3):351–357.
Wold, S., Esbensen, K., and Geladi, P. (1987). Principal
component analysis. Chemometrics and intelligent
laboratory systems, 2(1-3):37–52.
Yang, C.-M., Cheng, C.-H., and Chen, R.-K. (2007).
Changes in spectral characteristics of rice canopy in-
fested with brown planthopper and leaffolder. Crop
science, 47(1):329–335.
Zarco-Tejada, P. J., Gonz
´
alez-Dugo, V., and Berni, J. A.
(2012). Fluorescence, temperature and narrow-band
indices acquired from a uav platform for water stress
detection using a micro-hyperspectral imager and a
thermal camera. Remote sensing of environment,
117:322–337.
Zarco-Tejada, P. J., Gonz
´
alez-Dugo, V., Williams, L.,
Su
´
arez, L., Berni, J. A., Goldhamer, D., and Fer-
eres, E. (2013). A pri-based water stress index com-
bining structural and chlorophyll effects: Assessment
using diurnal narrow-band airborne imagery and the
cwsi thermal index. Remote sensing of environment,
138:38–50.
Zhang, L., Zhang, H., Niu, Y., and Han, W. (2019). Map-
ping maize water stress based on uav multispectral re-
mote sensing. Remote Sensing, 11(6):605.
Zhao, T., Yang, Y., Niu, H., Wang, D., and Chen, Y. (2018).
Comparing u-net convolutional network with mask r-
cnn in the performances of pomegranate tree canopy
segmentation. In Multispectral, Hyperspectral, and
Ultraspectral Remote Sensing Technology, Techniques
and Applications VII, volume 10780, page 107801J.
International Society for Optics and Photonics.
Zortea, M., Macedo, M. M., Mattos, A. B., Ruga, B. C., and
Gemignani, B. H. (2018). Automatic citrus tree de-
tection from uav images based on convolutional neu-
ral networks. In 2018 31th SIBGRAPI Conference
on Graphics, Patterns and Images (SIBGRAPI), vol-
ume 11.
Zou, Z., Shi, Z., Guo, Y., and Ye, J. (2019). Object
detection in 20 years: A survey. arXiv preprint
arXiv:1905.05055.
